. 2023 Mar 6:14:1082602.
doi: 10.3389/fphar.2023.1082602. eCollection 2023.

Evaluation of therapeutic effects of tetramethylpyrazine nitrone in Alzheimer's disease mouse model and proteomics analysis

Affiliations

Evaluation of therapeutic effects of tetramethylpyrazine nitrone in Alzheimer's disease mouse model and proteomics analysis

Xinhua Zhou et al. Front Pharmacol. .

Abstract

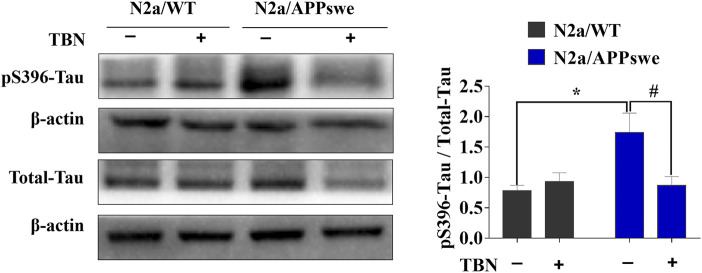
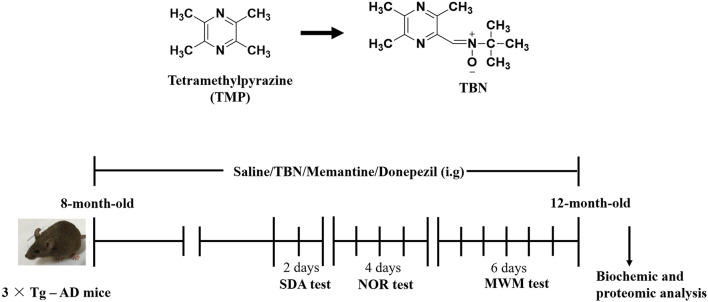
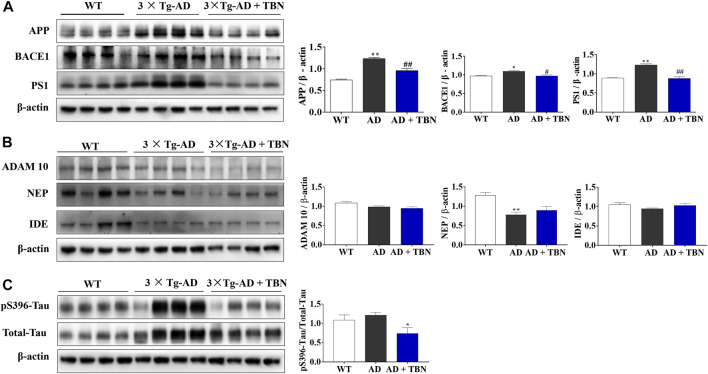
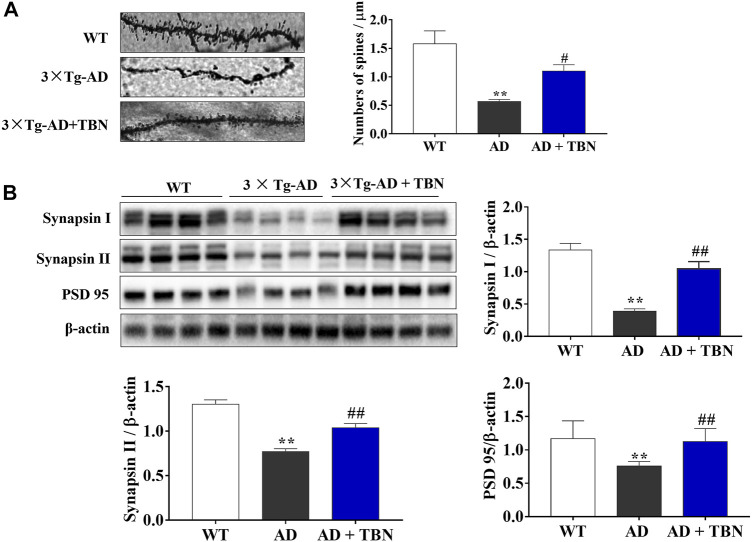
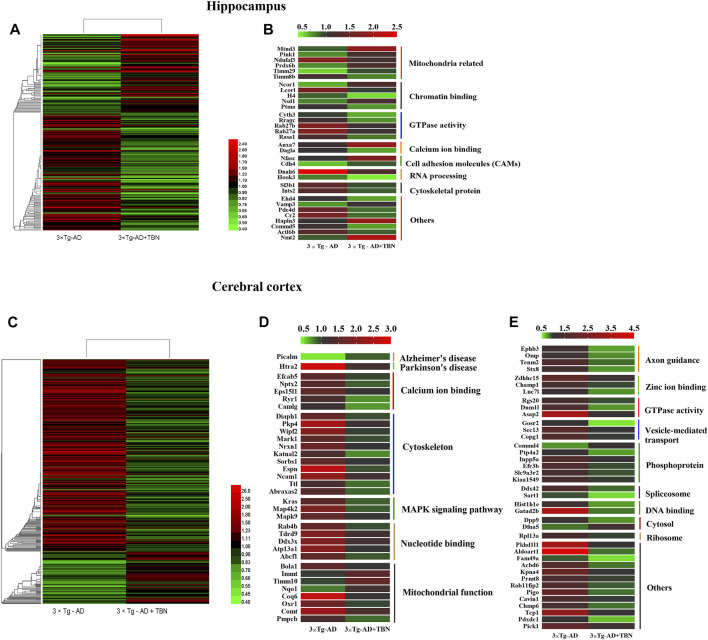
The pathophysiology of Alzheimer's disease (AD) is multifactorial with characteristic extracellular accumulation of amyloid-beta (Aβ) and intraneuronal aggregation of hyperphosphorylated tau in the brain. Development of disease-modifying treatment for AD has been challenging. Recent studies suggest that deleterious alterations in neurovascular cells happens in parallel with Aβ accumulation, inducing tau pathology and necroptosis. Therefore, therapies targeting cellular Aβ and tau pathologies may provide a more effective strategy of disease intervention. Tetramethylpyrazine nitrone (TBN) is a nitrone derivative of tetramethylpyrazine, an active ingredient from Ligusticum wallichii Franchat (Chuanxiong). We previously showed that TBN is a potent scavenger of free radicals with multi-targeted neuroprotective effects in rat and monkey models of ischemic stroke. The present study aimed to investigate the anti-AD properties of TBN. We employed AD-related cellular model (N2a/APPswe) and transgenic mouse model (3×Tg-AD mouse) for mechanistic and behavioral studies. Our results showed that TBN markedly improved cognitive functions and reduced Aβ and hyperphosphorylated tau levels in mouse model. Further investigation of the underlying mechanisms revealed that TBN promoted non-amyloidogenic processing pathway of amyloid precursor protein (APP) in N2a/APPswe in vitro. Moreover, TBN preserved synapses from dendritic spine loss and upregulated synaptic protein expressions in 3×Tg-AD mice. Proteomic analysis of 3×Tg-AD mouse hippocampal and cortical tissues showed that TBN induced neuroprotective effects through modulating mitophagy, MAPK and mTOR pathways. In particular, TBN significantly upregulated PINK1, a key protein for mitochondrial homeostasis, implicating PINK1 as a potential therapeutic target for AD. In summary, TBN improved cognitive functions in AD-related mouse model, inhibited Aβ production and tau hyperphosphorylation, and rescued synaptic loss and neuronal damage. Multiple mechanisms underlie the anti-AD effects of TBN including the modulation of APP processing, mTOR signaling and PINK1-related mitophagy.

Keywords: PINK1; alhzheimer disease; amyloid beta; proteomic analysis; tetramethylpyrazine nitrone.


Conflict of interest statement

The authors declare that the research was conducted in the absence of any commercial or financial relationships that could be construed as a potential conflict of interest.

Figures

FIGURE 1
FIGURE 1
TBN treatment inhibits amyloidogenic APP processing and promotes nonamyloidgenic APP processing in N2a/APPswe cells. The cell culture medium or cell lysates were collected after 24 h treatment with TBN (300 μμM). (A B) The level of the secreted and intracellular Aβ40/42 in N2a/WT and N2a/APPswe cells were measured by enzyme-linked immunosorbent assay (ELIAS). (C) Representative Western blots of APP, BACE1, PS1 and ß-actin in the N2a/WT and N2a/APPswe treated with or without TBN. (D–F) Representative Western blots of ADAM 10, CTF α, CTFβ, sAPPα, sAPPβ and ß-actin in the N2a/WT and N2a/APPswe treated with or without TBN. (G,H) Representative Western blots of IDE and NEP and ß-actin in the N2a/WT and N2a/APPswe treated with or without TBN. Values represent mean ± SEM, n ≥ 3, **p <0.01 vs N2a/WT Ctrl, # p < 0.05 or ## p < 0.01 vs. N2a/APPswe Ctrl, two-way ANOVA.
FIGURE 2
FIGURE 2
TBN treatment attenuates tau phosphorylation in N2a/APPswe. The levels of phosphorylated tau (pS396), total tau and ß-actin were determined by Western blotting. Values represent mean ± SEM, n = 4, *p < 0.05 vs. N2a/WT Ctrl, # p < 0.05 vs. N2a/APPswe Ctrl, two-way ANOVA.
FIGURE 3
FIGURE 3
Chemical structures and experimental design for animal model. The chemical structures of TMP and TBN. The process design of TBN treatment study in 3×Tg-AD mice. SDA test: step-down avoidance (SDA) test. NOR test: novel object recognition (NOR) test. MWM test: morris water maze (MWM) test.
FIGURE 4
FIGURE 4
TBN improved cognitive capabilities of 3×Tg-AD mice. (A, B) TBN (60 mg/kg) significantly increased the step-down latency in memory retention test and decreased the number of errors made by 3×Tg-AD mice in SDA test. Donepezil and Memantine as the positive drugs. Done: Donepezil; Mem: Memantine. (C) TBN improved the recognition memory as shown by an increased discrimination index in 3×Tg-AD mice in NOR test. (D–G) TBN improved spatial memory and cognitive deficits of 3×Tg-AD mice in MWM test. (D) Representative swim traces of mice in the MWM after removing the platform during probe test. (E) Escape latency of mice to reach the platform during training (Day 1–5). (F) The latency of mice to cross from starting position to target quadrant during probe test. (G) Number of annulus crossing in target quadrant during probe test. Data were presented as mean ± SD, n ≥ 12, *p < 0.05 or **p < 0.01 vs. WT group, # p < 0.05 or ## p < 0.01 vs. 3×Tg-AD group, one-way ANOVA.
FIGURE 5
FIGURE 5
TBN treatment reduced the levels of Aβ in 3×Tg-AD mice. (A–D) Levels of soluble and insoluble Aβ40/Aβ42 in homogenates of hippocampal tissues and cerebral cortex of 3×Tg-AD mice or WT mice were determined by using ELISA. (E) Immunohistochemical staining by Aβ antibody (6E10) in the subiculum of hippocampal tissues. Data were presented as mean ± SEM, n ≥ 4, *p < 0.05 or **p < 0.01 vs. WT group, # p < 0.05 or ## p < 0.01 vs. AD group, two-way ANOVA.
FIGURE 6
FIGURE 6
TBN treatment regulated APP processing and hyperphosphorylated tau in 3×Tg-AD mice. (A) Representative Western Blotting of APP, BACE1, PS1 and ß-actin in the hippocampal tissues of AD mice or WT mice. (B) Representative WB of ADAM10, NEP, IDE and ß-actin in the hippocampal tissues of AD mice or WT mice. (C) The levels of phosphorylated tau (pS396), total tau (Tau 5) and ß-actin were determined by Western blotting. Data were presented as mean ± SEM, n ≥ 4, *p < 0.05 or **p < 0.01 vs. WT group, # p < 0.05 or ## p < 0.01 vs. AD group, one-way ANOVA.
FIGURE 7
FIGURE 7
Effects of TBN on expression of synapse protein and dendritic spine loss. (A) Representative images of Golgi staining from hippocampal dendrites of 3×Tg-AD by confocal images (on the left). The number of dendritic spines is indicated within graph bars (on the right). (B) The levels of synapsin I, synapsin II and PSD 95 in the hippocampus of mice were measured by Western blotting. Data were presented as mean ± SEM, n ≥ 4. **p < 0.01 vs. WT group, # p < 0.05 or ## p < 0.01 vs. 3×Tg-AD group, one-way ANOVA.
FIGURE 8
FIGURE 8
Heat mapping of altered proteins by TBN treatment in AD mice. (A) Hierarchical clustering of 210 changed proteins in the hippocampus between 3×Tg-AD group and TBN group. (B) 32 significantly altered proteins in the hippocampus related to mitochondrial, calcium ion binding, cytoskeleton and RNA processing between 3×Tg-AD group and TBN group. (C) Hierarchical clustering of 401 changed proteins in the cerebral cortex between 3×Tg-AD group and TBN group. (D,E) 74 significantly altered proteins in the cerebral cortex related to cytoskeleton, MAPK signaling pathway, mitochondrion function, axon guidance and DNA binding were identified between 3×Tg-AD group and TBN group. Color of each cell stand for degree of protein expression, red cell indicated rising level and green cell indicated reducing level compared with WT group. Heat mapping was performed by Heml 1.0.3.7-Heatmap Illustrator. Classification was performed by GraphPad Prism 7.0.
FIGURE 9
FIGURE 9
Venn diagram of two repeated analysis of the significant changed protein in the hippocampus and cerebral cortex. (A) The Venn diagram showing the overlap of differently expressed proteins after TBN treatment. (B) The PPI network of the 32 proteins.
FIGURE 10
FIGURE 10
Bioinformatics analysis of differentially expressed proteins of hippocampus and cerebral cortex. 210 (Hippocampus AD) and 401 (Cerebral Cortex AD) changed proteins in the hippocampus and cerebral cortex, respectively, were analyzed by DAVID GO analysis and KEGG analysis. Proteins were functionally annotated in according to their biological process, cellular component and molecular function terms, and listed according to the –Log10 (p-value).
FIGURE 11
FIGURE 11
Protein-protein interaction (PPI) analysis of significantly changed proteins of hippocampus and cerebral cortex using STRING database and mapped by using Cytoscape 3.6.0. (A) PPI network of 210 differentially expressed proteins of hippocampus. (B) PPI network of 401 differentially expressed proteins of cerebral cortex. Circles indicate protein, gray lines indicate the interactions between two proteins, red node indicate upregulated proteins, and blue node indicate downregulated proteins.
FIGURE 12
FIGURE 12
(A,B) All the identified proteins of hippocampus or cerebral cortex in the proteomics were imported into Cytoscape software to map electron transport chain based on the published database. The red boxes indicate up-regulated protein (ratio>1.2), blue boxes indicate down-regulated protein (ratio<0.83), white boxes indicate the indistinctively changed proteins and gray boxes stand for the unidentified proteins in this proteomic study.
FIGURE 13
FIGURE 13
Visualization of altered protein by TBN treatment in the ribosome pathway between hippocampus and cerebral cortex. All the identified proteins of hippocampus or cerebral cortex in the proteomics were imported into Cytoscape software to map ribosome Wiki pathways based on the published database. The red boxes indicate upregulated protein (ratio ≥1.2), blue boxes indicate downregulated protein (ratio< 0.83), white boxes indicate the indistinctively changed proteins and gray boxes stand for the unidentified proteins in this proteomic study.
FIGURE 14
FIGURE 14
Validation of altered proteins identified by Western blot. Samples of hippocampal tissues (same samples as in proteomic study) were evaluated by Western blot. Representative blotting of PINK1, CADH4, SOD1, ATG3, VAMP3, CRTC1, LST8 and RRAGC in the hippocampal tissues of AD mice or WT mice were showed. Data were presented as mean ± SEM, n ≥ 6, **p < 0.01 vs. WT group, # p < 0.05 or ## p < 0.01 vs. AD group, one-way ANOVA.

Similar articles

Cited by

References

    1. Ali A. A. (2016). Alzheimer's disease: Pathophysiology, hypotheses and treatment strategies. Acta Psychopathol. 2. 10.4172/2469-6676.100049 - DOI
    1. Ashleigh T., Swerdlow R. H., Beal M. F. (2022). The role of mitochondrial dysfunction in Alzheimer's disease pathogenesis. Alzheimers Dement. 19, 333–342. 10.1002/alz.12683 - DOI - PubMed
    1. Butterfield D. A., Boyd-Kimball D., Castegna A. (2003). Proteomics in alzheimer's disease: Insights into potential mechanisms of neurodegeneration. J. Neurochem. 86 (6), 1313–1327. 10.1046/j.1471-4159.2003.01948.x - DOI - PubMed
    1. De Strooper B., Karran E. (2016). The cellular phase of alzheimer's disease. Cell 164 (4), 603–615. 10.1016/j.cell.2015.12.056 - DOI - PubMed
    1. Drummond E., Nayak S., Faustin A., Pires G., Hickman R. A., Askenazi M., et al. (2017). Proteomic differences in amyloid plaques in rapidly progressive and sporadic Alzheimer's disease. Acta Neuropathol. 133 (6), 933–954. 10.1007/s00401-017-1691-0 - DOI - PMC - PubMed