

Speed-resolved perfusion imaging using multi-exposure laser speckle contrast imaging and machine learning
- PMID: 36950019
- PMCID: PMC10027009
- DOI: 10.1117/1.JBO.28.3.036007
Speed-resolved perfusion imaging using multi-exposure laser speckle contrast imaging and machine learning
Abstract
Significance: Laser speckle contrast imaging (LSCI) gives a relative measure of microcirculatory perfusion. However, due to the limited information in single-exposure LSCI, models are inaccurate for skin tissue due to complex effects from e.g. static and dynamic scatterers, multiple Doppler shifts, and the speed-distribution of blood. It has been demonstrated how to account for these effects in laser Doppler flowmetry (LDF) using inverse Monte Carlo (MC) algorithms. This allows for a speed-resolved perfusion measure in absolute units %RBC × mm/s, improving the physiological interpretation of the data. Until now, this has been limited to a single-point LDF technique but recent advances in multi-exposure LSCI (MELSCI) enable the analysis in an imaging modality.
Aim: To present a method for speed-resolved perfusion imaging in absolute units %RBC × mm/s, computed from multi-exposure speckle contrast images.
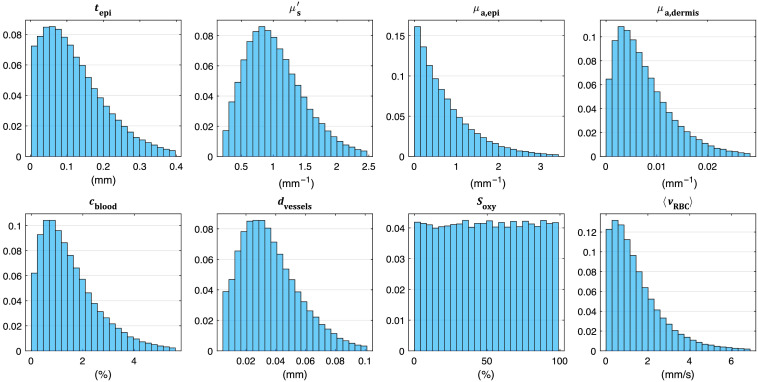
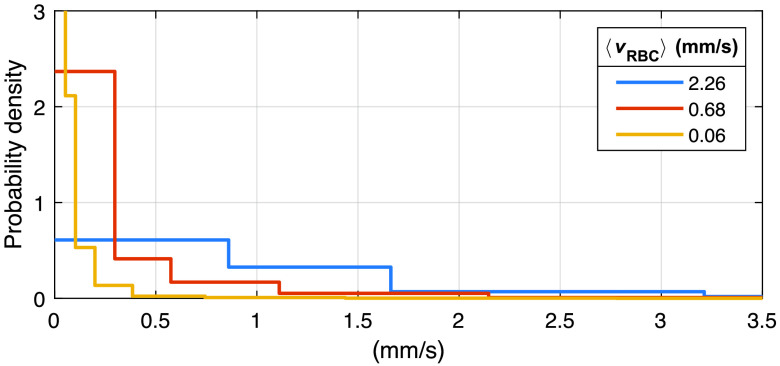
Approach: An artificial neural network (ANN) was trained on a large simulated dataset of multi-exposure contrast values and corresponding speed-resolved perfusion. The dataset was generated using MC simulations of photon transport in randomized skin models covering a wide range of physiologically relevant geometrical and optical tissue properties. The ANN was evaluated on in vivo data sets captured during an occlusion provocation.
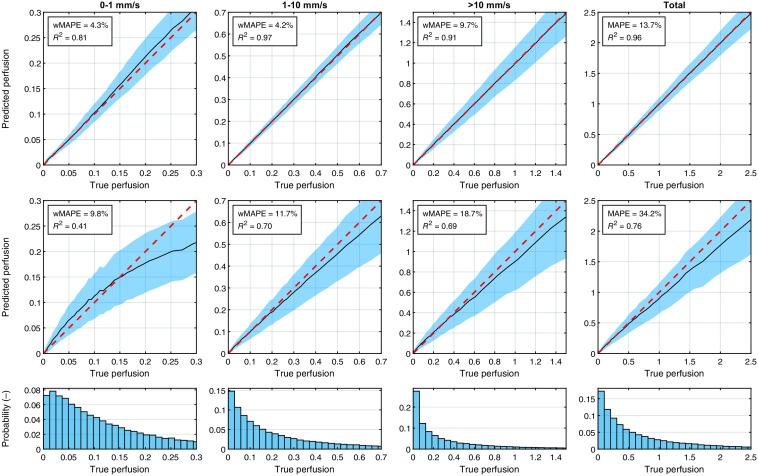
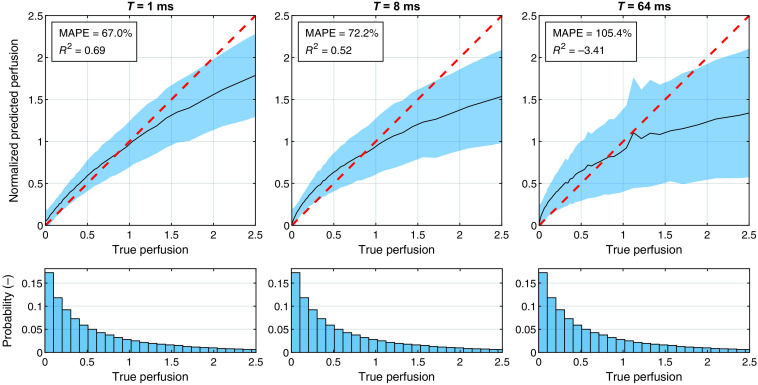
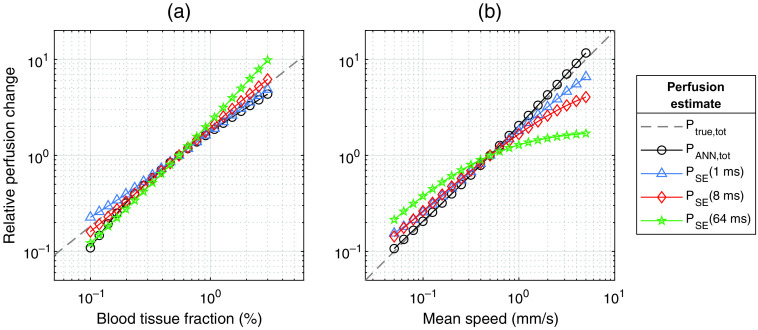
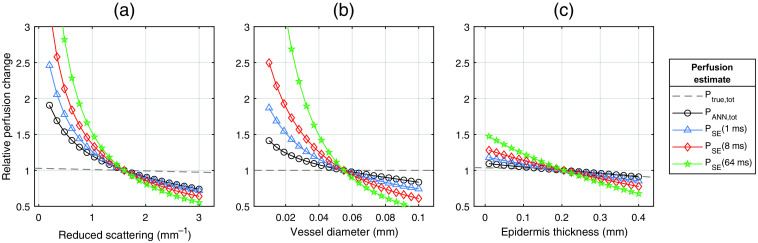
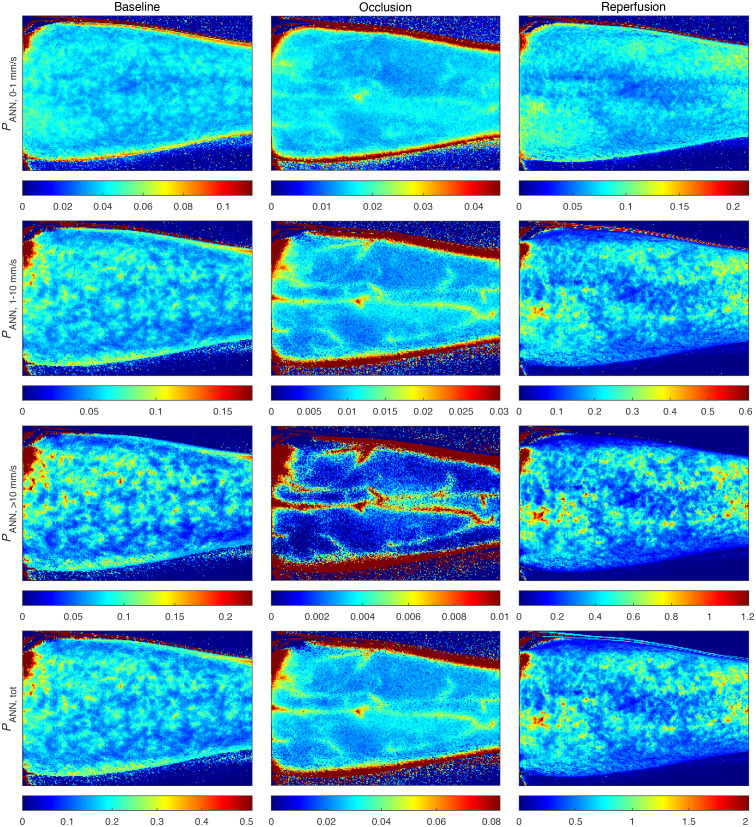
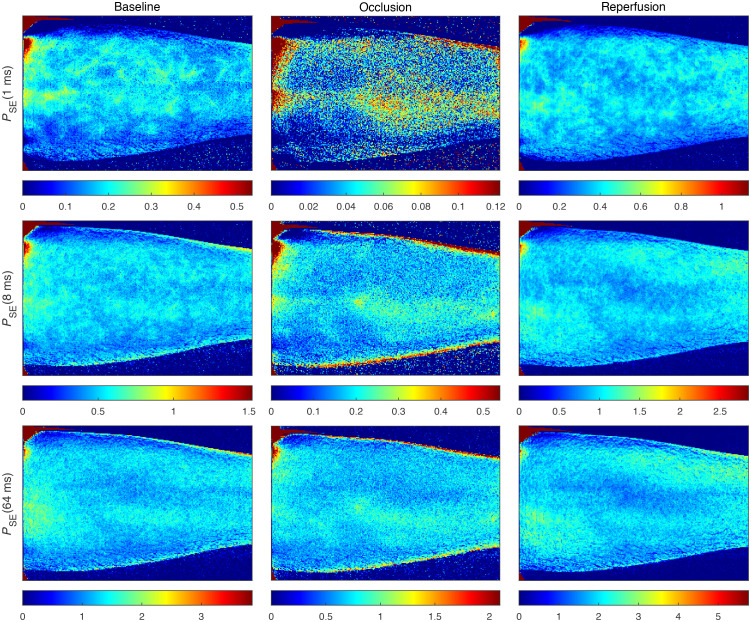
Results: Speed-resolved perfusion was estimated in the three speed intervals 0 to , 1 to , and , with relative errors 9.8%, 12%, and 19%, respectively. The perfusion had a linear response to changes in both blood tissue fraction and blood flow speed and was less affected by tissue properties compared with single-exposure LSCI. The image quality was subjectively higher compared with LSCI, revealing previously unseen macro- and microvascular structures.
Conclusions: The ANN, trained on modeled data, calculates speed-resolved perfusion in absolute units from multi-exposure speckle contrast. This method facilitates the physiological interpretation of measurements using MELSCI and may increase the clinical impact of the technique.
Keywords: artificial neural networks; blood flow; microcirculation; multi-exposure laser speckle contrast imaging.
© 2023 The Authors.
Figures


Similar articles
-
Real-time video-rate perfusion imaging using multi-exposure laser speckle contrast imaging and machine learning.J Biomed Opt. 2020 Nov;25(11):116007. doi: 10.1117/1.JBO.25.11.116007. J Biomed Opt. 2020. PMID: 33191685 Free PMC article.
-
Machine learning in multiexposure laser speckle contrast imaging can replace conventional laser Doppler flowmetry.J Biomed Opt. 2019 Jan;24(1):1-11. doi: 10.1117/1.JBO.24.1.016001. J Biomed Opt. 2019. PMID: 30675771 Free PMC article.
-
Day-to-day variability in cutaneous microcirculation measured with multi-exposure laser speckle contrast imaging and multispectral imaging.Microvasc Res. 2025 Jul;160:104819. doi: 10.1016/j.mvr.2025.104819. Epub 2025 May 14. Microvasc Res. 2025. PMID: 40378918
-
Assessing skin microcirculation in patients at cardiovascular risk by using laser speckle contrast imaging. A narrative review.Clin Physiol Funct Imaging. 2023 Jul;43(4):211-222. doi: 10.1111/cpf.12819. Epub 2023 Apr 14. Clin Physiol Funct Imaging. 2023. PMID: 37020404 Review.
-
Optical techniques for perfusion monitoring of the gastric tube after esophagectomy: a review of technologies and thresholds.Dis Esophagus. 2018 Jun 1;31(6). doi: 10.1093/dote/dox161. Dis Esophagus. 2018. PMID: 29701760 Review.
Cited by
-
Multi-exposure Laser Speckle Contrast Imaging (MECI)-Based Prediction of Blood Flow Using Random Forest (RF) With K-Means (KM).Cureus. 2023 Jun 12;15(6):e40345. doi: 10.7759/cureus.40345. eCollection 2023 Jun. Cureus. 2023. PMID: 37456452 Free PMC article.
-
Prediction of motion artifacts caused by translation in handheld laser speckle contrast imaging.J Biomed Opt. 2023 Apr;28(4):046005. doi: 10.1117/1.JBO.28.4.046005. Epub 2023 Apr 18. J Biomed Opt. 2023. PMID: 37082096 Free PMC article.
References
-
- Humeau-Heurtier A., et al. , “Skin perfusion evaluation between laser speckle contrast imaging and laser Doppler flowmetry,” Opt. Commun. 291, 482–487 (2013).OPCOB810.1016/j.optcom.2012.11.054 - DOI
