. 2023 Feb 25;26(4):106275.
doi: 10.1016/j.isci.2023.106275. eCollection 2023 Apr 21.

Matrix stiffness induces epithelial-to-mesenchymal transition via Piezo1-regulated calcium flux in prostate cancer cells

Affiliations

Matrix stiffness induces epithelial-to-mesenchymal transition via Piezo1-regulated calcium flux in prostate cancer cells

Maria Lopez-Cavestany et al. iScience. .

Abstract

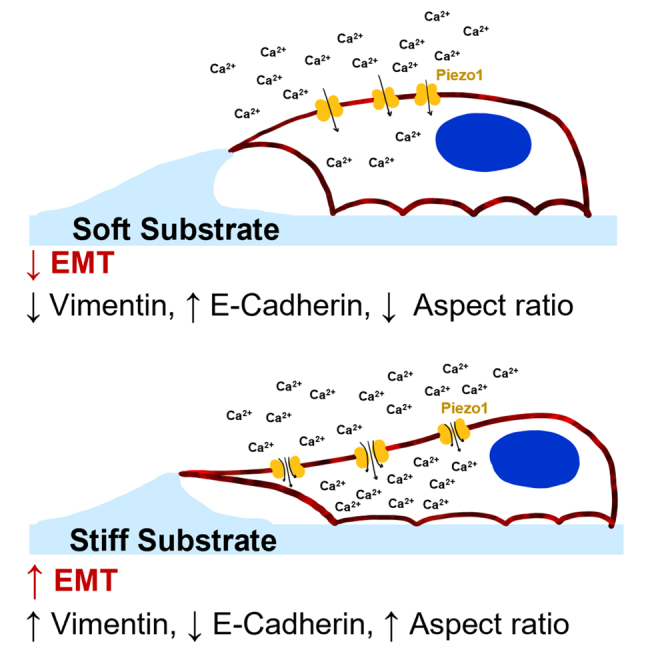
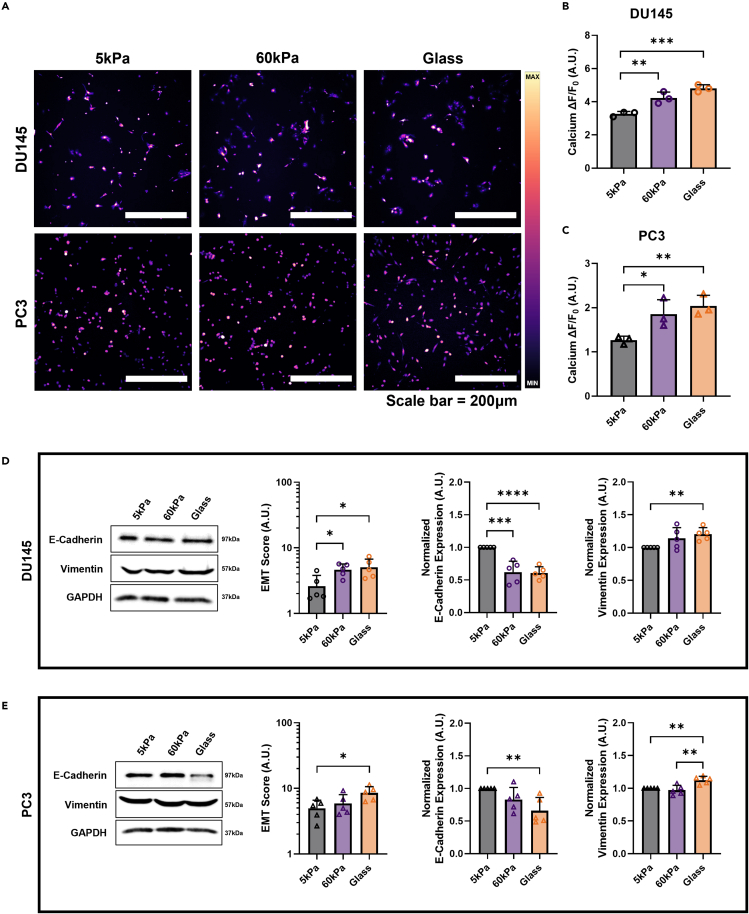
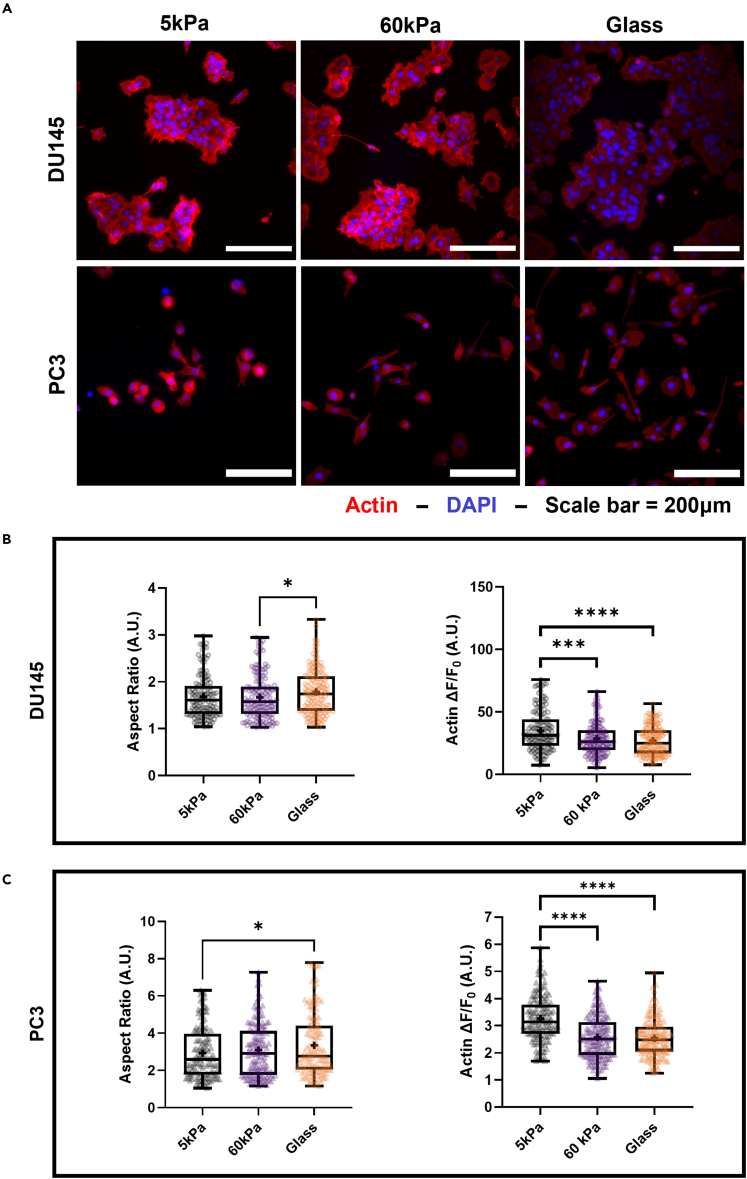
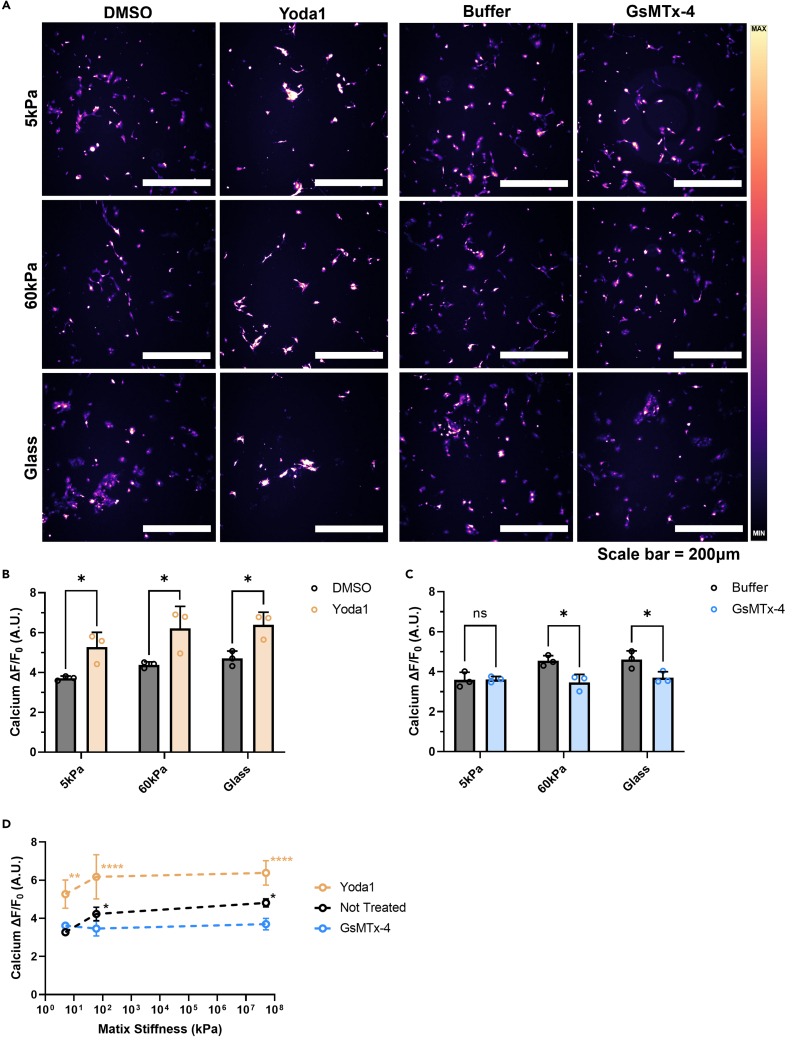
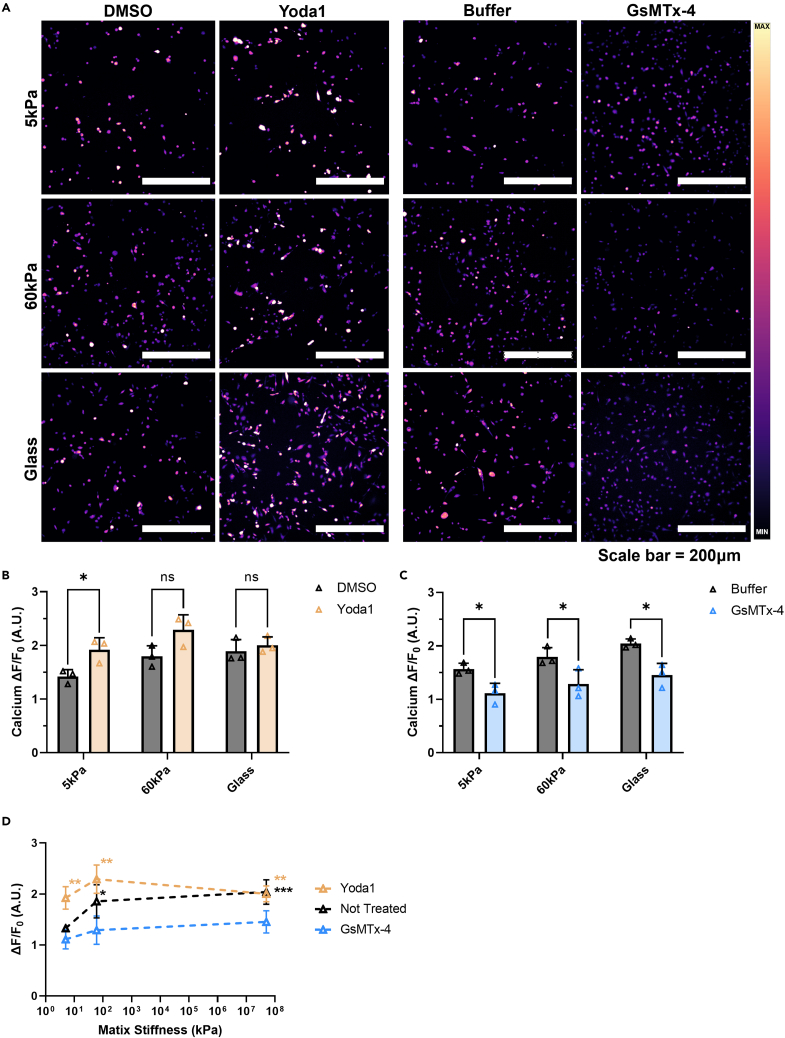
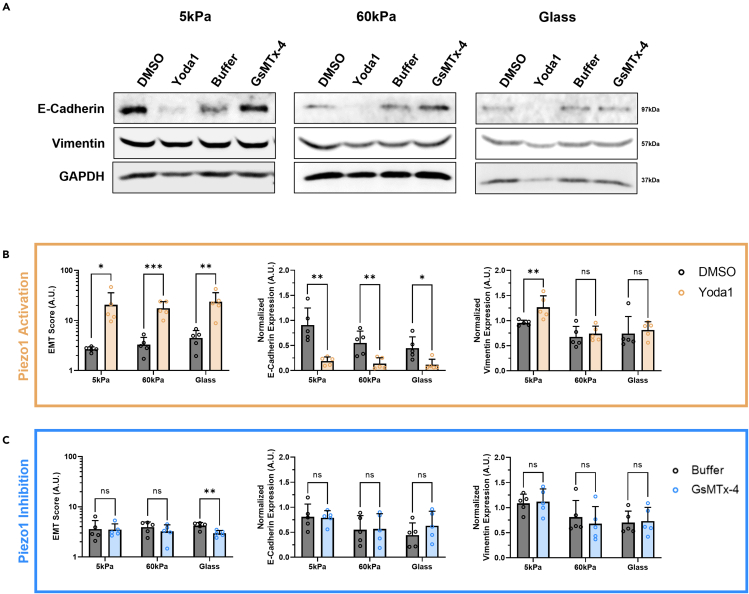
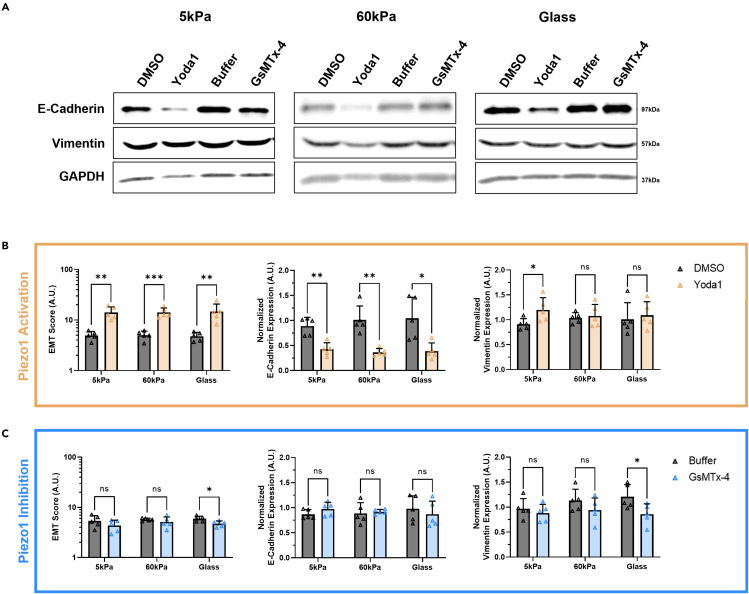
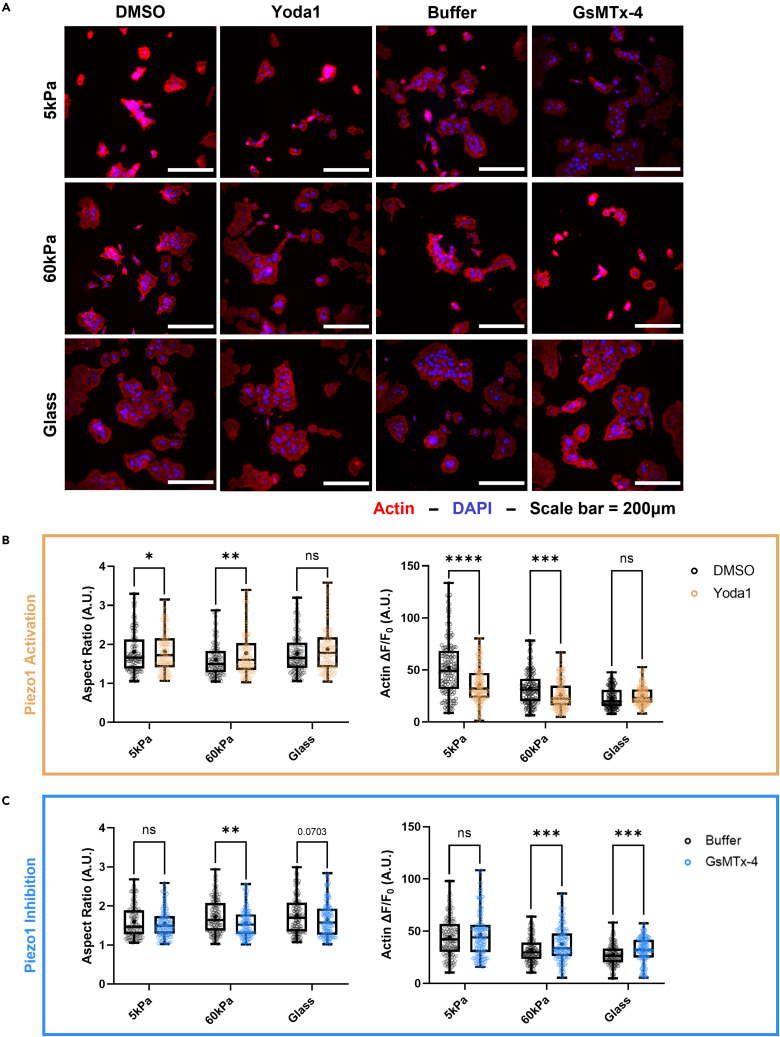
Cells utilize calcium channels as one of the main signaling mechanisms to sense changes in the extracellular space and convert these changes to intracellular signals. Calcium regulates several key signaling networks, such as the induction of EMT. The current study expands on the understanding of how EMT is controlled via the mechanosensitive calcium channel Piezo1 in cancerous cells, which senses changes in the extracellular matrix stiffness. We model the biophysical environment of healthy and cancerous prostate tissue using polyacrylamide gels of different stiffnesses. Significant increases in calcium steady-state concentration, vimentin expression, and aspect ratio, and decreases in E-cadherin expression were observed by increasing matrix stiffness and also after treatment with Yoda1, a chemical agonist of Piezo1. Overall, this study concludes that Piezo1-regulated calcium flux plays a role in prostate cancer cell metastatic potential by sensing changes in ECM stiffness and modulating EMT markers.

Keywords: Biological sciences; Cancer; Cell biology.


Conflict of interest statement

The authors declare no competing interests.

Figures

None
Graphical abstract
Figure 1
Figure 1
Effect of stiffness on intracellular calcium concentration and EMT-related protein expression shifts (A) Micrographs displaying the increase of Fluo-4 mean fluorescence with stiffness. Quantification of the changes in intracellular calcium concentration in cells grown on 5 kPa PA gels, 60 kPa PA gels, and the glass control in (B) DU145 cells and (C) PC3 cells. Western blot results for the (D) DU145 cells and (E) PC3 cells showing representative images and quantification of EMT Score (Vimentin/E-Cadherin), normalized vimentin expression, and normalized E-cadherin expression. Scale bar = 200 μm. Intracellular calcium concentration graphs display the mean ± SD for n=3. Western blot quantification graphs display the mean ± SD for n=5 replicates. Statistical significance is shown as ∗ for p < 0.05, ∗∗ for p < 0.01, ∗∗∗ for p < 0.001, and ∗∗∗∗ for p < 0.0001, as evaluated by unpaired, parametric t-tests.
Figure 2
Figure 2
Effect of stiffness on EMT morphology of prostate cancer cells (A) Micrographs of DU145 and PC3 cells grown on the 3 different substrates and stained with ActinRed555 and DAPI. Quantification of increasing aspect ratio and decreasing F-actin fluorescence with stiffness in the (B) DU145 and (C) PC3 cells. Scale bar = 200 μm. Graphs display the boxplot from min to max of n = 50 sample size for each of the 3 biological replicates. Statistical significance is shown as ∗ for p < 0.05, ∗∗ for p < 0.01, ∗∗∗ for p < 0.001, and ∗∗∗∗ for p < 0.0001, as evaluated by unpaired, parametric t-tests.
Figure 3
Figure 3
Effects of pharmacological activation and inhibition on intracellular calcium concentration at different stiffnesses in DU145 cells (A) Micrographs displaying Fluo-4 fluorescence of DU145 cells grown on 5 kPa, 60 kPa, and glass substrates and treated with Yoda1, GsMTx-4, and their vehicle controls (DMSO and buffer, respectively). (B) Difference in intracellular calcium concentration between DMSO- and Yoda1-treated. (C) Changes in ΔF/F0 with buffer or GsMTx-4 treatment of cells. (D) Summary of pharmacological activation and inhibition of Piezo1 on soft and stiff gels, and the glass control compared to the cells that did not receive any treatment. Scale bar = 200 μm. Graphs display the mean ± SD for n = 3 replicates. Statistical significance is shown as ∗ for p < 0.05, ∗∗ for p < 0.01, ∗∗∗ for p < 0.001, and ∗∗∗∗ for p < 0.0001, as evaluated by unpaired, parametric t-tests.
Figure 4
Figure 4
Effects of pharmacological activation and inhibition on intracellular calcium concentration at different stiffnesses in PC3 cells (A) Micrographs displaying Fluo-4 fluorescence of PC3 cells grown on 5 kPa, 60 kPa, and glass substrates and treated with Yoda1, GsMTx-4, and the vehicle controls (DMSO and Buffer, respectively). (B) Difference in intracellular calcium concentration between DMSO- and Yoda1-treated cells. (C) Changes in ΔF/F0 with buffer or GsMTx-4 treatment of cells. (D) Summary of pharmacological activation and inhibition of Piezo1 on soft and stiff gels, and the glass control compared to cells that did not receive any treatment. Scale bar = 200 μm. Graphs display the mean ± SD for n = 3 replicates. Statistical significance is shown as ∗ for p < 0.05, ∗∗ for p < 0.01, ∗∗∗ for p < 0.001, and ∗∗∗∗ for p < 0.0001, as evaluated by unpaired, parametric t-tests.
Figure 5
Figure 5
Western blots showing the effects of pharmacological activation and inhibition of Piezo1 on substrates of increasing stiffness on EMT-related protein expression in DU145 cells (A) Qualitative images of the western blot results showing changing E-cadherin and vimentin expression in DU145 cells with matrix stiffness and treatments compared to the housekeeping protein GAPDH. (B) Quantification of the western blot bands showing increasing EMT score, decreasing E-cadherin expression, and increasing vimentin expression in DU145 cells treated with Yoda1 compared to the DMSO vehicle control. (C) Quantification of the western blot bands showing changes in EMT score, normalized E-cadherin expression, and normalized vimentin expression in DU145 cells treated with GsMTx-4 compared to the buffer vehicle control. Graphs display the mean ± SD for n=5 replicates normalized to the not treated, 5 kPa group. Statistical significance is shown as ∗ for p < 0.05, ∗∗ for p < 0.01, ∗∗∗ for p < 0.001, and ∗∗∗∗ for p < 0.0001, as evaluated by unpaired, parametric t-tests.
Figure 6
Figure 6
Western blots showing the effects of pharmacological activation and inhibition of Piezo1 on substrates of increasing stiffness on EMT-related protein expression in PC3 cells (A) Qualitative images of the western blot results showing differential E-cadherin and vimentin expression in PC3 cells with matrix stiffness and treatments compared to GAPDH. (B) Quantification of the western blot bands showing increasing EMT score, decreasing E-cadherin expression, and increasing vimentin expression in PC3 cells treated with Yoda1 compared to DMSO vehicle control. (C) Quantification of the western blot bands showing changes in EMT score, normalized E-cadherin expression, and normalized vimentin expression in PC3 cells treated with GsMTx-4 compared to the buffer vehicle control. Graphs display the mean ± SD for n=5 replicates normalized to the not treated, 5 kPa group. Statistical significance is shown as ∗ for p < 0.05, ∗∗ for p < 0.01, ∗∗∗ for p < 0.001, and ∗∗∗∗ for p < 0.0001, as evaluated by unpaired, parametric t-tests.
Figure 7
Figure 7
Effects of Yoda1 treatment on the aspect ratio and F-actin fluorescence of DU145 cells incubated on substrates of increasing stiffness (A) Micrographs showing DU145 cells on soft and hard PA gels, as well as the glass control stained with ActinRed555 and DAPI after treatments with Yoda1, GsMTx-4, and their vehicle controls (DMSO and buffer, respectively). (B) Quantification of aspect ratio and F-actin fluorescence of the DU145 cells in each stiffness condition comparing Yoda1 treatment to the DMSO control. (C) Quantification of aspect ratio and F-actin fluorescence in each stiffness condition comparing GsMTx-4 treatment to the buffer vehicle control. Scale bar = 200 μm. Graphs display the boxplot from min to max of n = 50 sample size for each of the 3 biological replicates. Statistical significance is shown as ∗ for p < 0.05, ∗∗ for p < 0.01, ∗∗∗ for p < 0.001, and ∗∗∗∗ for p < 0.0001, as evaluated by unpaired, parametric t-tests.
Figure 8
Figure 8
Effects of Yoda 1 treatment on the aspect ratio and F-actin fluorescence of PC3 cells incubated on substrates of increasing stiffness (A) Micrographs showing PC3 cells on soft and hard PA gels, as well as the glass control stained with ActinRed555 and DAPI after treatments with Yoda1, GsMTx-4, and their vehicle controls (DMSO and Buffer, respectively). (B) Quantification of aspect ratio and F-actin fluorescence of the PC3 cells in each stiffness condition comparing Yoda1 treatment to the DMSO control. (C) Quantification of aspect ratio and F-actin fluorescence at each stiffness condition comparing GsMTx-4 treatment to the buffer vehicle control. Scale bar = 200 μm. Graphs display the boxplot from min to max of n = 50 sample size for each of the 3 biological replicates. Statistical significance is shown as ∗ for p < 0.05, ∗∗ for p < 0.01, ∗∗∗ for p < 0.001, and ∗∗∗∗ for p < 0.0001, as evaluated by unpaired, parametric t-tests.

Similar articles

Cited by

References

    1. Jolly M.K., Ware K.E., Gilja S., Somarelli J.A., Levine H. EMT and MET: necessary or permissive for metastasis? Mol. Oncol. 2017;11:755–769. doi: 10.1002/1878-0261.12083. - DOI - PMC - PubMed
    1. Kalluri R., Weinberg R.A. The basics of epithelial-mesenchymal transition. J. Clin. Invest. 2009;119:1420–1428. doi: 10.1172/JCI39104. - DOI - PMC - PubMed
    1. Heerboth S., Housman G., Leary M., Longacre M., Byler S., Lapinska K., Willbanks A., Sarkar S. EMT and tumor metastasis. Clin. Transl. Med. 2015;4:6. doi: 10.1186/s40169-015-0048-3. - DOI - PMC - PubMed
    1. Roche J. The epithelial-to-mesenchymal transition in cancer. Cancers. 2018;10:52. doi: 10.3390/cancers10020052. - DOI - PMC - PubMed
    1. Emon B., Bauer J., Jain Y., Jung B., Saif T. Biophysics of tumor microenvironment and cancer metastasis - a mini review. Comput. Struct. Biotechnol. J. 2018;16:279–287. doi: 10.1016/j.csbj.2018.07.003. - DOI - PMC - PubMed

LinkOut - more resources