. 2023 Feb 7;14(3):1041-1053.
doi: 10.1364/BOE.480091. eCollection 2023 Mar 1.

Deep learning-based fusion of widefield diffuse optical tomography and micro-CT structural priors for accurate 3D reconstructions

Affiliations

Deep learning-based fusion of widefield diffuse optical tomography and micro-CT structural priors for accurate 3D reconstructions

Navid Ibtehaj Nizam et al. Biomed Opt Express. .

Abstract

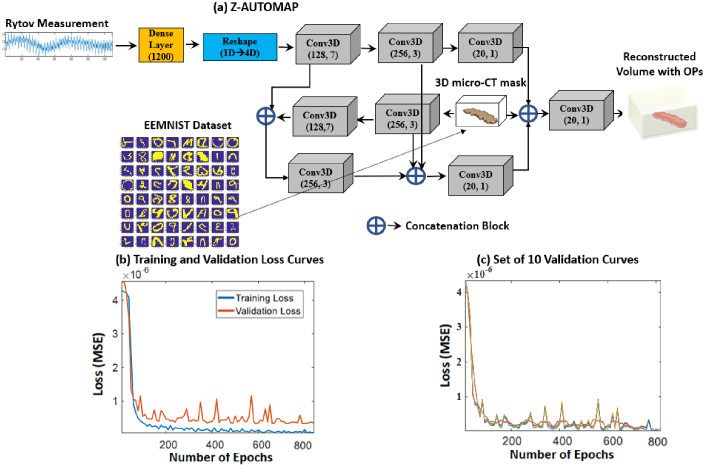
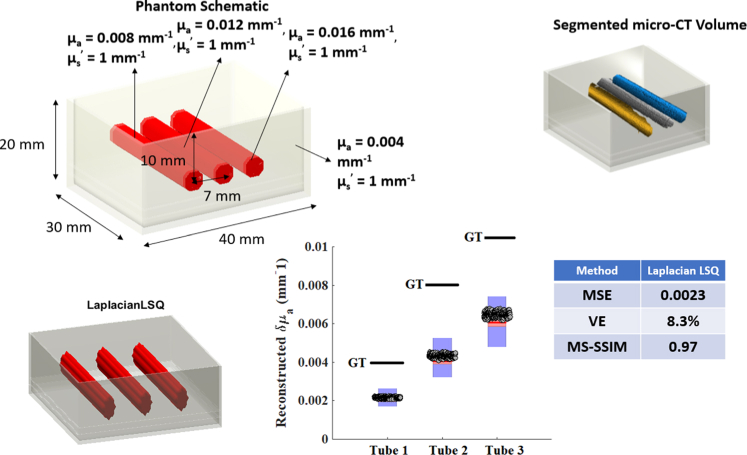
Widefield illumination and detection strategies leveraging structured light have enabled fast and robust probing of tissue properties over large surface areas and volumes. However, when applied to diffuse optical tomography (DOT) applications, they still require a time-consuming and expert-centric solving of an ill-posed inverse problem. Deep learning (DL) models have been recently proposed to facilitate this challenging step. Herein, we expand on a previously reported deep neural network (DNN) -based architecture (modified AUTOMAP - ModAM) for accurate and fast reconstructions of the absorption coefficient in 3D DOT based on a structured light illumination and detection scheme. Furthermore, we evaluate the improved performances when incorporating a micro-CT structural prior in the DNN-based workflow, named Z-AUTOMAP. This Z-AUTOMAP significantly improves the widefield imaging process's spatial resolution, especially in the transverse direction. The reported DL-based strategies are validated both in silico and in experimental phantom studies using spectral micro-CT priors. Overall, this is the first successful demonstration of micro-CT and DOT fusion using deep learning, greatly enhancing the prospect of rapid data-integration strategies, often demanded in challenging pre-clinical scenarios.


Conflict of interest statement

The authors declare no conflicts of interest.

Figures

Fig. 1.
Fig. 1.
(a) Snapshot of some of the EEMNIST characters used for training. (b) An example in silico phantom with a random embedding with a reduced scattering coefficient, μse , of 1 mm1 and an absorption coefficient, μae , of 0.008 mm1 . The background reducing scattering coefficient, μsb , and background absorption coefficient, μab , are 1 mm1 and 0.004 mm1 , respectively. Hence, the δμa value is 0.004 mm1 . These values are relevant to soft tissues. The embedding is placed at a depth of 6 mm from the illumination plane. (c) Illumination and detection bar patterns acquired experimentally and used on MCX to generate the measurement vectors. (d) Widefield transmission setup on MCX, showing the illumination and detection planes. Two cylinders (with different OPs) have been placed as embeddings for visualization. (e) Simulated perturbed ( ϕ , shown in red) and unperturbed ( ϕo , shown in blue) measurement vectors obtained from MCX for the sample embedding in (b).
Fig. 2.
Fig. 2.
(a) The Modified AUTOMAP (ModAM) architecture used for 3D reconstructions in widefield DOT. For our work, the network inputs a Rytov-normalized measurement vector and outputs a 3D δμa reconstruction map of dimension 30×40×20 mm3 . ReLU activation follows each convolutional layer. (b) Typical training and validation loss curves obtained by training the ModAM network.(c) A set of 10 validation curves obtained using training the same network 10 times by shuffling the training dataset.
Fig. 3.
Fig. 3.
(a) The proposed Z-AUTOMAP architecture. It consists of a bi-directional flow where the convulational layers are concatenated to combine features extracted from the normalized 3D micro-CT mask (for training purposes, they are the GT intensity masks derived from the same EEMNIST character from which the Rytov measurement is calculated) and the Rytov measurement vector. The output of the network is again a 3D δμa reconstruction map of dimension 30×40×20 mm3 . ReLU activation is applied after each convolutional layer. (b) Typical training and validation loss curves obtained by training the Z-AUTOMAP network.(c) A set of 10 validation curves obtained using training the same network 10 times by shuffling the training dataset.
Fig. 4.
Fig. 4.
(a) The obtained in silico results for a phantom with a single embedding placed at a depth of 2mm from the plane of illumination in terms of the iso-volume, 2D cross-sections at a depth of 2 mm, and a graph showing the average distribution of δμa values over the 2D cross-sections. The results are tabulated quantitatively in terms of the MSE, the VE, and the MS-SSIM. (b) The results for a phantom with 3 embeddings placed at the same depth of 2 mm and having the same δμa value. The results for LSQ are produced at an iso-volume 30 % of the maximum value. (c) Reconstructions results for 3 embeddings placed at 3 different depths from the plane of illumination. Each embedding has a different δμa value. The black lines represent the GT δμa values for each embedding. All the results for are produced at an iso-volume of 30% of the maximum value.
Fig. 5.
Fig. 5.
A simplified schematic of the experimental setup. It consists of an illumination DMD and a detection DMD in transmission configuration (along with their associated optics). The illumination DMD is fed by a single wavelength (of 740 nm) from the Acousto-Optic Tunable Filter (AOTF) connected to a Supercontinnum (SuperK-EXR20) laser. The detection DMD applies the detection patterns and feeds the transmitted light to a 16-channel Spectro-photometer (PML-16C) which connects to a computer, containing the associated data-acquisition cards and software (SPC-150, DCC-100, and PCIe) for detecting and recording the data.
Fig. 6.
Fig. 6.
(a) Reconstruction results for the first experimental phantom having three thin capillaries embedded at a depth of 8.5 mm from the plane of illumination. Each embedding has a different δμa value ( 0.004 mm1 , 0.008 mm1 , and 0.012 mm1 ). (b) The results for the second experimental phantom with two of the tubes placed at depths of 6 mm and 16 mm from the plane of illumination. The middle tube is slanted and extends from 6 mm to 16 mm. The two tubes at the sides have a δμa value of 0.004 mm1 , while the middle tube has δμa value of 0.008 mm1 . The results are shown in terms of the reconstructed iso-volumes, averaged δμa distribution over the 2D planes, and quantitatively in terms of the MSE and the VE. The The results for LSQ, ModAM, and Z-AUTOMAP are produced at an iso-volume of 30% of the maximum value. The black lines represent the GT δμa values for each tube. The segmented micro-CT volumes are also shown in both cases.
Fig. 7.
Fig. 7.
Reconstruction results for the first experimental phantom having three thin capillaries embedded at a depth of 8.5 mm from the plane of illumination. Each embedding has a different δμa value ( 0.004 mm1 , 0.008 mm1 , and 0.012 mm1 ), obtained using a Laplacian-guided regularized LSQ-based technique. As before, the 3D reconstruction results are obtained using an iso-volume of 30% of the maximum value.

References

    1. Yodh A., Chance B., “Spectroscopy and imaging with diffusing light,” Phys. Today 48(3), 34–40 (1995).10.1063/1.881445 - DOI
    1. Intes X., Chance B., “Non-pet functional imaging techniques: optical,” Radiol. Clin. North Am. 43(1), 221–234 (2005).10.1016/j.rcl.2004.07.002 - DOI - PubMed
    1. Grosenick D., Rinneberg H., Cubeddu R., Taroni P., “Review of optical breast imaging and spectroscopy,” J. Biomed. Opt. 21(9), 091311 (2016).10.1117/1.JBO.21.9.091311 - DOI - PubMed
    1. Bélanger S., Abran M., Intes X., Casanova C., Lesage F., “Real-time diffuse optical tomography based on structured illumination,” J. Biomed. Opt. 15(1), 016006 (2010).10.1117/1.3290818 - DOI - PubMed
    1. Chen J., Venugopal V., Lesage F., Intes X., “Time-resolved diffuse optical tomography with patterned-light illumination and detection,” Opt. Lett. 35(13), 2121–2123 (2010).10.1364/OL.35.002121 - DOI - PMC - PubMed

LinkOut - more resources