. 2023 Feb 6;3(3):100261.
doi: 10.1016/j.xgen.2023.100261. eCollection 2023 Mar 8.

The Foundational Data Initiative for Parkinson Disease: Enabling efficient translation from genetic maps to mechanism

Affiliations

The Foundational Data Initiative for Parkinson Disease: Enabling efficient translation from genetic maps to mechanism

Elisangela Bressan et al. Cell Genom. .

Abstract

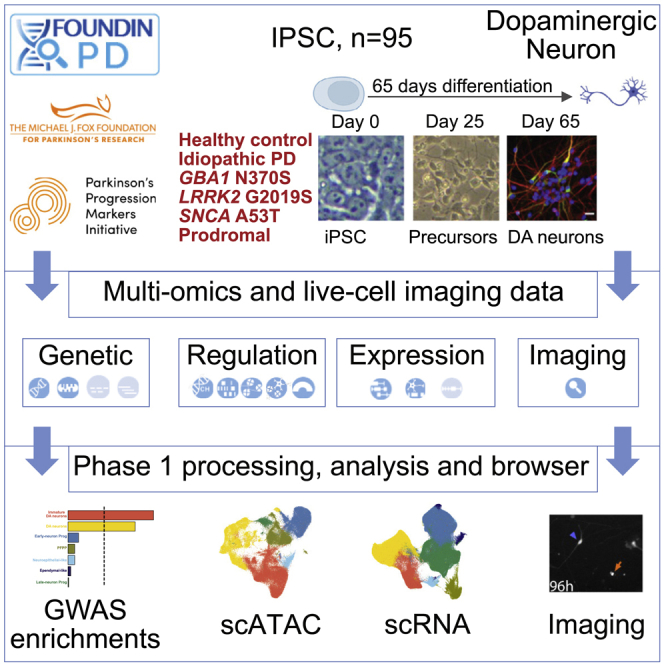
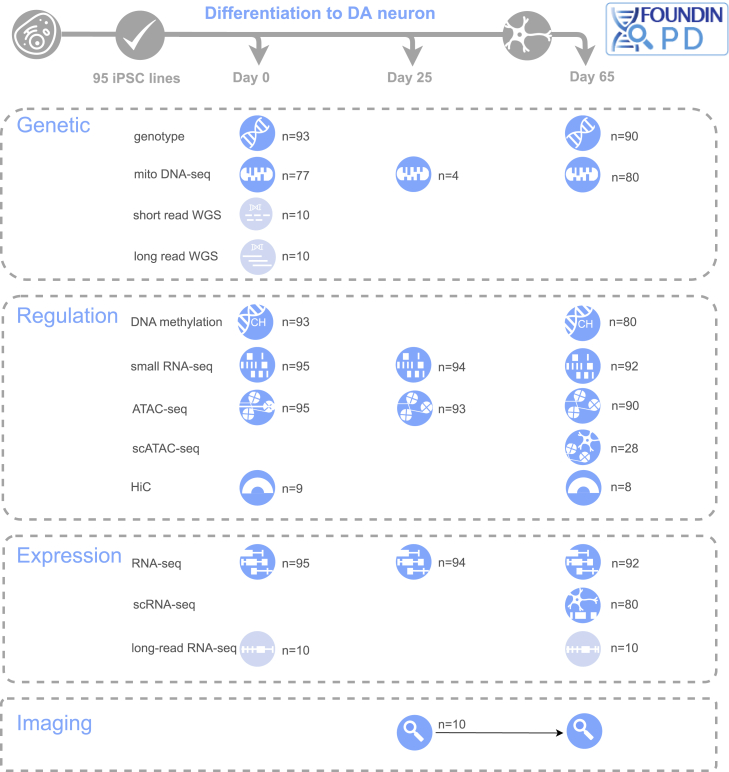
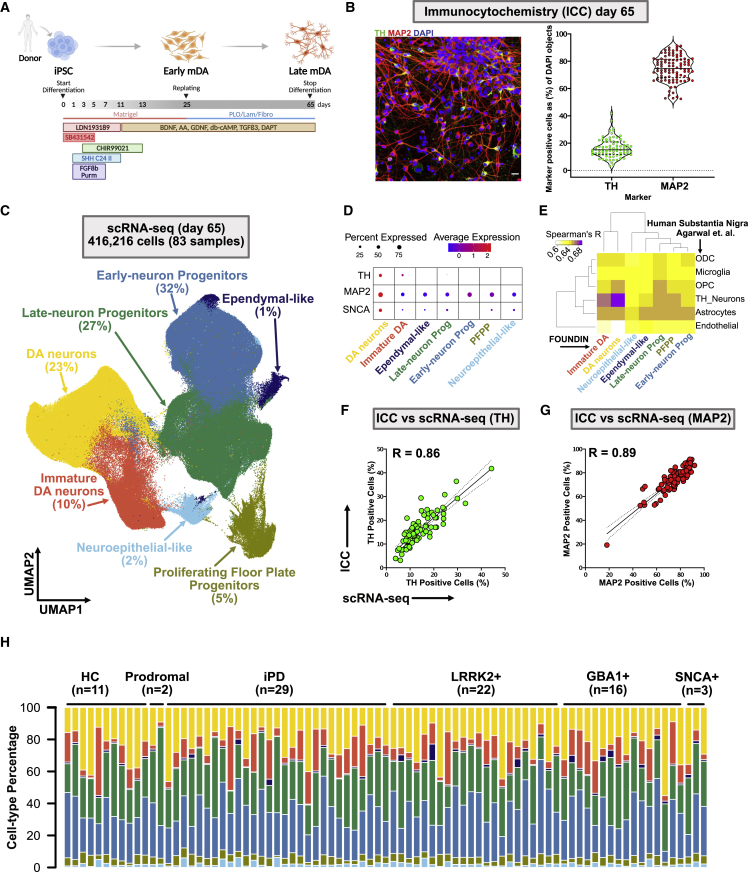
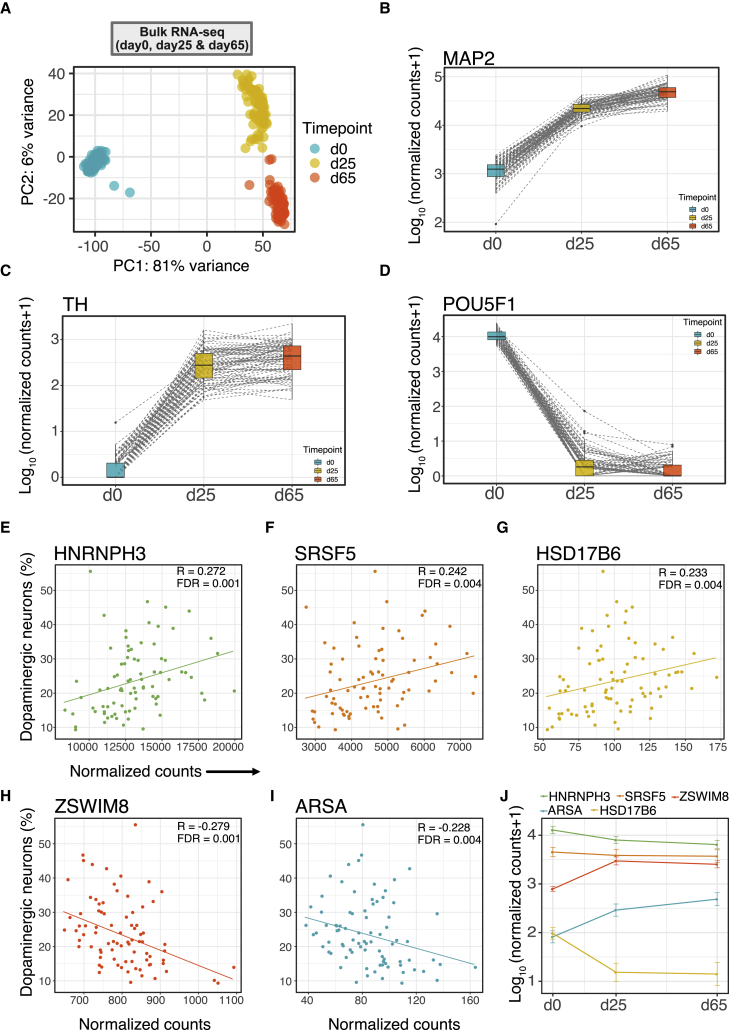
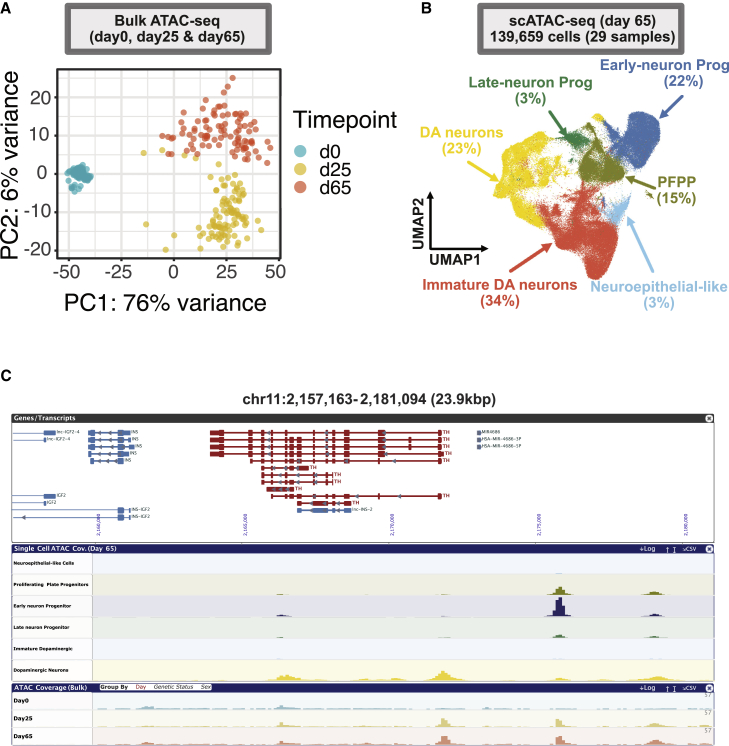
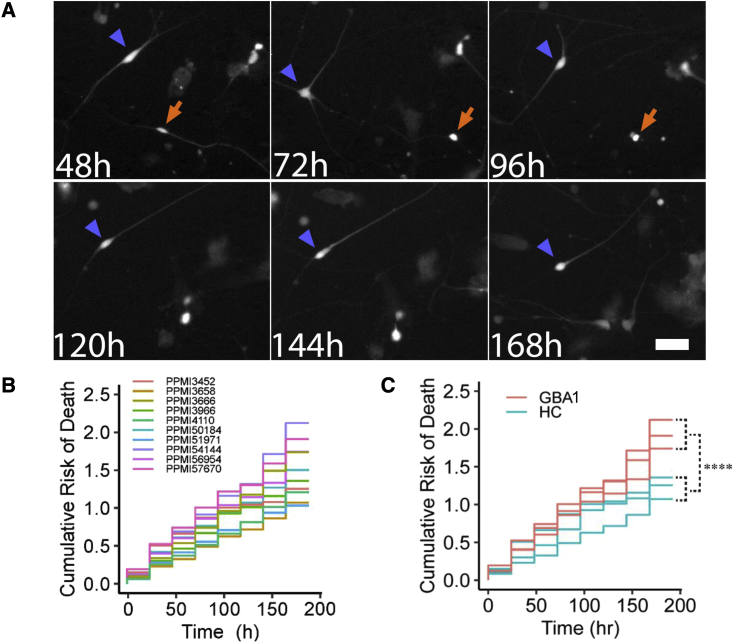
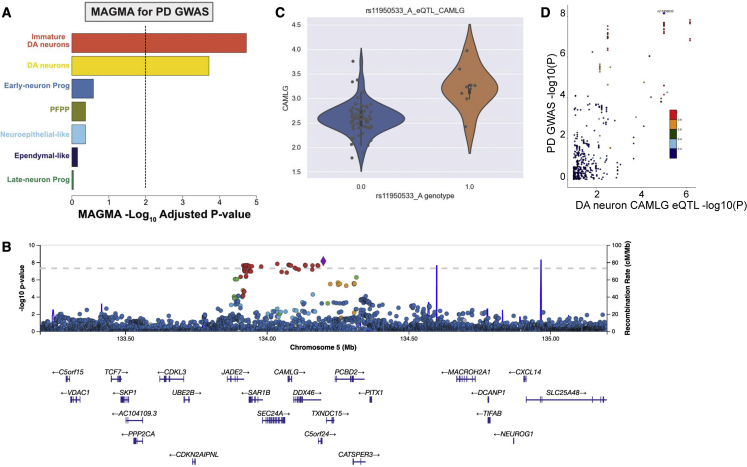
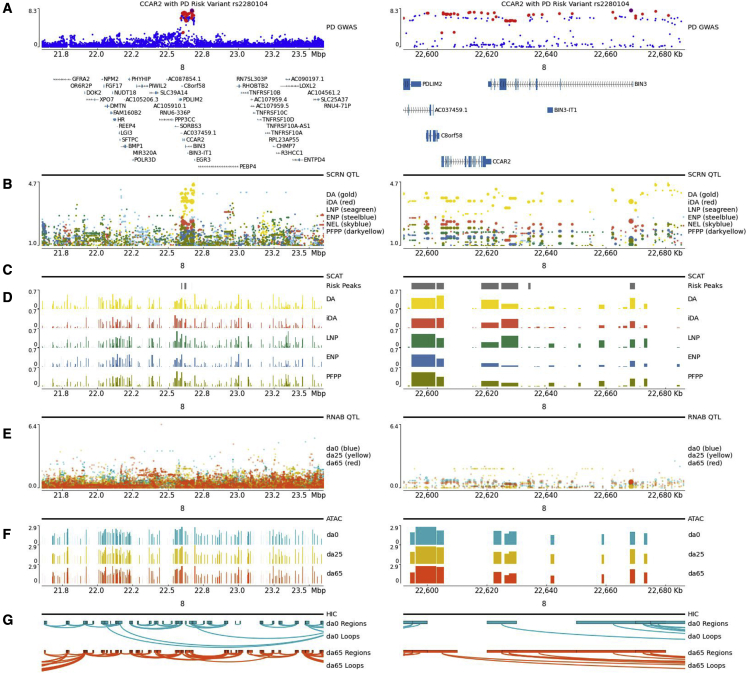
The Foundational Data Initiative for Parkinson Disease (FOUNDIN-PD) is an international collaboration producing fundamental resources for Parkinson disease (PD). FOUNDIN-PD generated a multi-layered molecular dataset in a cohort of induced pluripotent stem cell (iPSC) lines differentiated to dopaminergic (DA) neurons, a major affected cell type in PD. The lines were derived from the Parkinson's Progression Markers Initiative study, which included participants with PD carrying monogenic PD variants, variants with intermediate effects, and variants identified by genome-wide association studies and unaffected individuals. We generated genetic, epigenetic, regulatory, transcriptomic, and longitudinal cellular imaging data from iPSC-derived DA neurons to understand molecular relationships between disease-associated genetic variation and proximate molecular events. These data reveal that iPSC-derived DA neurons provide a valuable cellular context and foundational atlas for modeling PD genetic risk. We have integrated these data into a FOUNDIN-PD data browser as a resource for understanding the molecular pathogenesis of PD.

Keywords: Parkinson disease; dopaminergic neurons; genetic risk; induced pluripotent stem cell; omics single-cell RNA sequencing single-cell ATAC sequencing SNCA LRRK2 GBA1.


Figures

None
Graphical abstract
Figure 1
Figure 1
Graphical overview of the Foundational Data Initiative for Parkinson Disease (FOUNDIN-PD) Classes of assays, time points, and number (n) of samples included in each assay are shown. Blue icons represent assays that are included in the initial data release, and light blue icons represent assays that are ongoing and will be released at a later stage.
Figure 2
Figure 2
Quality control and scRNA-seq on day 65 (A) Schematic overview of the differentiation protocol to dopaminergic neurons. (B) Left: representative ICC image showing TH+ (dopamine [DA] neurons) and MAP2+ (neuron) cells co-stained with DAPI (nuclei). Scale bar: 50 μm. Right: percentage of TH+ (DA neuron) and MAP2+ cells detected by ICC and normalized to the total number of nuclei. Data are represented as the percentage of positive cells per 30 imaged fields. Each dot represents one cell line (n = 95). (C) Uniform manifold approximation and projection (UMAP) illustrates cell clusters identified at day 65 (n = 416,216 single cells, n = 79 + 4 control replicate cell lines). Cell types with their respective percentages are indicated. (D) Percentage of cells and average expression level of TH, MAP2, and SNCA for each cell type. The dot color scale from blue to red corresponds to lower and higher expression, respectively. The size of the dot is directly proportional to the percentage of cells expressing the gene in a given cell type. PFPP, proliferating floor plate progenitors; Prog, progenitors. (E) Spearman’s correlation test showing high correlation of gene expression across FOUNDIN-PD DA neuronal types and postmortem substantia nigra human brain. ODCs, oligodendrocytes; OPCs, oligodendrocyte precursor cells. See Figure S6A for UMAP of cell types identified by using Agarwal and collaborators’ data. (F and G) Correlation between percentages of TH+ (Pel-Freez) and MAP2+ cells in ICC and scRNA-seq (R, Pearson correlation coefficient; p < 0.0001). Each dot represents one cell line (n = 83). (H) Cell-type percentage by cell line showing variability in differentiation efficiency across the iPSC lines. Each color represents the cell types annotated in scRNA-seq UMAP, and each bar represents a different cell line. In total, 83 cell lines were included in the scRNA-seq. HC, healthy control (n = 8 plus 3 replicates of the control line); prodromal (n = 2); idiopathic PD (iPD; n = 29); monogenic PD (LRRK2+, GBA1+, or SNCA+; n = 41). Colors refer to clusters in (C): yellow, DA neurons; orange, immature DA neurons; light blue, neuroepithelial-like cells; olive, PFPP; green, late-neuron progenitors; blue, early-neuron progenitors; indigo, ependymal-like cells.
Figure 3
Figure 3
Bulk RNA-seq and neuronal differentiation efficiency prediction (A) Principal-component analysis (PCA) of bulk RNA-seq showing clustering by time point (days 0, 25, and 65). (B–D) Changes in expression of neuronal (MAP2), dopaminergic (TH), and iPSC (POU5F1) genes from day 0 to 65. (E–I) Genes significantly correlated with neuronal differentiation efficiency. HNRNPH3, SRSF5, and HSD17B6 show positive and ZSWIM8 and ARSA negative correlation. (J) Expression levels of genes associated with neuronal differentiation efficiency. All five genes are significantly differentially expressed between day 0 and 65 (adjusted p < 0.05).
Figure 4
Figure 4
Chromatin accessibility in iPSC-derived neurons on day 65 (A) PCA across all bulk ATAC-seq samples showing clustering by time point. (B) UMAP of scATAC-seq data at day 65 showing the clustering of 139,659 cells (from 29 samples) and similar broad cell types as in scRNA-seq (Figure 2C). (C) Chromatin accessibility data at the TH locus showing time point-specific peaks identified in bulk ATAC-seq at days 25 and 65 and cell-type-specific peaks in scATAC-seq at day 65. This figure was generated using the FOUNDIN-PD browser (https://www.foundinpd.org).
Figure 5
Figure 5
Automated longitudinal imaging of dopaminergic neurons (A) Time-lapse imaging of dopaminergic neurons (PPMI4110) expressing synapsin-I-driven GFP. Analysis started on day 55–56 of differentiation. One neuron (green arrowhead) survives the entire duration of imaging. A second neuron (red arrow) dies at 96 h. Scale bar: 60 μm. (B) Cumulative risk-of-death curves showing the neuronal survival from all batch-1 lines over 8 days of automated imaging. (C) Cumulative risk-of-death curves show increased degeneration in dopaminergic neurons differentiated from GBA1 PD lines compared with healthy control lines over 8 days of automated imaging (∗∗∗∗p < 0.0001; based on 891 neurons from GBA1 lines and 647 neurons from healthy control [HC] volunteers).
Figure 6
Figure 6
Using scRNA-seq expression data to dissect genetic risk (A) Multi-marker analysis of genomic annotation (MAGMA) gene set enrichment based on the scRNA-seq data showed significant associations with both dopaminergic neuron cell clusters. Colors represent the same cell types as in Figure 2C. (B) LocusZoom plot of locus 28 with rs11950533 as the index variant. Association data are derived from the most recent PD GWAS. (C) Violin plot showing correlation between the genotype at rs11950533 and expression of CAMLG in the DA neuron cell cluster. (D) LocusCompare plot of the correlation between the PD GWAS association results and the scRNA-seq expression quantitative trait locus (eQTL) analysis.
Figure 7
Figure 7
PD risk locus, FOUNDIN-PD resources, and CCAR2 effects in dopaminergic neurons The PD risk locus near BIN3 on chromosome 8 that intersects with an eQTL for CCAR2 in dopaminergic neurons. Tracks represent different data modalities generated or considered in FOUNDIN-PD as different data tracks; figures generated using pyGenomeTracks. The left and right sides of each panel display the same tracks where the left side is a larger region centered on the PD risk locus, and the right side only includes the interval containing the index PD risk variant for this locus and variants in linkage disequilibrium with that index variant. (A) GWAS risk for PD in the region. Point size denotes r2 linkage disequilibrium with the PD index variant rs2280104 (large: r2 = 1, medium: 1 > r2 ≥ 0.8, small: r2 < 0.8). (B) scRNA-seq eQTL data for DA neurons, immature DA (iDA) neurons, late-neuron progenitors (LNPs), early-neuron progenitors (ENPs), neuroepithelial-like (NEL) cells, and proliferating floor plate progenitors (PFPPs). (C) scATAC-seq peaks containing a variant in high linkage disequilibrium (r2 ≥ 0.8) with rs2280104. (D) scATAC-seq peaks for different cell types. (E) Bulk RNA-seq (RNAB) eQTL results per differentiation time point for CCAR2. (F) Bulk ATAC-seq peaks separated per differentiation time point. (G) HiC data depicting chromatin regions connected by loops at different differentiation time points.

References

    1. Blauwendraat C., Nalls M.A., Singleton A.B. The genetic architecture of Parkinson’s disease. Lancet Neurol. 2020;19:170–178. - PMC - PubMed
    1. Nalls M.A., Blauwendraat C., Vallerga C.L., Heilbron K., Bandres-Ciga S., Chang D., Tan M., Kia D.A., Noyce A.J., Xue A., et al. Identification of novel risk loci, causal insights, and heritable risk for Parkinson’s disease: a meta-analysis of genome-wide association studies. Lancet Neurol. 2019;18:1091–1102. - PMC - PubMed
    1. O’Keeffe G.W., Sullivan A.M. Evidence for dopaminergic axonal degeneration as an early pathological process in Parkinson’s disease. Parkinsonism Relat. Disord. 2018;56:9–15. doi: 10.1016/j.parkreldis.2018.06.025. - DOI - PubMed
    1. Bryois J., Skene N.G., Hansen T.F., Kogelman L.J.A., Watson H.J., Liu Z., Eating Disorders Working Group of the Psychiatric Genomics Consortium. International Headache Genetics Consortium. 23andMe Research Team. Brueggeman L., et al. Genetic identification of cell types underlying brain complex traits yields insights into the etiology of Parkinson’s disease. Nat. Genet. 2020;52:482–493. - PMC - PubMed
    1. Ascherio A., Schwarzschild M.A. The epidemiology of Parkinson’s disease: risk factors and prevention. Lancet Neurol. 2016;15:1257–1272. - PubMed