. 2023 Jan 24;3(3):100250.
doi: 10.1016/j.xgen.2022.100250. eCollection 2023 Mar 8.

Protein interaction studies in human induced neurons indicate convergent biology underlying autism spectrum disorders

Affiliations

Protein interaction studies in human induced neurons indicate convergent biology underlying autism spectrum disorders

Greta Pintacuda et al. Cell Genom. .

Abstract

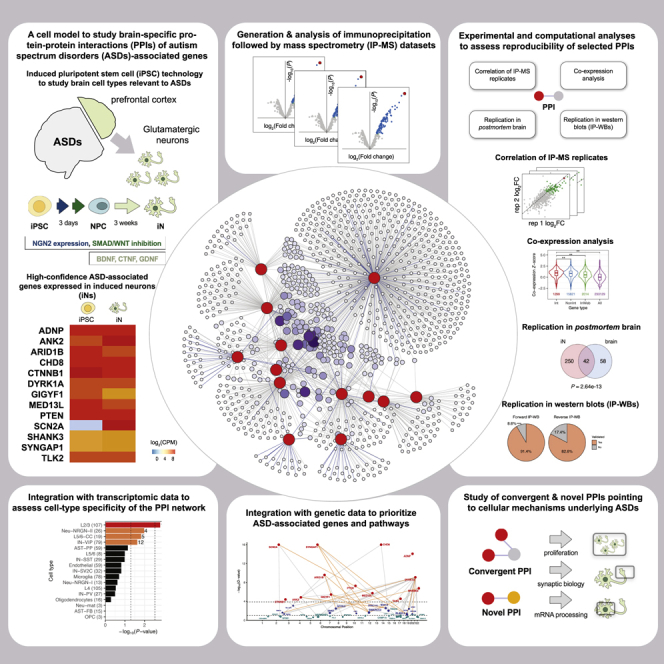
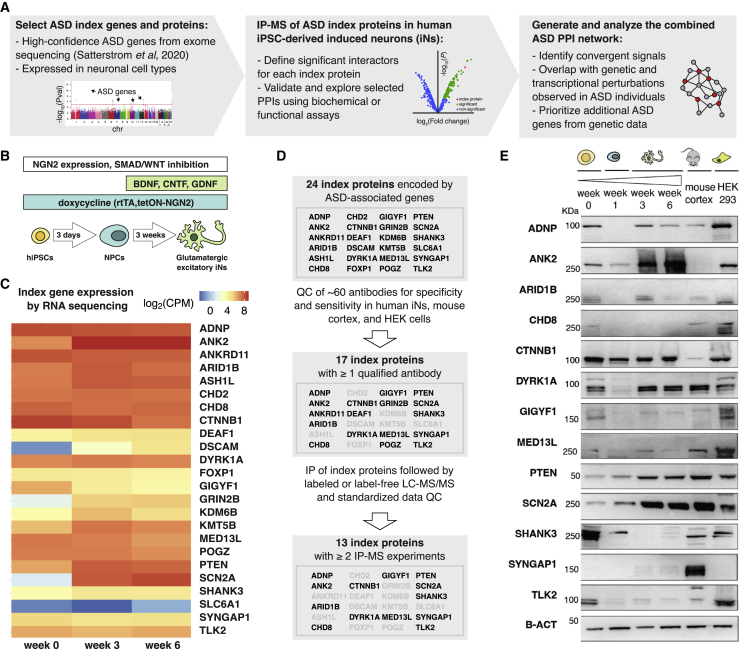
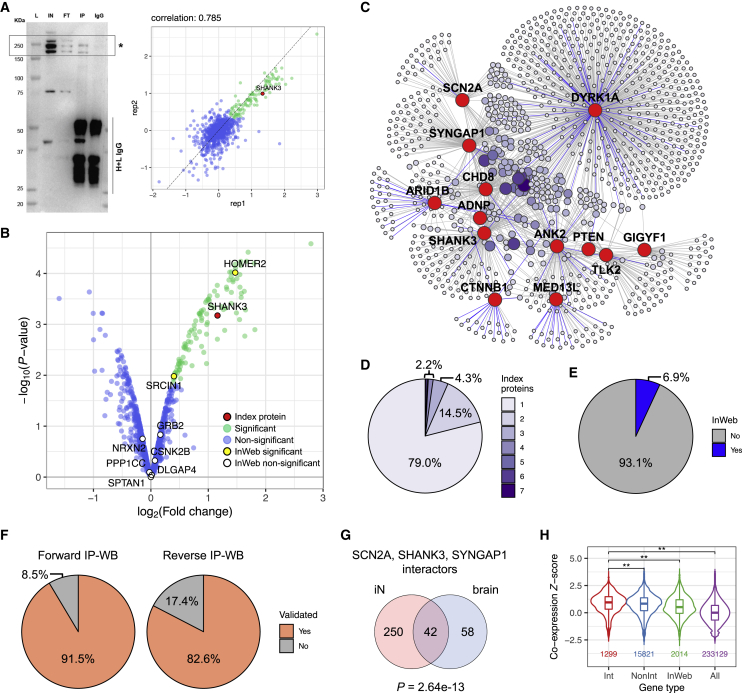
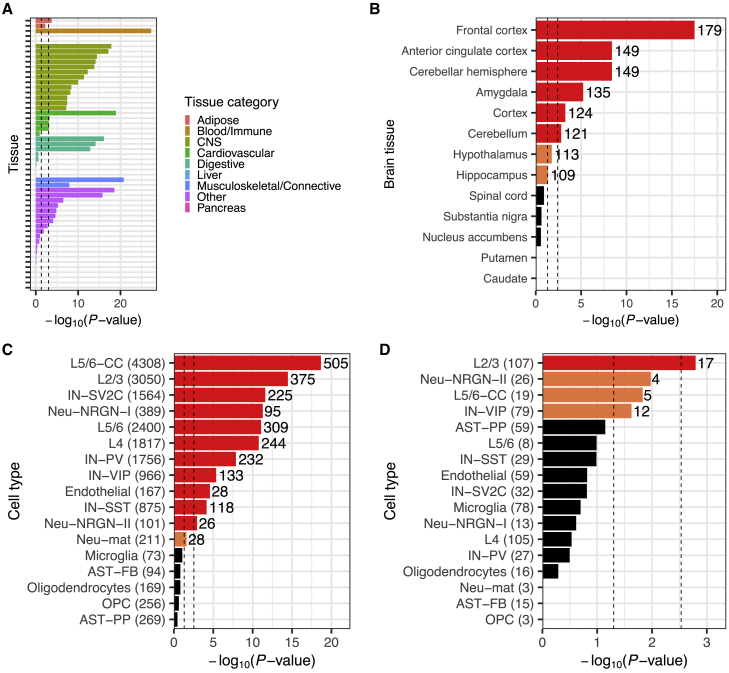
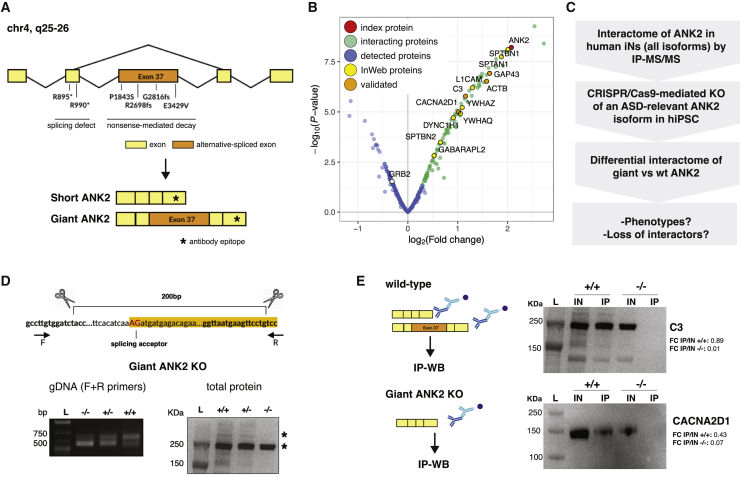
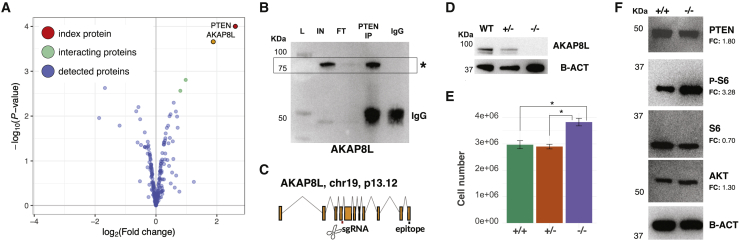
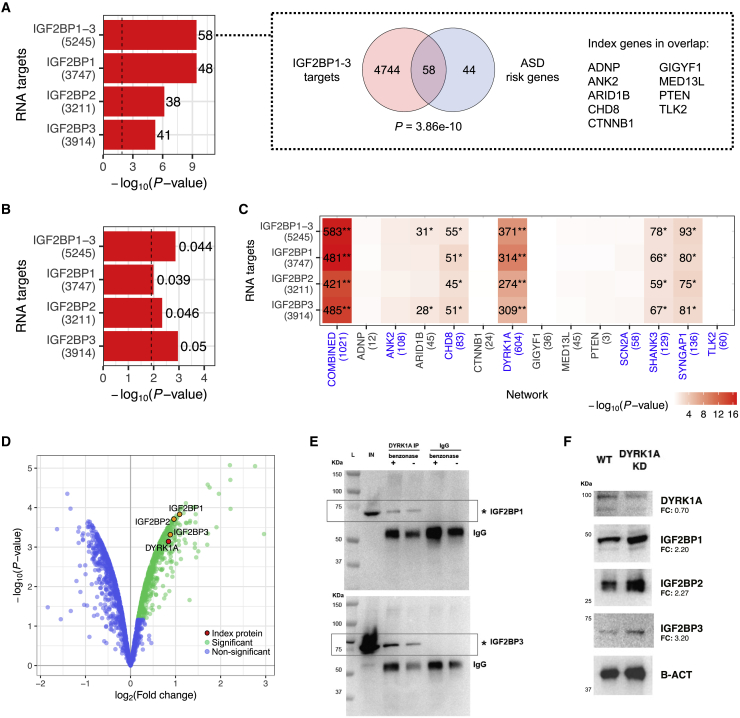
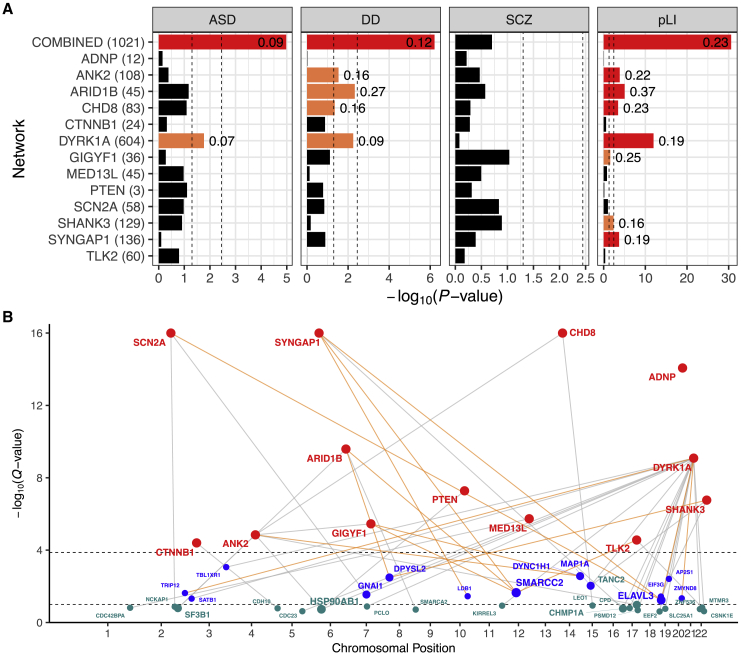
Autism spectrum disorders (ASDs) have been linked to genes with enriched expression in the brain, but it is unclear how these genes converge into cell-type-specific networks. We built a protein-protein interaction network for 13 ASD-associated genes in human excitatory neurons derived from induced pluripotent stem cells (iPSCs). The network contains newly reported interactions and is enriched for genetic and transcriptional perturbations observed in individuals with ASDs. We leveraged the network data to show that the ASD-linked brain-specific isoform of ANK2 is important for its interactions with synaptic proteins and to characterize a PTEN-AKAP8L interaction that influences neuronal growth. The IGF2BP1-3 complex emerged as a convergent point in the network that may regulate a transcriptional circuit of ASD-associated genes. Our findings showcase cell-type-specific interactomes as a framework to complement genetic and transcriptomic data and illustrate how both individual and convergent interactions can lead to biological insights into ASDs.

Keywords: IP-MS; autism spectrum disorders; exome sequencing; induced excitatory neurons; protein-protein interactions.


Conflict of interest statement

K.C.E. is a co-founder of Q-State Biosciences, Quralis, and Enclear and is currently employed at BioMarin Pharmaceutical.

Figures

None
Graphical abstract
Figure 1
Figure 1
Study workflow and expression of ASD index genes and proteins in human iNs (A) Workflow to generate and analyze a PPI network for high-confidence ASD-associated genes in human iNs. (B) Key steps in the glutamatergic-patterning protocol utilized to generate neural progenitor cells (NPCs) and excitatory iNs from human iPSCs. (C) Heatmap of ASD index gene expression over the course of neuronal maturation derived from RNA-seq data. CPM, mean normalized counts per million of two replicates; maximum log2(CPM) was capped at 9 for visualization. (D) Flowchart of index protein filtering. (E) Expression of the 13 index proteins in differentiating iPSCs, mouse cortex, and HEK293 cells detected by immunoblotting. The antibody utilized against ANK2 recognizes a human-specific epitope, and SYNGAP1 is not expressed in HEK293 cells. B-actin (B-ACT) was used as a loading control. Molecular weights (kDa) are marked on the left of each blot.
Figure 2
Figure 2
Generation of a combined PPI network for 13 ASD index proteins in iNs (A) Example of an IP-MS experiment. Left: immunoblot of a SHANK3 IP with its main isoforms marked by a box and asterisk; L, ladder; IN, input; FT, flow-through; IP, immunoprecipitation; IgG, IgG control; H + L IgG, heavy and light IgG chains. Molecular weights are in kilodaltons. Right: log2 fold change (FC) correlation between IP-MS replicates. (B) Volcano plot of the SHANK3 IP-MS experiment, showing SHANK3 in red, its significant interactors (log2 FC > 0 and FDR ≤ 0.1) in green, and non-interactors in blue; known InWeb interactors identified as interactors or non-interactors in the experiment are highlighted in yellow or white, respectively. Statistics were derived from two replicates using a two-tailed one-sample moderated t test. (C) PPI network derived from 26 IP-MS experiments. Nodes represent index proteins (red) and their interactors (purple); color intensity and size of the interactor nodes scale with interactor frequency (i.e., number of linked index proteins). Edges indicate observed interactions, with known InWeb interactions highlighted in blue. (D) Distribution of interactor frequency in the network. (E) Distribution of InWeb versus newly reported interactions in the network. (F) Replication rates of interactions tested in forward or reverse IPs followed by western blotting (IP-WB). (G) Overlap between SCN2A, SHANK3, and SYNGAP1 interactors derived from iN versus brain IPs. Overlap enrichment p value was calculated using a one-tailed hypergeometric test that only considered proteins detected in both sample types. (H) Pairwise co-expression Z scores between index genes and their interactors (Int), non-interactors (NonInt), known InWeb interactors (InWeb), and all protein-coding genes (All) derived from a spatial transcriptomic dataset in human dorsolateral prefrontal cortex. Boxes and whiskers in violin plots indicate the interquartile range (IQR) and 1.5x IQR, respectively. Double asterisks indicate p < 0.05/6 (adjusting for six pairwise comparisons) as calculated by two-tailed Wilcoxon rank-sum tests. Number of gene pairs included for each gene type is indicated toward the bottom.
Figure 3
Figure 3
Tissue and cell type enrichment of the ASD PPI network (A–D) Overlap enrichment between the network and GTEx tissue-specific genes ([A]; 2,408 genes per tissue), GTEx brain region-specific genes ([B]; 2,408 genes per tissue), genes expressed in >50% of cells in each cell type in the postmortem cortex ([C]; gene counts in parentheses), and DEGs in each cell type in the postmortem cortex of ASD individuals versus controls ([D]; gene counts in parentheses). The p values were derived from one-tailed hypergeometric tests; for (A) and (B), a global background (i.e., all genes in the GTEx data) was used as the population in the test; for (C) and (D), a conditional neuronal background (i.e., iN-expressed genes detected by IP-MS) was used. Left and right vertical dashed lines indicate p < 0.05 and p < 0.05/number of tissues or cell types, respectively; in (B)–(D), results passing these thresholds are labeled with the number of genes in the overlap. AST-FB and AST-PP, fibrous and protoplasmic astrocytes; OPC, oligodendrocyte precursor cells; IN-PV, IN-SST, IN-SV2C, and IN-VIP, parvalbumin, somatostatin, SV2C, and VIP interneurons; L2/3 and L4, layer 2/3 and layer 4 excitatory neurons; L5/6 and L5/6-CC, layer 5/6 corticofugal projection and cortico-cortical projection neurons; Neu-mat, maturing neurons; Neu-NRGN-I and Neu-NRGN-II, NRGN-expression neurons.
Figure 4
Figure 4
Giant ANK2 is responsible for neuron-specific PPIs (A) Depiction of the ANK2 gene with ASD-associated mutations leading to splicing defects or early decay. Giant ANK2 includes exon 37, which is alternatively spliced to produce short ANK2. The epitope recognized by the ANK2 antibody used in this study is marked with an asterisk. (B) Volcano plot of an IP-MS experiment for ANK2 in iNs, showing ANK2 in red, significant interactors (log2 FC > 0 and FDR ≤ 0.1) in green, and non-interactors in blue; known InWeb interactors identified as interactors or non-interactors are highlighted in yellow or white, respectively; interactors replicated by immunoblotting are highlighted in orange. Statistics were derived from two replicates using a two-tailed one-sample moderated t test. (C) Experimental workflow to identify giant ANK2-specific PPIs. (D) Top: CRISPR-Cas9 editing strategy to generate a cell line exclusively expressing the short ANK2 isoform, obtained by deletion of the giant ANK2 exon splicing acceptor. Bottom: validation of giant ANK2 KO cell line. The deletion was confirmed by PCR on genomic DNA using primers flanking the deletion site (left), and by immunoblotting (right) showing the absence of the giant ANK2 isoform in homozygous KO iNs (−/−) compared with WT (+/+) and heterozygous KO (−/−) cells. Giant and canonical ANK2 isoforms are indicated with an asterisk. (E) C3 and CACNA2D1 western blots on ANK2 IPs in WT and giant ANK2 KO iNs. FC was calculated as a ratio of the intensity of the bands detected in the IP versus IN lanes. L, ladder; IN, input; IP, immunoprecipitation. Molecular weights are in kilodaltons. Fifty micrograms of total lysate were loaded in the IN lanes, and 10% of the total immunoprecipitates were loaded in the IP lanes.
Figure 5
Figure 5
The neuronal PTEN-AKAP8L interaction regulates cell proliferation (A) Volcano plot of an IP-MS experiment for PTEN in iNs, showing PTEN in red, significant interactors (log2 FC > 0 and FDR ≤ 0.1) in green, and non-interactors in blue; AKAP8L is marked in orange. Statistics were derived from two replicates using a two-tailed one-sample moderated t test. (B) AKAP8L immunoblot on the PTEN IP. AKAP8L is marked with an asterisk, IgG heavy chains are marked to the right; L, ladder; IN, input; FT, flow-through; IP, immunoprecipitation; IgG, IgG control. Molecular weights are in kilodaltons. (C) Schematic of the CRISPR-Cas9 editing strategy to generate AKAP8L KO iPSC lines. (D) Immunoblot validation of AKAP8L heterozygous (+/−) and homozygous (−/−) KO lines generated using the strategy in (C). B-actin is used as a loading control. Molecular weights (kDa) are marked on the side of each blot. (E) WT (+/+), AKAP8L heterozygous KO (+/−), and AKAP8L homozygous KO (−/−) neural progenitor cell growth over 4 days upon seeding cells at identical confluences normalized to their seeding density. Error bars indicate standard deviations of the mean of three biological replicates. Asterisks indicate p < 0.05 as calculated using a two-tailed t test. (F) Immunoblot analysis of PTEN, phosphorylated S6 (P-S6), S6, and AKT in WT and AKAP8L homozygous KO iNs. Molecular weights (kDa) are marked on the side of each blot and B-actin is used as loading control. FC was calculated as a ratio of the intensity of the bands detected in the AKAP8L KO (−/−) versus WT (+/+) lanes.
Figure 6
Figure 6
The IGF2BP1-3 complex interacts with ASD-associated transcripts and proteins (A) Overlap enrichment between RNA targets of IGF2BP1-3 (target counts in parentheses) and ASD-associated genes (FDR ≤ 0.1 in exome sequencing data) calculated using one-tailed hypergeometric tests. IGF2BP1-3 indicates the combined target list. Vertical dashed line indicates p < 0.05/4 (adjusting for four target lists). The number of genes in the overlap is shown to the right of each bar. (B) Common variant enrichment of IGF2BP1-3 targets derived using ASD GWAS data and MAGMA. Vertical dashed line indicates p < 0.05/4. The enrichment coefficient is shown to the right of each bar. (C) Overlap enrichment between IGF2BP1-3 targets and the ASD PPI network or index protein-specific sub-networks (compared with non-interactors) calculated using one-tailed hypergeometric tests. Gene counts in overlaps with p < 0.05 (∗) or p < 0.05/4 (∗∗) are labeled in the heatmap. Networks that contain any of the IGF2BPs are highlighted in blue on the x axis. (D) Volcano plot of an IP-MS experiment for DYRK1A in iNs, showing DYRK1A in red, significant interactors (log2 FC > 0 and FDR ≤ 0.1) in green, and non-interactors in blue; IGF2BP1-3, which were technically replicated by western blot, are marked in orange. Statistics were derived from two replicates using a two-tailed one-sample moderated t test. (E) Immunoblot on an DYRK1A IP with and without addition of 25 U of benzonase (indicated at the top). An asterisk marks the expected band of each protein (named on the right). L, ladder; IN, input; IP, immunoprecipitation; IgG, IgG control. Molecular weights are in kilodaltons. (F) Immunoblot showing protein levels (named on the right) upon DYRK1A siRNA-mediated knockdown for 48 h in iPSCs. B-actin is used as loading control. FC was calculated as a ratio of the intensity of the bands detected in the DYRK1A knockdown (KD) versus WT lanes across three biological replicates.
Figure 7
Figure 7
Genetic enrichment in the ASD PPI network (A) Rare variant,, or pLI score enrichment of the network or index protein-specific sub-networks compared with non-interactors, derived using one-tailed Kolmogorov-Smirnov tests. The number of genes in each network is shown in parentheses on the y axis. Left and right vertical dashed lines indicate p < 0.05 and p < 0.05/14 (adjusting for 14 networks), respectively; results passing these thresholds are labeled with the corresponding KS test statistics. (B) Social Manhattan plot of index genes (red) and interactors that are suggestive ASD-associated genes (blue or cyan for FDR ≤ 0.1 or 0.25, respectively) in exome sequencing data. Sizes of the interactor nodes scale with the number of linked index genes. Connecting lines indicate observed interactions in the ASD PPI network; interactions replicated by IP-WB are highlighted in orange.

Similar articles

Cited by

References

    1. Geschwind D.H. Genetics of autism spectrum disorders. Trends Cognit. Sci. 2011;15:409–416. doi: 10.1016/j.tics.2011.07.003. - DOI - PMC - PubMed
    1. Robinson E.B., Neale B.M., Hyman S.E. Genetic research in autism spectrum disorders. Curr. Opin. Pediatr. 2015;27:685–691. doi: 10.1097/MOP.0000000000000278. - DOI - PMC - PubMed
    1. Weiner D.J., Wigdor E.M., Ripke S., Walters R.K., Kosmicki J.A., Grove J., Samocha K.E., Goldstein J.I., Okbay A., Bybjerg-Grauholm J., et al. Polygenic transmission disequilibrium confirms that common and rare variation act additively to create risk for autism spectrum disorders. Nat. Genet. 2017;49:978–985. doi: 10.1038/ng.3863. - DOI - PMC - PubMed
    1. Gaugler T., Klei L., Sanders S.J., Bodea C.A., Goldberg A.P., Lee A.B., Mahajan M., Manaa D., Pawitan Y., Reichert J., et al. Most genetic risk for autism resides with common variation. Nat. Genet. 2014;46:881–885. doi: 10.1038/ng.3039. - DOI - PMC - PubMed
    1. Satterstrom F.K., Kosmicki J.A., Wang J., Breen M.S., De Rubeis S., An J.Y., Peng M., Collins R., Grove J., Klei L., et al. Large-scale exome sequencing study implicates both developmental and functional changes in the neurobiology of autism. Cell. 2020;180:568–584.e23. doi: 10.1016/j.cell.2019.12.036. - DOI - PMC - PubMed