. 2023 May;10(14):e2205161.
doi: 10.1002/advs.202205161. Epub 2023 Mar 22.

Blockade of Activin Receptor IIB Protects Arthritis Pathogenesis by Non-Amplification of Activin A-ACVR2B-NOX4 Axis Pathway

Affiliations

Blockade of Activin Receptor IIB Protects Arthritis Pathogenesis by Non-Amplification of Activin A-ACVR2B-NOX4 Axis Pathway

Jimin Jeon et al. Adv Sci (Weinh). 2023 May.

Abstract

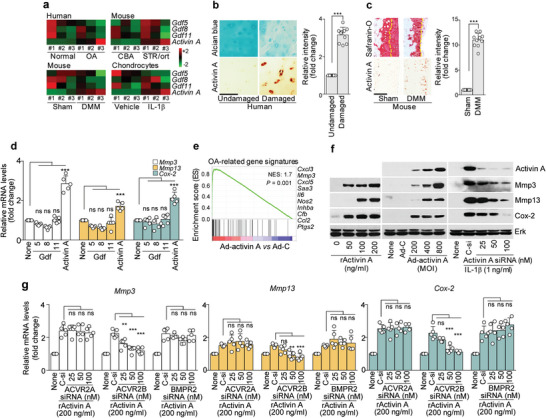
Although activin receptor IIB (ACVR2B) is emerging as a novel pathogenic receptor, its ligand and assembled components (or assembly) are totally unknown in the context of osteoarthritis (OA) pathogenesis. The present results suggest that upregulation of ACVR2B and its assembly could affect osteoarthritic cartilage destruction. It is shown that the ACVR2B ligand, activin A, regulates catabolic factor expression through ACVR2B in OA development. Activin A Tg mice (Col2a1-Inhba) exhibit enhanced cartilage destruction, whereas heterozygous activin A KO mice (Inhba+/- ) show protection from cartilage destruction. In silico analysis suggests that the Activin A-ACVR2B axis is involved in Nox4-dependent ROS production. Activin A Tg:Nox4 KO (Col2a1-Inhba:Nox4-/- ) mice show inhibition of experimental OA pathogenesis. NOX4 directly binds to the C-terminal binding site on ACVR2B-ACVR1B and amplifies the pathogenic signal for cartilage destruction through SMAD2/3 signaling. Together, the findings reveal that the ACVR2B assembly, which comprises Activin A, ACVR2B, ACVR1B, Nox4, and AP-1-induced HIF-2α, accelerates OA development. Furthermore, it is shown that shRNA-mediated ACVR2B knockdown or trapping ligands of ACVR2B abrogate OA development by competitively disrupting the ACVR2B-Activin A interaction. These results suggest that the ACVR2B assembly is required to amplify osteoarthritic cartilage destruction and could be a potential therapeutic target in efforts to treat OA.

Keywords: ACVR2B assembly; arthritis treatment; druggable target; human OA cartilage; mouse model.


Conflict of interest statement

The authors declare no conflict of interest.

Figures

Figure 1
Figure 1
Upregulation of ACVR2B in OA cartilage is necessary for OA pathogenesis. a) Schematic summary of screening for novel pathogenic receptors. b) DMM‐operated mice were sacrificed at the indicated weeks after surgery (n = 5). Safranin‐O staining images of cartilage sections (upper left), scoring of OARSI grade (upper right), and immunostaining image density analysis (lower). c) Upregulation of ACVR2B in human OA cartilage (n = 10). Images show Alcian blue and immunostaining of ACVR2B in human OA cartilage (left) and analysis of immunostaining intensities (right). d,e) Primary‐culture mouse articular chondrocytes were treated with ACVR2B siRNA (n = 4). Shown are (d) Western blot images of the indicated molecules, along with (e) collagenase activity (left) and PGE2 production (right). f,g) DMM‐operated WT mice were IA injected with Ad‐ACVR2B shRNA (Ad‐shA) in the joint tissues. Shown are a schematic of the experimental procedures used for Ad‐ACVR2B shRNA injection (f, upper left), Safranin‐O staining images of joint sections (n = 10) (f, upper right), scoring of OARSI grade (f, right), and IHC intensity analysis (g). Yellow dotted lines indicate tidemarks (b,f). Values are presented as means ± SD, and were assessed using two‐tailed t‐test (c; right), one‐way ANOVA with Bonferroni's post‐hoc test (b, e, g), and Kruskal‐Wallis test followed by Mann‐Whitney U test (f). **p < 0.01; ***p < 0.001, ns; not significant. Scale bar: 100 µm. Ad‐shC, control shRNA adenovirus. Ad‐shA, ACVR2B shRNA adenovirus.
Figure 2
Figure 2
Activin A is associated with OA through ACVR2B. a) Heatmap of Gdf5, Gdf8, Gdf11, and activin A expression in cartilage from human OA patients, SRT/ort OA mice, and DMM‐operated mice, and in IL‐1β treated human chondrocytes. b,c) Images of Alcian blue or Safranin‐O staining and activin A immunostaining in human OA cartilage and DMM‐operated mouse cartilage (b,c; left, n = 10), with immunostaining intensity (b,c; right). d) The indicated molecules were determined by qRT‐PCR analysis of mouse primary chondrocytes treated with 200 ng mL−1 of Gdf5, 8, 11, or activin A. e) GSEA of OA signature genes in chondrocytes infected with Ad‐C or Ad‐activin A. f) Western blot images of the indicated molecules after chondrocytes were treated with recombinant activin A (left), infected with Ad‐activin A (middle), or treated with the indicated concentrations of activin A siRNA (right). g) Mmp3, Mmp13, and Cox‐2 expression levels after knockdown of ACVR2A, ACVR2B, or BMPR2 in activin A‐treated chondrocytes. Tidemarks are indicated by yellow dotted lines (c). Values are presented as means ± SD, and were assessed using two‐tailed t‐test (b,c) or one‐way ANOVA with Bonferroni's post‐hoc test (d,g). **p < 0.01; ***p < 0.001.
Figure 3
Figure 3
Activin A is a critical catabolic regulator of OA pathogenesis. a) Schematic illustration of the strategy used to concentrate conditioned media from chondrocytes of WT and activin A Tg mice (left), along with Western blot images (middle) and relative protein intensity levels (right) of the indicated molecules. The culture medium from Wt and activin A Tg chondrocytes were collected for 24 h, concentrated it to 10×, and applied the indicated volumes (in µL) of the concentrate to normal chondrocytes. (n = 5). b) Cartilage destruction in 18 month old WT (n = 5) and activin A Tg (n = 9) mice was determined by Safranin‐O staining (left) and OARSI scoring (right). c) Safranin‐O staining images of joint sections (left) and scoring of OARSI grade (right) (n = 10). d) 3D µCT images (left; n = 5) and stacked‐bar plot showing the trabecular bone thickness distribution of the indicated samples (right). e) The elastic modulus of cartilage, as measured by bioindentation (n = 5). f) Safranin‐O staining images of joint sections (left) and scoring of OARSI grade (right) (n = 10). g) Representative 3D µCT images (left; n = 5) and stacked‐bar plot showing the trabecular bone thickness distribution of the indicated samples (right). h) The elastic modulus of cartilage, as measured by bioindentation (n = 5). Tidemarks are indicated by yellow dotted lines (b,c,f). Values are presented as means ± SD and were assessed using one‐way ANOVA with Bonferroni's post‐hoc test (a), two‐tailed t‐test (b), or Kruskal‐Wallis test followed by Mann‐Whitney U test (c,e,f,h). **p < 0.01; ***p < 0.001. Scale bar: 100 µm.
Figure 4
Figure 4
Nox4 is a critical downstream catabolic mediator of the activin A‐ACVR2B axis in OA pathogenesis. a) GSEA (upper) and heatmap of ROS‐related genes (lower) altered following Ad‐activin A infection in chondrocytes. b) Intracellular ROS levels in postnatal chondrocytes of activin A Tg (red line) and WT littermate (black line) mice. c) Intracellular ROS levels in chondrocytes infected with 800 MOI of Ad‐C (black line), Ad‐activin A (blue line), or Ad‐Nox4 (red line). d) Intracellular ROS levels of chondrocytes infected with Ad‐C (orange line) or Ad‐activin A (blue line) in the presence of diphenyleneiodonium (green line) or Nox4 siRNA (yellow line). Quantification of ROS fluorescence intensity (b,c,d; right; n = 5). e–g) DMM‐operated activin A Tg:Nox4 KO mice were analyzed. Shown are Safranin‐O staining images of joint sections (e; n = 10), the elastic modulus of cartilage determined by bioindentation (f; n = 5), 3D µCT images (g; left), and the trabecular bone thickness distribution (g; right; n = 5). h) Computational docking models for ACVR2B (cyan) and NOX4 (olive). Pink: ACVR2B transmembrane domain. Green: NOX4 binding sites (lower). i) Chondrocytes were transfected with WT ACVR2B or muACVR2B. Cell lysates were subjected to immunoprecipitation (IP) with FLAG (n = 3). Yellow dotted lines indicate tidemarks (e). Values are presented as mean ± SD and were analyzed using two‐tailed t‐test (b), one‐way ANOVA with Bonferroni's post‐hoc test (c,d), or Kruskal‐Wallis test followed by Mann‐Whitney U test (e,f). **p < 0.01; ***p < 0.001. Scale bar: 100 µm.
Figure 5
Figure 5
ACVR1B and AP‐1 are required to complete the ACVR2B assembly and thereby accelerate OA. a,b) Chondrocytes were treated with rActivin A (200 ng mL−1) in the absence or presence of 100 × 10−9 m of control siRNA (C‐si) or 50 × 10−9 m to 100 × 10−9 m of siRNA against type I receptors (ACVR1A, ACVR1B, ACVR1C, BMPR1A, or BMPR1B; n = 5). a) Relative mRNA levels of the indicated molecules, as assessed by qRT‐PCR analysis. b) Representative Western blot images (upper) and relative protein intensity levels (lower) of p‐Smad2/3 in type I receptor‐knockdown chondrocytes treated with rActivin A. c) Computational docking models for ACVR2B (cyan), ACVR1B (pink), and NOX4 (olive) (upper). Purple: ACVR1B transmembrane domain. Green: NOX4 binding sites (lower). d) Interaction of endogenous ACVR2B and ACVR1B heterodimers with endogenous Nox4 in IL‐1β‐treated or Ad‐activin A‐infected chondrocytes (n = 3). e) Profiling of activin A‐ or Nox4‐induced transcription factors. List of the highest‐ and lowest‐expressed transcription factors in Ad‐activin A‐ or Ad‐Nox4‐infected chondrocytes. Ad‐C‐infected chondrocytes were used as controls. f) Chondrocytes were infected with Ad‐C, Ad‐activin A, or Ad‐Nox4 in the presence of 20 × 10−6 m of T5224 for 24 h. Representative qRT‐PCR analysis results for the indicated molecules (n = 8). Values are presented as means ± SD and were assessed using one‐way ANOVA with Bonferroni's post‐hoc test (a,b,f) and two‐tailed t‐test (e). *p < 0.05; **p < 0.01; ***p < 0.001, ns; not significant.
Figure 6
Figure 6
Trapping activin receptor IIB (ACVR2B) ligands attenuates OA and metabolic OA pathogeneses. a,b) Sham‐ or DMM‐operated WT mice were IA injected with PBS as a vehicle or sACVR2B‐Fc (10 µg in a total volume of 10 µL) to block interactions between ACVR2B and its ligands, and sacrificed at 10 weeks after the surgery (n = 10). a) Schematic of the experimental procedure used for vehicle or sACVR2B‐Fc knee‐joint injection prior to DMM surgery. b) Representative Safranin‐O staining images of joint sections (left) and scoring of OARSI grade (right). c,d) HFD‐fed sham‐ or DMM‐operated WT mice were sacrificed at the indicated days after surgery (n = 5). c) Schematic showing the experimental procedure for a vehicle or sACVR2B‐Fc knee‐joint injection in HFD‐fed mice induced with DMM surgery. d) Representative Safranin‐O staining images of cartilage sections (left) and scoring of OARSI grade (right). Tidemarks are indicated by yellow dotted lines (b,d). Values are presented as means ± SD and were assessed using the Kruskal‐Wallis test followed by Mann‐Whitney U test (b,d; right). *p < 0.05; **p < 0.01; ***p < 0.001, ns; not significant. Scale bar: 100 µm.

References

    1. Loeser R. F., Goldring S. T., Scanzello C. R., Goldring M. B., Arthritis Rheum. 2012, 64, 1697. - PMC - PubMed
    1. Doyran B., Tong W., Li Q., Jia H., Zhang X., Chen C., Enomoto‐lwamoto M., Lu X., Qin L., Han L, Osteoarthritis Cartilage 2017, 25, 108. - PMC - PubMed
    1. Hunter D. J., Schofield D., Callander E., Nat. Rev. Rheumatol. 2014, 17, 437. - PubMed
    1. Heinegard D., Saxne T., Nat. Rev. Rheumatol. 2011, 7, 50. - PubMed
    1. Blom A. B., van Lent P. L., Libregts S., Holthuysen A. E., van der Kraan P. M., van Rooijen N., van den Berg W. B., Arthritis Rheum. 2007, 56, 147. - PubMed

Publication types