Super-enhancer-associated transcription factors collaboratively regulate trophoblast-active gene expression programs in human trophoblast stem cells
- PMID: 36951126
- PMCID: PMC10164554
- DOI: 10.1093/nar/gkad215
Super-enhancer-associated transcription factors collaboratively regulate trophoblast-active gene expression programs in human trophoblast stem cells
Abstract
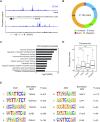
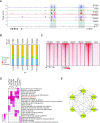
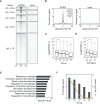
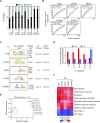
The placenta is an essential organ that supports the growth and development of the fetus during pregnancy. However, cell type-specific enhancers and transcription factors (TFs), and the mechanisms underlying the maintenance and differentiation of trophoblast stem cell (TSC) populations in the human placenta remain elusive. Here, using human TSCs as a model system, we identify 31,362 enhancers that are enriched with the motifs of previously reported TSC-pivotal TFs, including TEAD4, GATA2/3 and TFAP2C. Subsequently, we identify 580 super-enhancers (SEs) and 549 SE-associated genes. These genes are robustly expressed in the human placenta and include numerous TFs, implying that SE-associated TFs (SE-TFs) may play crucial roles in placental development. Additionally, we identify the global binding sites of five TSC-pivotal SE-TFs (FOS, GATA2, MAFK, TEAD4 and TFAP2C), revealing that they preferentially co-occupy enhancers, regulate each other and form a trophoblast-active gene regulatory network. Loss-of-function studies unveil that the five TFs promote self-renewal of TSCs by activating proliferation-associated genes while repressing developmental genes. We further reveal that the five TFs exert conserved and unique functions on placental development between humans and mice. Our study provides important insights into the roles of human TSC-pivotal TFs in regulating placenta-specific gene expression programs.
© The Author(s) 2023. Published by Oxford University Press on behalf of Nucleic Acids Research.
Figures

Similar articles
-
TEAD4 ensures postimplantation development by promoting trophoblast self-renewal: An implication in early human pregnancy loss.Proc Natl Acad Sci U S A. 2020 Jul 28;117(30):17864-17875. doi: 10.1073/pnas.2002449117. Epub 2020 Jul 15. Proc Natl Acad Sci U S A. 2020. PMID: 32669432 Free PMC article.
-
Super-enhancer-guided mapping of regulatory networks controlling mouse trophoblast stem cells.Nat Commun. 2019 Oct 18;10(1):4749. doi: 10.1038/s41467-019-12720-6. Nat Commun. 2019. PMID: 31628347 Free PMC article.
-
Regulation of endogenous retrovirus-derived regulatory elements by GATA2/3 and MSX2 in human trophoblast stem cells.Genome Res. 2023 Feb;33(2):197-207. doi: 10.1101/gr.277150.122. Epub 2023 Feb 17. Genome Res. 2023. PMID: 36806146 Free PMC article.
-
Super-Enhancers in Placental Development and Diseases.J Dev Biol. 2025 Apr 9;13(2):11. doi: 10.3390/jdb13020011. J Dev Biol. 2025. PMID: 40265369 Free PMC article. Review.
-
Transcription factor networks in trophoblast development.Cell Mol Life Sci. 2022 Jun 3;79(6):337. doi: 10.1007/s00018-022-04363-6. Cell Mol Life Sci. 2022. PMID: 35657505 Free PMC article. Review.
Cited by
-
Characterization of Ultra-Short plasma Cell-Free DNA in maternal blood and its preliminary potential as a screening marker for preeclampsia.Mol Med. 2025 Jul 12;31(1):256. doi: 10.1186/s10020-025-01307-1. Mol Med. 2025. PMID: 40652193 Free PMC article.
-
PPARG-centric transcriptional re-wiring during differentiation of human trophoblast stem cells into extravillous trophoblasts.Nucleic Acids Res. 2025 Jul 19;53(14):gkaf669. doi: 10.1093/nar/gkaf669. Nucleic Acids Res. 2025. PMID: 40705926 Free PMC article.
-
Dynamic and distinct histone modifications facilitate human trophoblast lineage differentiation.Sci Rep. 2024 Feb 24;14(1):4505. doi: 10.1038/s41598-024-55189-0. Sci Rep. 2024. PMID: 38402275 Free PMC article.
-
METTL3 shapes m6A epitranscriptomic landscape for successful human placentation.bioRxiv [Preprint]. 2024 Jul 13:2024.07.12.603294. doi: 10.1101/2024.07.12.603294. bioRxiv. 2024. PMID: 39026770 Free PMC article. Preprint.
-
Cited2 is a key regulator of placental development and plasticity.Bioessays. 2024 Aug;46(8):e2300118. doi: 10.1002/bies.202300118. Epub 2024 Jun 24. Bioessays. 2024. PMID: 38922923 Free PMC article. Review.
References
-
- Maltepe E., Fisher S.J.. Placenta: the forgotten organ. Annu. Rev. Cell Dev. Biol. 2015; 31:523–552. - PubMed
-
- Turco M.Y., Moffett A.. Development of the human placenta. Development. 2019; 146:dev163428. - PubMed
-
- Okae H., Toh H., Sato T., Hiura H., Takahashi S., Shirane K., Kabayama Y., Suyama M., Sasaki H., Arima T.. Derivation of human trophoblast stem cells. Cell Stem Cell. 2018; 22:50–63. - PubMed
-
- Lemon B., Tjian R.. Orchestrated response: a symphony of transcription factors for gene control. Genes Dev. 2000; 14:2551–2569. - PubMed
Publication types
MeSH terms
Substances
Grants and funding
LinkOut - more resources
Full Text Sources
Molecular Biology Databases

