. 2023 Jun 27;74(12):3714-3728.
doi: 10.1093/jxb/erad109.

CLPB3 is required for the removal of chloroplast protein aggregates and thermotolerance in Chlamydomonas

Affiliations

CLPB3 is required for the removal of chloroplast protein aggregates and thermotolerance in Chlamydomonas

Elena Kreis et al. J Exp Bot. .

Abstract

In the cytosol of plant cells, heat-induced protein aggregates are resolved by the CASEIN LYTIC PROTEINASE/HEAT SHOCK PROTEIN 100 (CLP/HSP100) chaperone family member HSP101, which is essential for thermotolerance. For the chloroplast family member CLPB3 this is less clear, with controversial reports on its role in conferring thermotolerance. To shed light on this issue, we have characterized two clpb3 mutants in Chlamydomonas reinhardtii. We show that chloroplast CLPB3 is required for resolving heat-induced protein aggregates containing stromal TRIGGER FACTOR (TIG1) and the small heat shock proteins 22E/F (HSP22E/F) in vivo, and for conferring thermotolerance under heat stress. Although CLPB3 accumulation is similar to that of stromal HSP70B under ambient conditions, we observed no prominent constitutive phenotypes. However, we found decreased accumulation of the PLASTID RIBOSOMAL PROTEIN L1 (PRPL1) and increased accumulation of the stromal protease DEG1C in the clpb3 mutants, suggesting that a reduction in chloroplast protein synthesis capacity and an increase in proteolytic capacity may compensate for loss of CLPB3 function. Under ambient conditions, CLPB3 was distributed throughout the chloroplast, but reorganized into stromal foci upon heat stress, which mostly disappeared during recovery. CLPB3 foci were localized next to HSP22E/F, which accumulated largely near the thylakoid membranes. This suggests a possible role for CLPB3 in disentangling protein aggregates from the thylakoid membrane system.

Keywords: Chlamydomonas reinhardtii; DEG protease; HSP100; chloroplast protein homeostasis; molecular chaperones; small heat shock proteins; unfolded protein response.


Conflict of interest statement

The authors have no conflict of interest to declare.

Figures
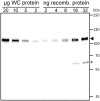
Fig. 1.
Fig. 1.
Quantification of CLPB3. The indicated amounts of whole-cell (WC) protein from Chlamydomonas wild type grown at 25 °C and of recombinant CLPB3 produced in E. coli were separated on a 8% SDS-polyacrylamide gel and analysed by immunoblotting using an antibody raised against Chlamydomonas CLPB3. The arrowhead points to intact CLPB3, and the asterisk to a degradation product.
Fig. 2.
Fig. 2.
Accumulation of chloroplast proteins with roles in protein homeostasis in wild type, clpb3 mutants and complemented lines. (A) Structure of the Chlamydomonas CLPB3 gene, insertion sites of the CIB1 cassette in the clpb3-1 and clpb3-2 mutants, and construct for complementation. Protein coding regions are drawn as black boxes, untranslated regions as bars, and introns, promoters, and intergenic regions as thin lines. Arrows indicate transcriptional start sites. WT, wild type; clpb3-c, complemented mutants; PA, PR, HSP70A and RBCS2 promoters, respectively; TRPL23, RPL23 terminator. (B) Immunoblot analysis of the accumulation of CLPB3 and selected chloroplast proteins. Cells were grown in continuous light at 25 °C (CL), exposed to 41 °C for 1 h (HS), and allowed to recover at 25 °C for 6 h after the heat treatment (R). For the analysis, 10 µg of whole-cell proteins (100%) were used. (C) Quantification of immunoblot analyses. Values are means from three independent experiments (including two technical repeats for CLPB3 and HSP22E/F), normalized first by the median of all signals obtained with a particular antibody in the same experiment, and then by the mean signal of the heat-stressed wild type. Error bars represent standard deviation. Asterisks indicate significant differences with respect to the WT (two-tailed, unpaired t-test with Bonferroni-Holm correction, P<0.05). The absence of an asterisk indicates no significant differences.
Fig. 3.
Fig. 3.
Restoration of DEG1C accumulation in complemented mutant line clpb3-2c. (A) Immunoblot analysis of CLPB3 and DEG1C accumulation in wild type (WT), clpb3-2 mutant (3-2), and complemented mutant clpb3-2c (3-2c). Cells were grown in continuous light at 25 °C. For the analysis, 10 µg (100%), 5 µg (50%) and 2.5 µg (25%) of whole-cell proteins were used. (B) Quantification of immunoblot analyses as described for Fig. 2C with normalization of protein levels relative to WT. Error bars represent standard deviation (n=3). Asterisks indicate significant differences with respect to the WT (two-tailed, unpaired t-test with Bonferroni-Holm correction, P<0.05). The absence of an asterisk indicates that there were no significant differences.
Fig. 4.
Fig. 4.
Analysis of the oligomeric state of CLPB3. Whole-cell proteins from wild-type (WT), clpb3 mutants and complemented lines exposed to the heat shock/recovery regime used in Fig. 2B were solubilized with 1% β-DDM and subjected to BN-PAGE. A lane of the gel after electrophoresis is shown at the left with PSII supercomplexes (I+II), PSI-LHCI (II), PSII dimers (III), ATP synthase (IV), PSII monomers/Cyt b6f complex (V), LHCII trimers (VI), and LHCII monomers (VII) visible as prominent bands. On the right is an immunoblot of the gel probed with antibodies against CLPB3. A, aggregates; M, CLPB3 monomers. The asterisk indicates a protein, presumably of PSI, that cross-reacts with the CLPB3 antibody. CL, 25 °C; HS, 1 h at 41 °C; R, 6 h recovery at 25 °C.
Fig. 5.
Fig. 5.
Sub-cellular localization of CLPB3 and HSP22EF. Cells were exposed to the heat shock/recovery regime used in Fig. 2B for wild type (WT) and clpb3-2c, or only to a 1 h heat shock treatment (for WT and clpb3-1c). HSP22E/F (22EF) and HA-tagged CLPB3 (HA) were detected by immunofluorescence using antibodies against HSP22E/F (magenta) and the HA epitope (green). Merge: overlay of both signals. Scale bars=2 µm.
Fig. 6.
Fig. 6.
Analysis of aggregate formation and removal in wild type (WT), clpb3 mutants, and complemented lines. (A) Cells were exposed to the heat shock/recovery regime used in Fig. 2B. Total cell proteins and purified aggregates for each condition were separated by SDS-PAGE and stained with Coomassie blue. (B) Immunoblot analysis using antibodies against CLPB3, HSP22E/F, and TIG1 on total cell proteins and aggregates. (C) Quantification of the immunoblot analyses. Values represent the percentage of protein left in aggregates after 6 h of recovery from three independent experiments. Error bars represent standard deviation. Asterisks indicate significant differences between mutant and its respective complemented line (two-tailed, unpaired t-test, P<0.05). The absence of an asterisk means that there were no significant differences. CL, 25 °C; HS, 1 h at 41 °C; R, 6 h recovery at 25 °C.
Fig. 7.
Fig. 7.
Analysis of growth phenotypes. (A) Wild type (WT), clpb3 mutants, and complemented lines were grown to log phase, diluted, and spotted onto agar plates with the cell numbers indicated. TAP plates were used for monitoring mixotrophic growth (light) or heterotrophic growth (dark), HSM plates for monitoring photoautotrophic growth. LL: low light at 30 µmol photons m–2 s–1; HL: high light at 600 µmol photons m–2 s–1; HS: three ~24 h heat shock exposures at 40 °C with ≤24 h recovery in between. The cell genotypes and number of cells spotted are shown. (B) Liquid cultures of WT, clpb3 mutants and complemented lines were grown to log phase, exposed to 40 °C for 72 h (HS) and allowed to recover at 25 °C for 120 h (R). Before the treatment, part of the culture was diluted and grown at 25 °C for 72 h (CL). Photographs of the cultures taken right after the corresponding treatment are shown. (C) WT and clpb3-1 mutant were grown to log phase at 25 °C and exposed to 41 °C for 2 h. Aliquots taken for each condition were diluted, plated on agar plates, and colony-forming units counted after 4 d at 25 °C to determine survival rates. Values are from four independent experiments done in triplicate. Error bars represent standard deviation. Differences were significant at P<0.05 (two-tailed, unpaired t-test).

References

    1. Agarwal M, Sahi C, Katiyar-Agarwal S, Agarwal S, Young T, Gallie DR, Sharma VM, Ganesan K, Grover A.. 2003. Molecular characterization of rice hsp101: complementation of yeast hsp104 mutation by disaggregation of protein granules and differential expression in indica and japonica rice types. Plant Molecular Biology 51, 543–553. - PubMed
    1. Amunts A, Drory O, Nelson N.. 2007. The structure of a plant photosystem I supercomplex at 3.4 A resolution. Nature 447, 58–63. - PubMed
    1. Asamizu E, Miura K, Kucho K, Inoue Y, Fukuzawa H, Ohyama K, Nakamura Y, Tabata S.. 2000. Generation of expressed sequence tags from low-CO2 and high-CO2 adapted cells of Chlamydomonas reinhardtii. DNA Research 7, 305–307. - PubMed
    1. Avellaneda MJ, Franke KB, Sunderlikova V, Bukau B, Mogk A, Tans SJ.. 2020. Processive extrusion of polypeptide loops by a Hsp100 disaggregase. Nature 578, 317–320. - PubMed
    1. Bai C, Guo P, Zhao Q, et al. . 2015. Protomer roles in chloroplast chaperonin assembly and function. Molecular Plant 8, 1478–1492. - PubMed

Publication types

MeSH terms