. 2023 Jan-Dec;15(1):2190303.
doi: 10.1080/19490976.2023.2190303.

Enterohemorrhagic Escherichia coli responds to gut microbiota metabolites by altering metabolism and activating stress responses

Affiliations

Enterohemorrhagic Escherichia coli responds to gut microbiota metabolites by altering metabolism and activating stress responses

Stefanie L Vogt et al. Gut Microbes. 2023 Jan-Dec.

Abstract

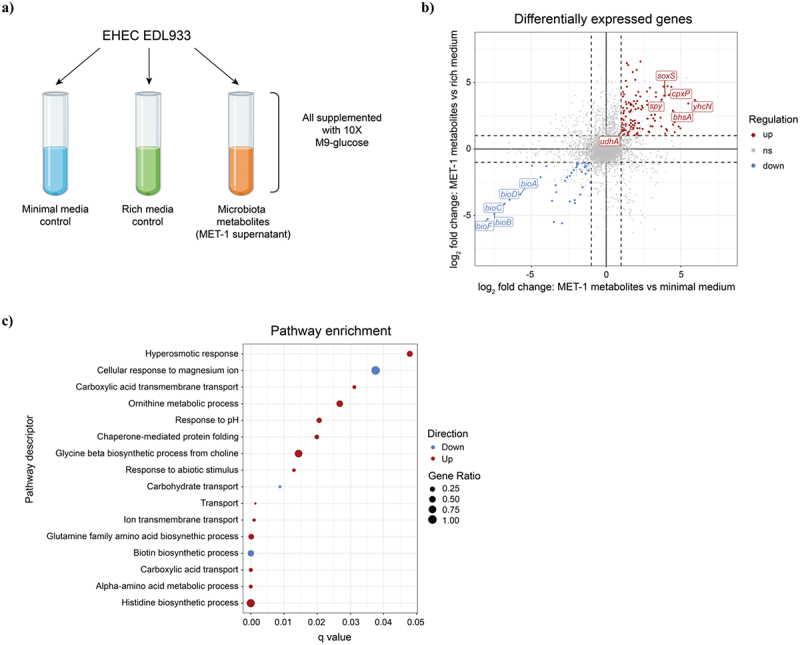
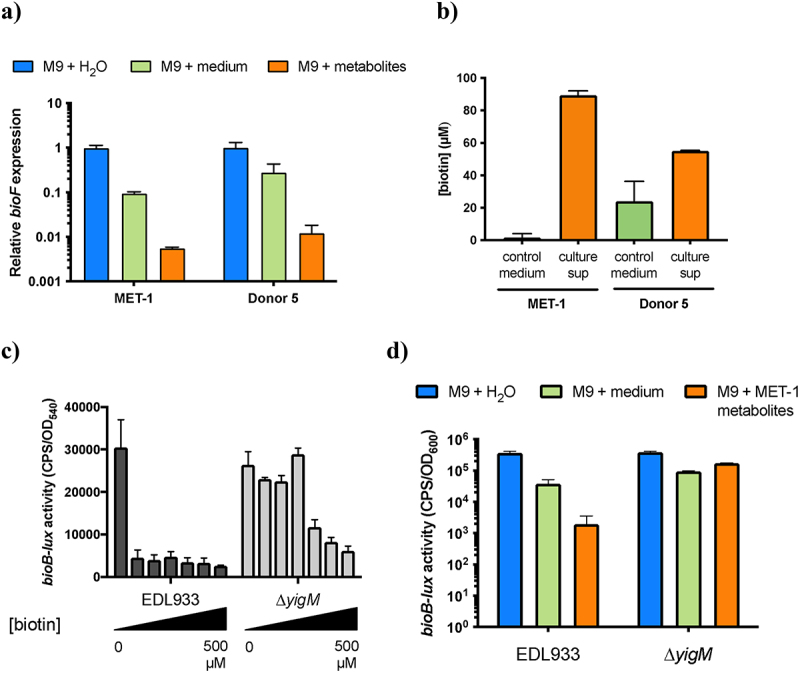
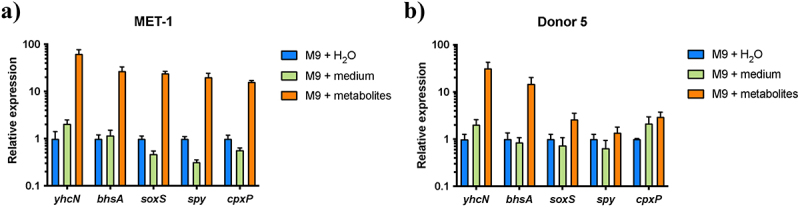
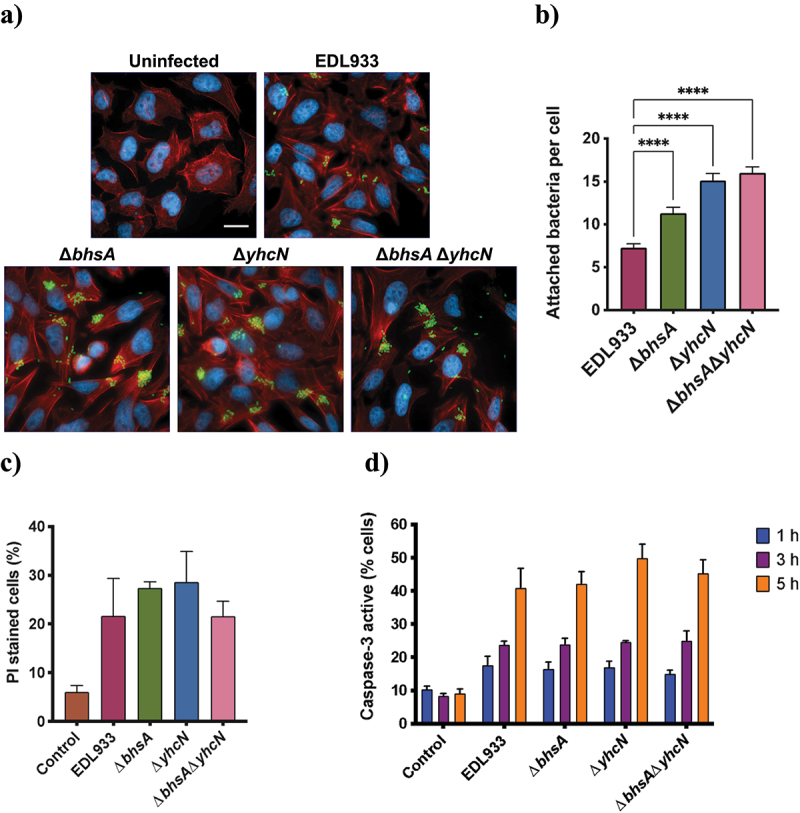
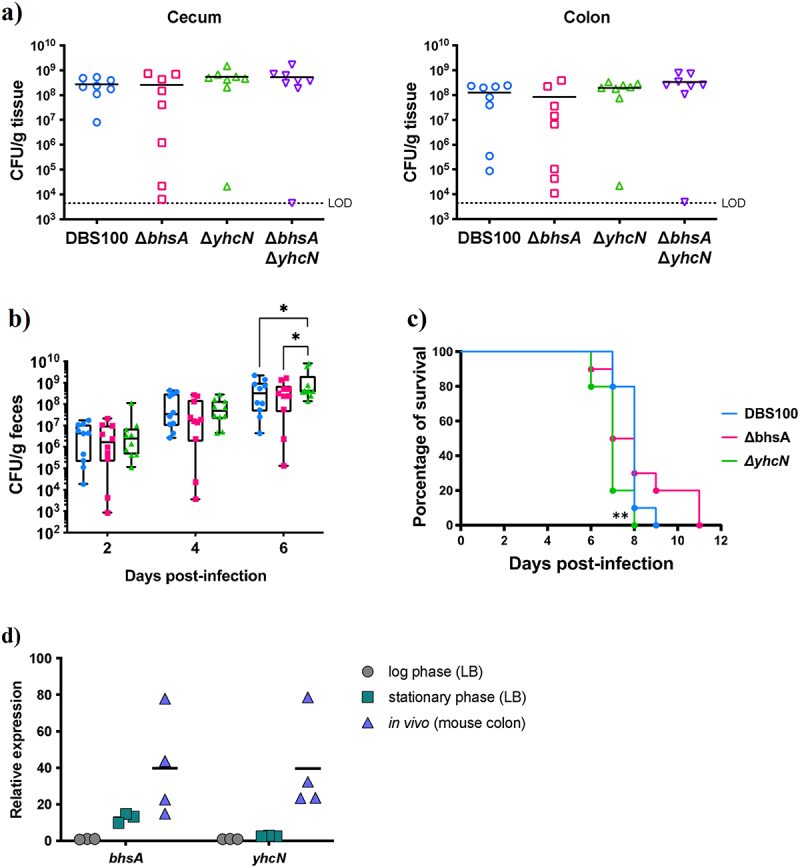
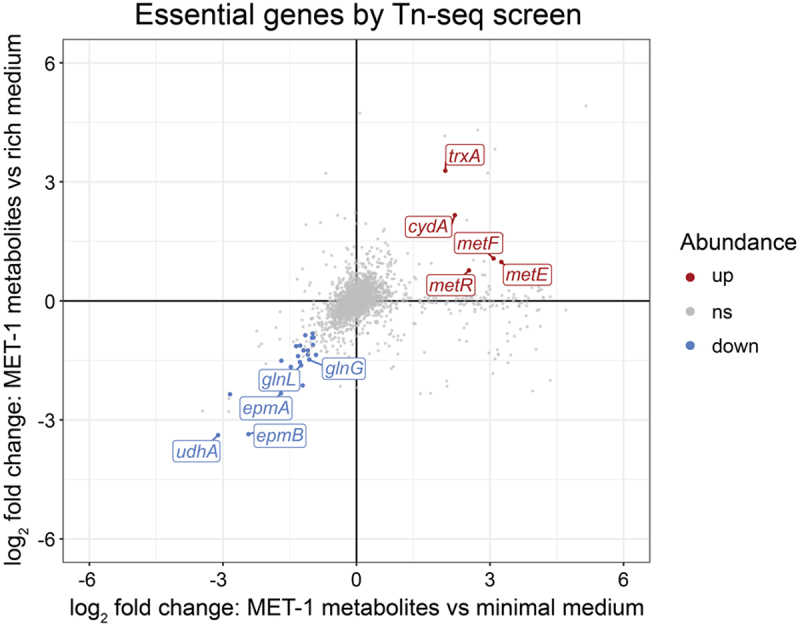
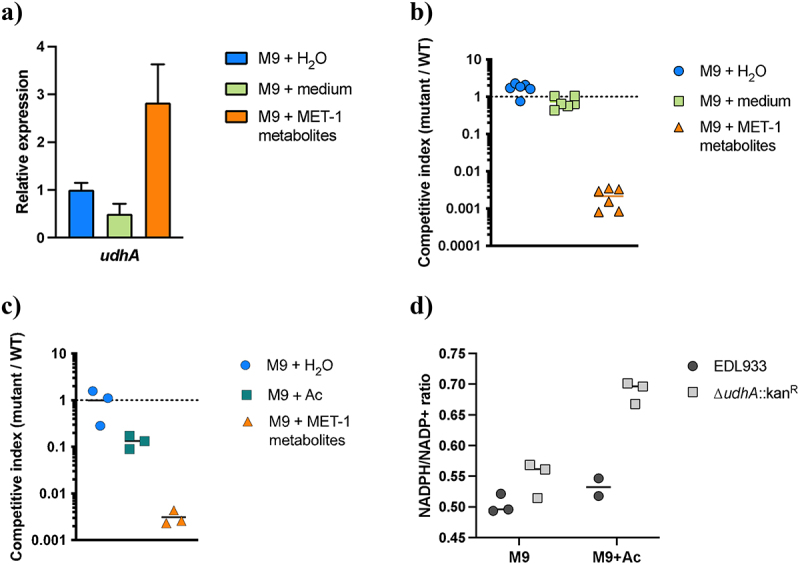
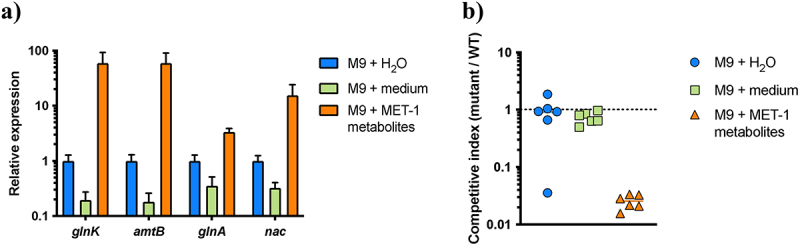
Enterohemorrhagic Escherichia coli (EHEC) is a major cause of severe bloody diarrhea, with potentially lethal complications, such as hemolytic uremic syndrome. In humans, EHEC colonizes the colon, which is also home to a diverse community of trillions of microbes known as the gut microbiota. Although these microbes and the metabolites that they produce represent an important component of EHEC's ecological niche, little is known about how EHEC senses and responds to the presence of gut microbiota metabolites. In this study, we used a combined RNA-Seq and Tn-Seq approach to characterize EHEC's response to metabolites from an in vitro culture of 33 human gut microbiota isolates (MET-1), previously demonstrated to effectively resolve recurrent Clostridioides difficile infection in human patients. Collectively, the results revealed that EHEC adjusts to growth in the presence of microbiota metabolites in two major ways: by altering its metabolism and by activating stress responses. Metabolic adaptations to the presence of microbiota metabolites included increased expression of systems for maintaining redox balance and decreased expression of biotin biosynthesis genes, reflecting the high levels of biotin released by the microbiota into the culture medium. In addition, numerous genes related to envelope and oxidative stress responses (including cpxP, spy, soxS, yhcN, and bhsA) were upregulated during EHEC growth in a medium containing microbiota metabolites. Together, these results provide insight into the molecular mechanisms by which pathogens adapt to the presence of competing microbes in the host environment, which ultimately may enable the development of therapies to enhance colonization resistance and prevent infection.

Keywords: EHEC; Enterohemorrhagic Escherichia coli; RNA-seq; Tn-seq; bacterial metabolism; gut microbiota; metabolites; stress response.


Conflict of interest statement

No potential conflict of interest was reported by the authors.

Figures

Figure 1.
Figure 1.
RNA-Seq analysis of EHEC’s response to gut microbiota-produced metabolites. (a) Overview of experimental design. (b) Overview of RNA-Seq results. Scatterplot shows transcript abundance in EHEC grown in MET-1 microbiota metabolites compared to the minimal medium control on the x-axis and compared to the rich medium control on the y-axis. Transcripts that were considered significantly upregulated (fold change threshold of ≥ 2 and q < 0.05 in both metabolites vs. minimal medium and metabolites vs. rich medium) are colored red and those considered significantly downregulated (fold change threshold of≤0.5 and q < 0.05 in both metabolites vs. minimal medium and metabolites vs. rich medium) are colored blue. Genes that are discussed further in the text are labeled. (c) Gene ontology (GO) pathway enrichment analysis of differentially expressed genes (DEGs). Gene Ratio refers to the proportion of enriched genes per pathway.
Figure 2.
Figure 2.
Microbiota-derived biotin represses expression of EHEC biotin biosynthesis genes. (a) RT-qPCR analysis of bioF expression during EHEC growth in two different microbiota culture supernatants (MET-1 and Donor 5), as well as minimal medium and rich medium controls. (b) Biotin concentration in the microbiota supernatants and control media as measured using the Abcam Biotin Quantitation Kit (Colorimetric). (c) bioB-lux reporter activity in wild-type and ΔyigM EHEC grown in M9 minimal medium with and without addition of external biotin (5 nM to 500 µm). (d) Activity of bioB-lux reporter during growth of wild-type and ΔyigM EHEC in MET-1 metabolites and control media. In panels a, c, and d, data represent mean and standard deviation of three biological replicate cultures; in panel b, data represent mean and SEM of three technical replicates.
Figure 3.
Figure 3.
EHEC stress response genes are activated during growth in the presence of microbiota metabolites. RT-qPCR analysis of stress response gene expression during EHEC growth in two different microbiota culture supernatants [MET-1 (a) and Donor 5 (b)], as well as minimal medium and rich medium controls. Data represent mean and standard deviation of three biological replicate cultures per condition.
Figure 4.
Figure 4.
Mutations in microbiota-activated genes bhsA and yhcN affect EHEC adherence to HeLa cells. (a) Representative immunofluorescence microscopy images of uninfected and EHEC-infected HeLa cells. Scale bar; 20 m. b) Quantification of adherent bacteria per HeLa cell, based on the immunofluorescence microscopy images. Data represent mean and SEM of 300 HeLa cells per strain. ****, p < 0.0001, Dunnett’s multiple comparison test. (c) Propidium iodide staining of EHEC-infected HeLa cells. Data represent mean and SEM from three biological replicates. (d) Caspase-3 activation in EHEC-infected HeLa cells. Data represent mean and SEM of three biological replicates.
Figure 5.
Figure 5.
Role of bhsA and yhcN in C. rodentium infection of the mouse gut. (a) Enumeration of C. rodentium colonizing the cecum and colon of C57BL/6 mice, 6 days post-infection. Each group represents the mean and standard deviation of N = 8 mice. LOD, limit of detection. (b) Fecal shedding of C. rodentium throughout the course of infection of C3H/HeJ mice. Minimum and maximum values are represented by short vertical lines of whiskers; the box signifies the upper and lower quartiles, and the short line within the box signifies the median. N = 10 mice per strain.   (c) Survival of C3H/HeJ mice infected with wild-type and mutant strains of C. rodentium. Mice were monitored daily and euthanized upon reaching the humane endpoint. **, p < 0.01, Mantel– Cox test.   (d) RT-qPCR analysis of expression of C. rodentium bhsA and yhcN during growth in vitro (in log phase or stationary phase, both in LB medium) or in vivo (in the distal colon of C57BL/6 mice, 9 days post-infection). Horizontal lines represent the mean of N = 3 replicate in vitro cultures or N = 4 mice.
Figure 6.
Figure 6.
Identification of EHEC genes affecting fitness during growth in microbiota metabolites using Tn-Seq. Scatterplot shows differences in Tn-Seq reads mapped to each EHEC gene for EHEC cultures grown in MET-1 microbiota metabolites compared to the minimal medium control on the x-axis and compared to the rich medium control on the y-axis. Genes that were considered to promote fitness in microbiota metabolites are colored blue while genes that reduce fitness in microbiota metabolites are colored red (criteria described in Materials and Methods). Genes that are discussed further in the text are labeled.
Figure 7.
Figure 7.
UdhA promotes EHEC growth in the presence of microbiota metabolites including acetate. (a) RT-qPCR analysis of udhA expression during EHEC growth in MET-1 microbiota culture supernatant and minimal and rich medium controls. Data represent mean and standard deviation of three biological replicate cultures per condition. (b) and (c) Competitive growth of EDL933 and ΔudhA:kanR in MET-1 microbiota culture supernatant and minimal and rich medium controls (b), or M9-glucose minimal medium with and without 40 mM acetate (c). Competitive index is calculated as the proportion of mutant cells at the end of growth divided by the proportion of mutant cells at the beginning of growth. (d) Ratio of intracellular reduced NADPH to oxidized NADP+, measured using the EnzyChrom NADP+/NADPH Assay Kit. Wild-type and ΔudhA::kanR EHEC strains were grown in M9-glucose minimal medium with and without 40 mM acetate. Data represent the mean of two to three biological replicate cultures per strain and medium condition.
Figure 8.
Figure 8.
The NtrBC two-component system promotes EHEC growth in the presence of microbiota metabolites. (a) RT-qPCR analysis of expression of NtrBC-regulated genes during EHEC growth in MET-1 microbiota culture supernatant and minimal and rich medium controls. Data represent mean and standard deviation of three biological replicate cultures per condition. (b) Competitive growth of EDL933 and ΔglnLG::kanR in MET-1 microbiota culture supernatant and minimal and rich medium controls. Competitive index is calculated as the proportion of mutant cells at the end of growth divided by the proportion of mutant cells at the beginning of growth.

Similar articles

Cited by

References

    1. Fatima R, Aziz M.. Enterohemorrhagic Escherichia coli. StatPearls. 2022. PMID: 30137794. - PubMed
    1. Scheiring J, Andreoli SP, Zimmerhackl LB. Treatment and outcome of Shiga-toxin-associated hemolytic uremic syndrome (HUS). Pediatr Nephrol. 2008;23:1749–24. doi:10.1007/s00467-008-0935-6. - DOI - PMC - PubMed
    1. Beery JT, Doyle MP, Schoeni JL. Colonization of chicken cecae by Escherichia coli associated with haemorrhagic colitis. Appl Environ Microbiol. 1985;49:310–315. doi:10.1128/aem.49.2.310-315.1985. - DOI - PMC - PubMed
    1. Croxen MA, Law RJ, Scholz R, Keeney KM, Wlodarska M, Finlay BB. Recent advances in understanding enteric pathogenic Escherichia coli. Clin Microbiol Rev. 2013;26:822–880. doi:10.1128/CMR.00022-13. - DOI - PMC - PubMed
    1. McDaniel TK, Jarvis KG, Donnenberg MS, Kaper JB. A genetic locus of enterocyte effacement conserved among diverse enterobacterial pathogens. Proc Natl Acad Sci U S A. 1995;92:1664–1668. doi:10.1073/pnas.92.5.1664. - DOI - PMC - PubMed

Publication types