

Mcrs1 regulates G2/M transition and spindle assembly during mouse oocyte meiosis
- PMID: 36951681
- PMCID: PMC10157313
- DOI: 10.15252/embr.202256273
Mcrs1 regulates G2/M transition and spindle assembly during mouse oocyte meiosis
Abstract
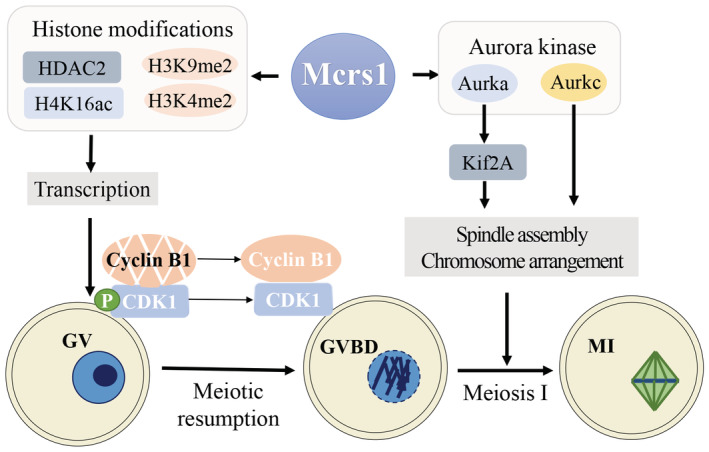
Microspherule protein 1 (Mcrs1) is a component of the nonspecific lethal (NSL) complex and the chromatin remodeling INO80 complex, which participates in transcriptional regulation during mitosis. Here, we investigate the roles of Mcrs1 during female meiosis in mice. We demonstrate that Mcrs1 is a novel regulator of the meiotic G2/M transition and spindle assembly in mouse oocytes. Mcrs1 is present in the nucleus and associates with spindle poles and chromosomes of oocytes during meiosis I. Depletion of Mcrs1 alters HDAC2-mediated H4K16ac, H3K4me2, and H3K9me2 levels in nonsurrounded nucleolus (NSN)-type oocytes, and reduces CDK1 activity and cyclin B1 accumulation, leading to G2/M transition delay. Furthermore, Mcrs1 depletion results in abnormal spindle assembly due to reduced Aurora kinase (Aurka and Aurkc) and Kif2A activities, suggesting that Mcrs1 also plays a transcription-independent role in regulation of metaphase I oocytes. Taken together, our results demonstrate that the transcription factor Mcrs1 has important roles in cell cycle regulation and spindle assembly in mouse oocyte meiosis.
Keywords: G2/M transition; Mcrs1; meiosis; oocyte; spindle.
© 2023 The Authors.
Conflict of interest statement
The authors declare that they have no conflict of interest.
Figures
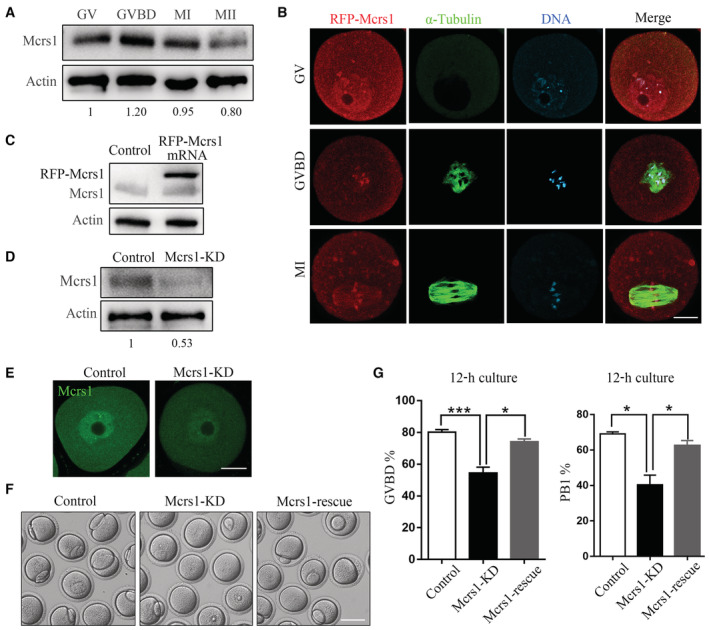
Western blotting of Mcrs1 at the GV (0 h), GVBD (4 h), MI (8 h), and MII (12 h) stages of mouse oocyte meiosis. The blots were probed with anti‐Mcrs1 and anti‐actin antibodies.
Representative images of RFP‐Mcrs1 localization during mouse oocyte meiosis. Mouse oocytes at different developmental stages were immunostained with an anti‐α‐tubulin antibody (green). The localization of RFP‐Mcrs1 (red) was determined. DNA (blue) was counterstained with Hoechst 33342. Scale bar, 20 μm.
Western blotting of Mcrs1 and β‐actin in Mcrs1 mRNA‐injected and control oocytes.
Western blotting of Mcrs1 and β‐actin in Mcrs1‐KD and control oocytes.
Immunofluorescence analysis of Mcrs1 in control and Mcrs1‐KD oocytes. Scale bar, 20 μm.
Representative images of the occurrence of GVBD and PBE in control, Mcrs1‐KD, and Mcrs1‐rescue (Mcrs1 siRNA + Mcrs1 mRNA) oocytes at 12 h following release from IBMX. Scale bar, 100 μm.
Percentages of control (n = 210), Mcrs1‐KD (n = 182), and Mcrs1‐rescue (n = 201) oocytes that underwent GVBD and PBE. The bars are representing the mean ± SEM. The P‐values were calculated using Student's t‐test. GVBD%: ***P = 0.0003; *P = 0.01, PB1%: *P = 0.03; *P = 0.02.
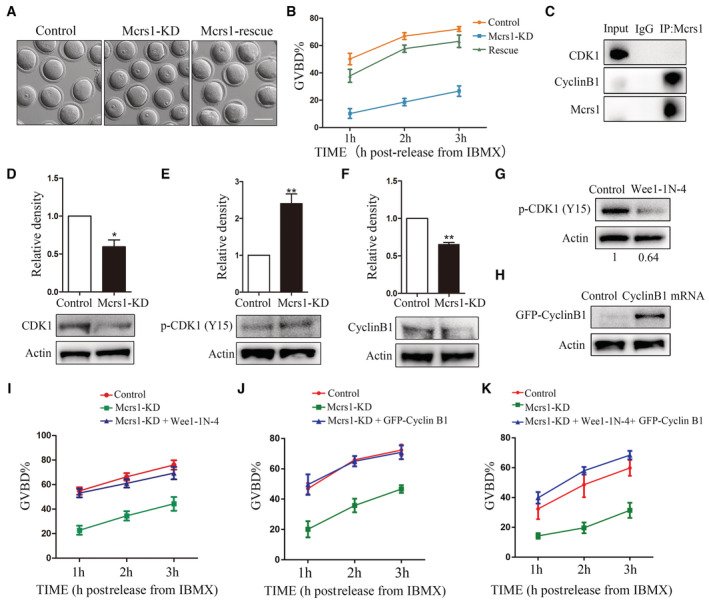
Representative images of the occurrence of GVBD in control, Mcrs1‐KD, and Mcrs1‐rescue (Mcrs1 siRNA + Mcrs1 mRNA) oocytes at 3 h following release from IBMX. Scale bar, 100 μm.
The incidence of GVBD at 1, 2, and 3 h post‐IBMX release in control (n = 155), Mcrs1‐KD (n = 157), and Mcrs1‐rescue (n = 150) oocytes.
Co‐IP was performed with an anti‐Mcrs1 antibody. The immunoblots of protein precipitates were probed with anti‐CDK1 and anti‐cyclin B1 antibodies.
Expression levels of CDK1 in Mcrs1‐KD and control oocytes. The bars represent the mean (± SEM) of 5 biological replicates. The P‐values were calculated using Student's t‐test. *P = 0.01.
Expression levels of p‐CDK1(Y15) in Mcrs1‐KD and control oocytes at 1 h following release from IBMX (200 oocytes per sample). The bars represent the mean (± SEM) of three biological replicates. The P‐values were calculated using Student's t‐test. **P = 0.006.
Expression levels of cyclin B1 in control and Mcrs1‐KD oocytes at 1 h following release from IBMX (200 oocytes per sample). The bars represent the mean (± SEM) of three biological replicates. The P‐values were calculated using Student's t‐test. **P = 0.0042.
Protein levels of p‐CDK1(Y15) in control and WEE1‐IN‐4‐treated GV oocytes. The blots were probed with anti‐p‐CDK1(Y15) and anti‐actin antibodies.
Western blotting of GFP‐cyclin B1 and β‐actin in GFP‐cyclin B1 mRNA‐injected and control oocytes.
The incidence of GVBD at 1, 2, and 3 h post‐IBMX release in control oocytes (n = 112), Mcrs1‐KD oocytes (n = 98), and Mcrs1‐KD oocytes treated with 5 mM WEE1‐IN‐4 (n = 102).
The incidence of GVBD at 1, 2, and 3 h post‐IBMX release in control (n = 123), Mcrs1‐KD (n = 134), and Mcrs1 siRNA + cyclin B1‐GFP (n = 95) oocytes.
The incidence of GVBD at 1, 2, and 3 h post‐IBMX release in control (n = 92), Mcrs1‐KD (n = 97), and Mcrs1 siRNA + cyclin B1‐GFP oocytes treated with 5 mM WEE1‐IN‐4 (n = 106).
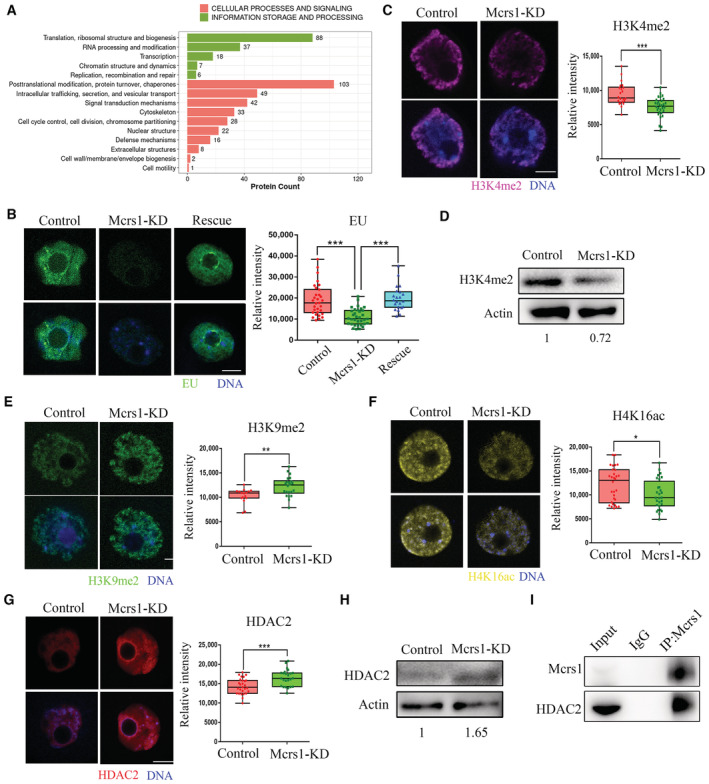
KGO analysis of Mcrs1‐associated proteins by mass spectrometry.
Detection of newly synthesized RNAs by EU incorporation in control, Mcrs1‐KD, and Mcrs1‐rescue GV oocytes. The scattergram shows the relative fluorescence intensity of EU in control (n = 43), Mcrs1‐KD (n = 52), and Mcrs1‐rescue (n = 30) GV oocytes. Scale bar, 10 μm. ***P = 0.0001.
Immunofluorescence analysis of H3K4me2 in control and Mcrs1‐KD oocytes. Scale bar, 10 μm. Relative fluorescence intensity of H3K4me2 signals in control (n = 26) and Mcrs1‐KD (n = 30) GV oocytes. ***P = 0.0001.
Protein levels of H3K4me2 in control and Mcrs1‐KD GV oocytes. The blots were probed with anti‐H3K4me2 and anti‐actin antibodies.
Immunofluorescence analysis of H3K9me2 in control and Mcrs1‐KD oocytes. Scale bar, 10 μm. Relative fluorescence intensity of H3K9me2 signals in control (n = 29) and Mcrs1‐KD (n = 22) GV oocytes. **P = 0.0035.
Immunofluorescence analysis of H4K16ac in control and Mcrs1‐KD oocytes. Scale bar, 10 μm. Relative fluorescence intensity of H4K16ac signals in control (n = 30) and Mcrs1‐KD (n = 28) GV oocytes. *P = 0.022.
Immunofluorescence analysis of HDAC2 in control and Mcrs1‐KD oocytes. Scale bar, 10 μm. Relative fluorescence intensity of HDAC2 signals in control (n = 27) and Mcrs1‐KD (n = 24) GV oocytes. ***P = 0.0005.
Protein levels of HDAC2 in control and Mcrs1‐KD GV oocytes. The blots were probed with anti‐HDAC2 and anti‐actin antibodies.
Co‐IP was performed with an anti‐Mcrs1 antibody. The immunoblots of protein precipitates were probed with anti‐HDAC2 and anti‐Mcrs1 antibodies.
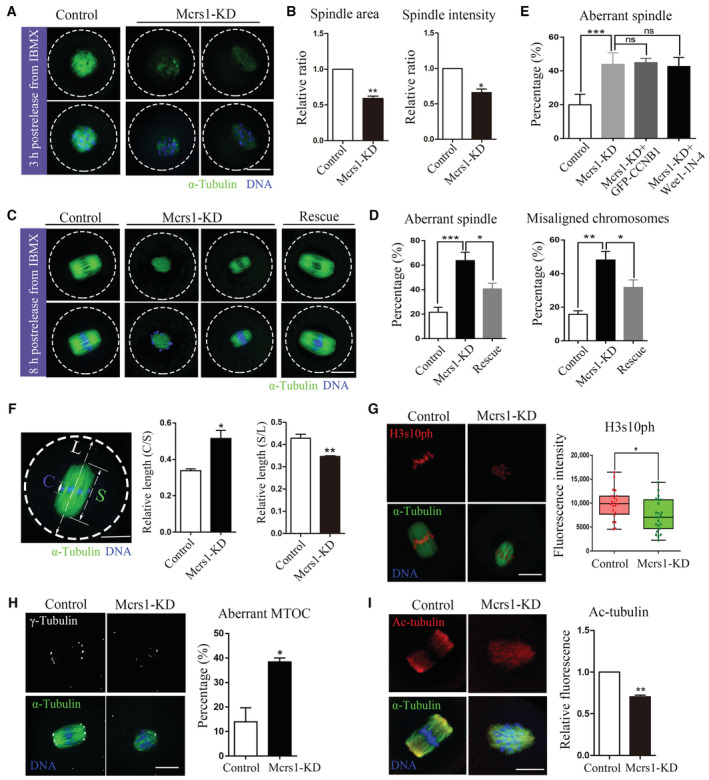
Representative images of spindle assembly at 3‐h postrelease from IBMX in control and Mcrs1‐KD oocytes. Scale bar, 20 μm.
The relative area and fluorescence of spindles in control (n = 82) and Mcrs1‐KD (n = 73) oocytes at 3‐h postrelease from IBMX. *P < 0.05; **P < 0.01.
Representative images of spindle assembly and chromosome alignment at 8‐h postrelease from IBMX in control, Mcrs1‐KD, and Mcrs1‐rescue oocytes. Scale bar, 20 μm.
Percentages of control (n = 84), Mcrs1‐KD (n = 80), and Mcrs1‐rescue (n = 62) oocytes with abnormal spindles and misaligned chromosomes. **P = 0.004; *P = 0.014; ***P = 0.0009; *P = 0.002.
Percentages of control (n = 73), Mcrs1‐KD (n = 57), Mcrs1 siRNA + cyclin B1‐GFP (n = 60), and Mcrs1 siRNA + WEE1‐IN‐4 (n = 82) oocytes with abnormal spindles. ***P = 0.001.
Thickness of the spindle middle plate and relative spindle length. C indicates the maximal span of chromosomes, S indicates the maximal spindle length, and L indicates the oocyte diameter. The histogram shows the C:S and S:L ratios for control (n = 58) and Mcrs1‐KD (n = 76) oocytes at 6 h after GVBD. Scale bar, 20 μm. *P = 0.018; **P = 0.01.
Immunofluorescence analysis of H3S10ph and α‐tubulin in control and Mcrs1‐KD oocytes. Scale bar, 20 μm. The scattergram shows the relative fluorescence intensity of H3S10ph signals in control (n = 21) and Mcrs1‐KD (n = 23) oocytes. *P = 0.017.
Immunofluorescence analysis of γ‐tubulin and α‐tubulin in control and Mcrs1‐KD oocytes. Scale bar, 20 μm. The histogram shows the percentages of control (n = 55) and Mcrs1‐KD (n = 63) oocytes with abnormal γ‐tubulin. *P = 0.014.
Immunofluorescence analysis of acetylated tubulin and α‐tubulin in control and Mcrs1‐KD oocytes. Scale bar, 20 μm. The scattergram shows the relative fluorescence intensity of acetylated tubulin signals in control (n = 83) and Mcrs1‐KD (n = 66) oocytes. **P = 0.0046.
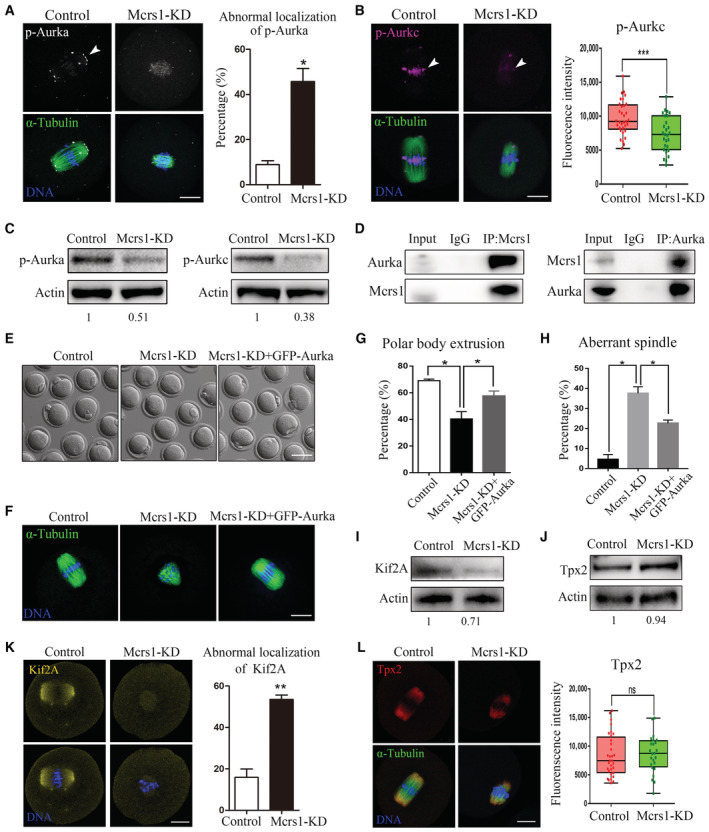
Immunofluorescence analysis of p‐Aurka and α‐tubulin in control and Mcrs1‐KD oocytes. Scale bar, 20 μm. The arrowhead points to the position of p‐Aurka. The histogram shows the percentages of control (n = 62) and Mcrs1‐KD (n = 53) oocytes with abnormal p‐Aurka. *P = 0.02.
Immunofluorescence analysis of p‐Aurkc and α‐tubulin in control and Mcrs1‐KD oocytes. Scale bar, 20 μm. The arrowhead points to the position of p‐Aurkc. The scattergram shows the relative fluorescence intensity of p‐Aurkc signals in control (n = 33) and Mcrs1‐KD (n = 27) oocytes. ***P = 0.0007.
Levels of p‐Aurka and p‐Aurkc in control and Mcrs1‐KD MI oocytes. The blots were probed with anti‐p‐Aurora A/B/C and anti‐actin antibodies.
Co‐IP was performed with an anti‐Mcrs1 antibody. The immunoblots of protein precipitates were probed with an anti‐Aurka antibody.
Representative images of the occurrence of GVBD in control, Mcrs1‐KD, and Aurka‐rescue (Mcrs1 siRNA + Aurka mRNA) oocytes at 12 h following release from IBMX. Scale bar, 100 μm.
Representative images of spindle assembly and chromosome alignment in control, Mcrs1‐KD, and Aurka‐rescue oocytes. Scale bar, 20 μm.
Percentages of control (n = 92), Mcrs1‐KD (n = 73), and Aurka‐rescue (n = 67) oocytes that underwent PBE. *P = 0.033; *P = 0.018.
Percentages of control (n = 69), Mcrs1‐KD (n = 76), and Aurka‐rescue (n = 43) oocytes with abnormal spindles. *P = 0.018; *P = 0.024.
Protein levels of Kif2A in control and Mcrs1‐KD MI oocytes. The blots were probed with anti‐Kif2A and anti‐actin antibodies.
Protein levels of TPX2 in control and Mcrs1‐KD MI oocytes. The blots were probed with anti‐TPX2 and anti‐actin antibodies.
Immunofluorescence analysis of Kif2A in control and Mcrs1‐KD oocytes. Scale bar, 20 μm. The histogram shows the percentages of control (n = 50) and Mcrs1‐KD (n = 61) oocytes with abnormal Kif2A. **P = 0.003.
Immunofluorescence analysis of TPX2 and α‐tubulin in control and Mcrs1‐KD oocytes. Scale bar, 20 μm. The scattergram shows the relative fluorescence intensity of TPX2 signals in control (n = 48) and Mcrs1‐KD (n = 52) oocytes.
Similar articles
-
CDC6 regulates both G2/M transition and metaphase-to-anaphase transition during the first meiosis of mouse oocytes.J Cell Physiol. 2020 Jul;235(7-8):5541-5554. doi: 10.1002/jcp.29469. Epub 2020 Jan 26. J Cell Physiol. 2020. PMID: 31984513
-
CtIP regulates G2/M transition and bipolar spindle assembly during mouse oocyte meiosis.J Genet Genomics. 2024 Dec;51(12):1435-1446. doi: 10.1016/j.jgg.2024.09.005. Epub 2024 Sep 12. J Genet Genomics. 2024. PMID: 39277031
-
Kinesin KIF16B Participates in G2/M Transition and Microtubule Dynamics via Aurora A-PLK1 in Oocyte Meiosis.FASEB J. 2025 Jul 31;39(14):e70854. doi: 10.1096/fj.202501664R. FASEB J. 2025. PMID: 40704502
-
Prophase I arrest and progression to metaphase I in mouse oocytes: comparison of resumption of meiosis and recovery from G2-arrest in somatic cells.Mol Hum Reprod. 2010 Sep;16(9):654-64. doi: 10.1093/molehr/gaq034. Epub 2010 May 7. Mol Hum Reprod. 2010. PMID: 20453035 Free PMC article. Review.
-
The chromosomal basis of meiotic acentrosomal spindle assembly and function in oocytes.Chromosoma. 2017 Jun;126(3):351-364. doi: 10.1007/s00412-016-0618-1. Epub 2016 Nov 11. Chromosoma. 2017. PMID: 27837282 Free PMC article. Review.
Cited by
-
The landscape of transcriptional profiles in human oocytes with different chromatin configurations.J Ovarian Res. 2024 May 10;17(1):99. doi: 10.1186/s13048-024-01431-2. J Ovarian Res. 2024. PMID: 38730385 Free PMC article.
-
Loss of AMPK activity induces organelle dysfunction and oxidative stress during oocyte aging.Biol Direct. 2024 Apr 23;19(1):29. doi: 10.1186/s13062-024-00471-4. Biol Direct. 2024. PMID: 38654312 Free PMC article.
-
Arf1 GTPase Regulates Golgi-Dependent G2/M Transition and Spindle Organization in Oocyte Meiosis.Adv Sci (Weinh). 2024 Jan;11(4):e2303009. doi: 10.1002/advs.202303009. Epub 2023 Nov 28. Adv Sci (Weinh). 2024. PMID: 38014604 Free PMC article.
References
-
- Carabatsos MJ, Combelles CM, Messinger SM, Albertini DF (2000) Sorting and reorganization of centrosomes during oocyte maturation in the mouse. Microsc Res Tech 49: 435–444 - PubMed
Publication types
MeSH terms
Substances
LinkOut - more resources
Full Text Sources
Molecular Biology Databases
Research Materials
Miscellaneous
