. 2023 Jun 5;220(6):e20212062.
doi: 10.1084/jem.20212062. Epub 2023 Mar 23.

Stromal and therapy-induced macrophage proliferation promotes PDAC progression and susceptibility to innate immunotherapy

Affiliations

Stromal and therapy-induced macrophage proliferation promotes PDAC progression and susceptibility to innate immunotherapy

Chong Zuo et al. J Exp Med. .

Abstract

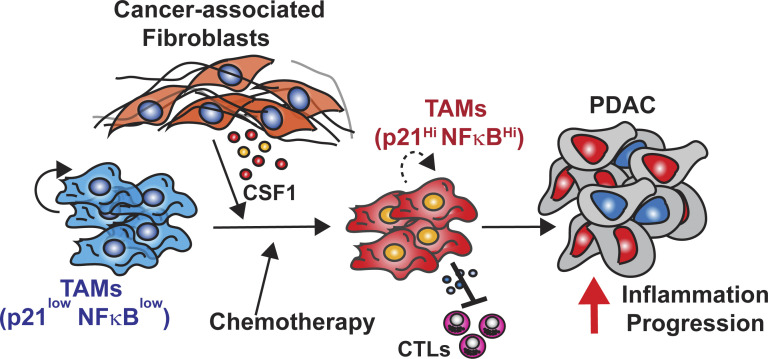
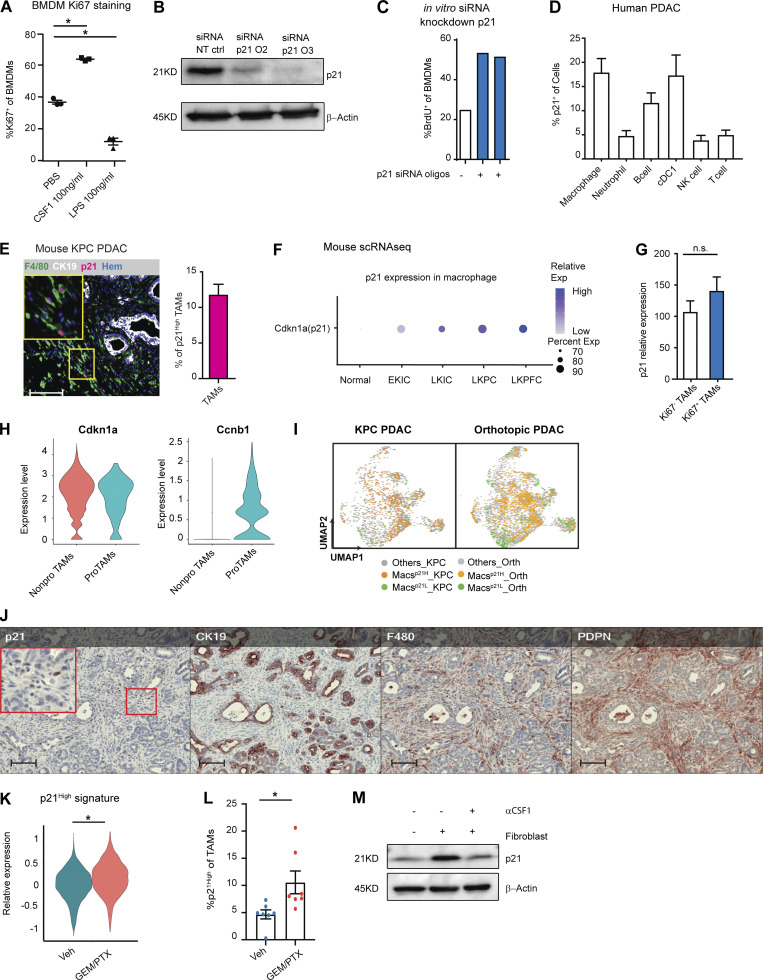
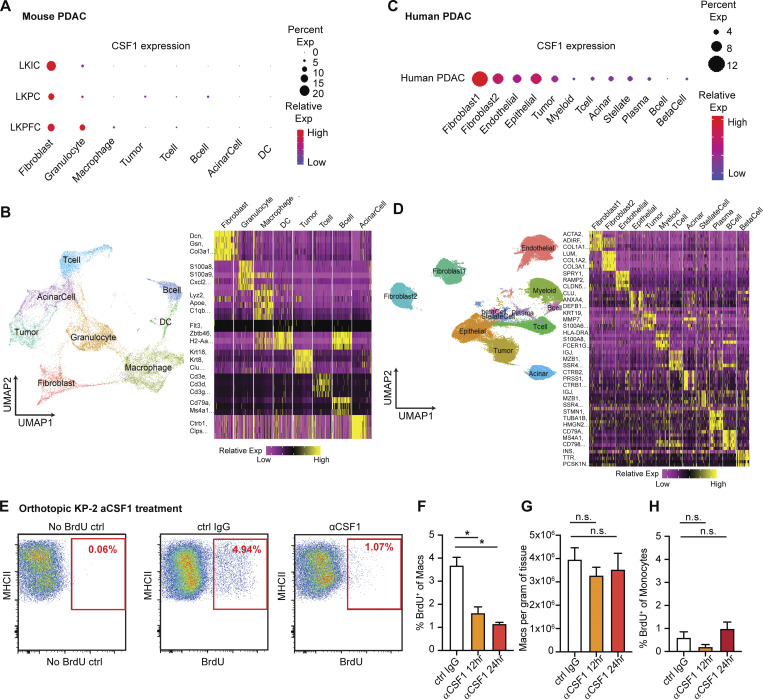
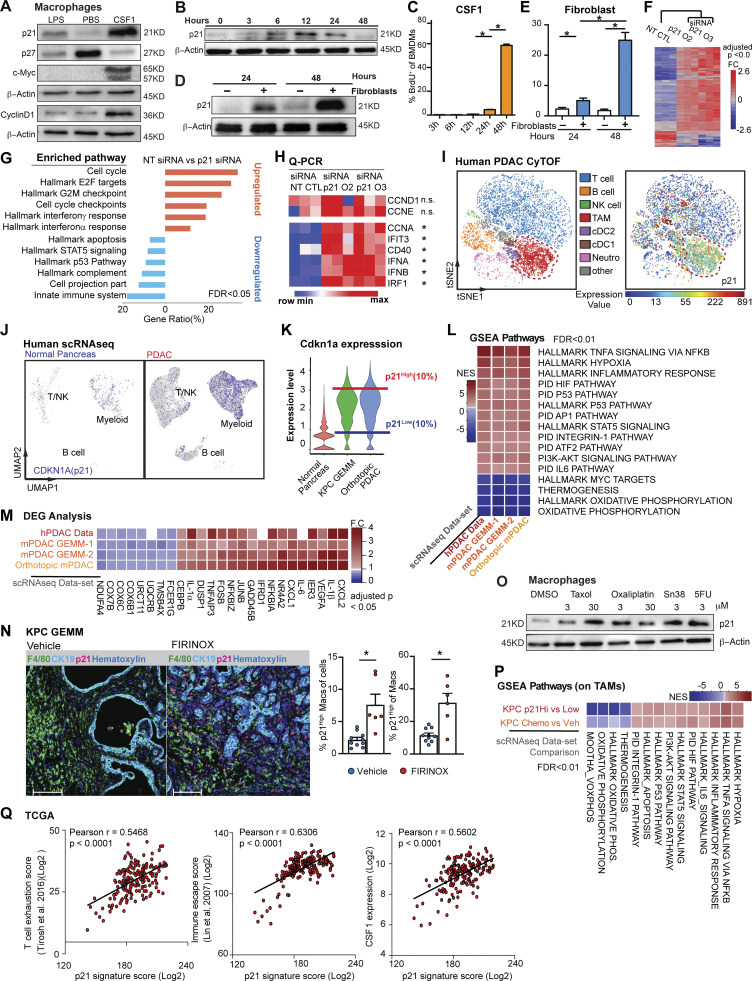
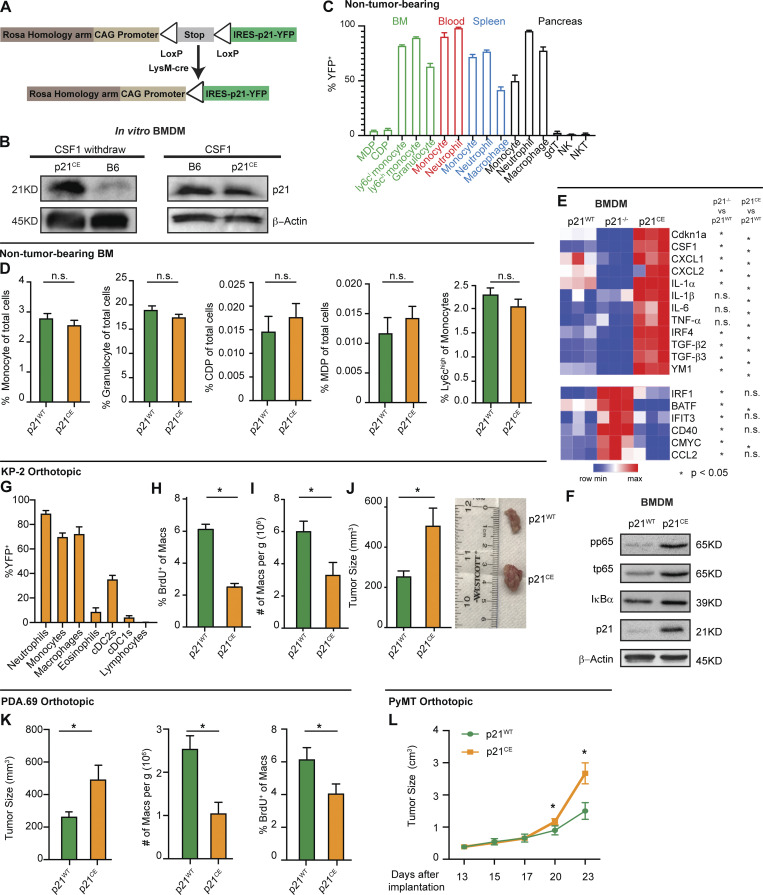
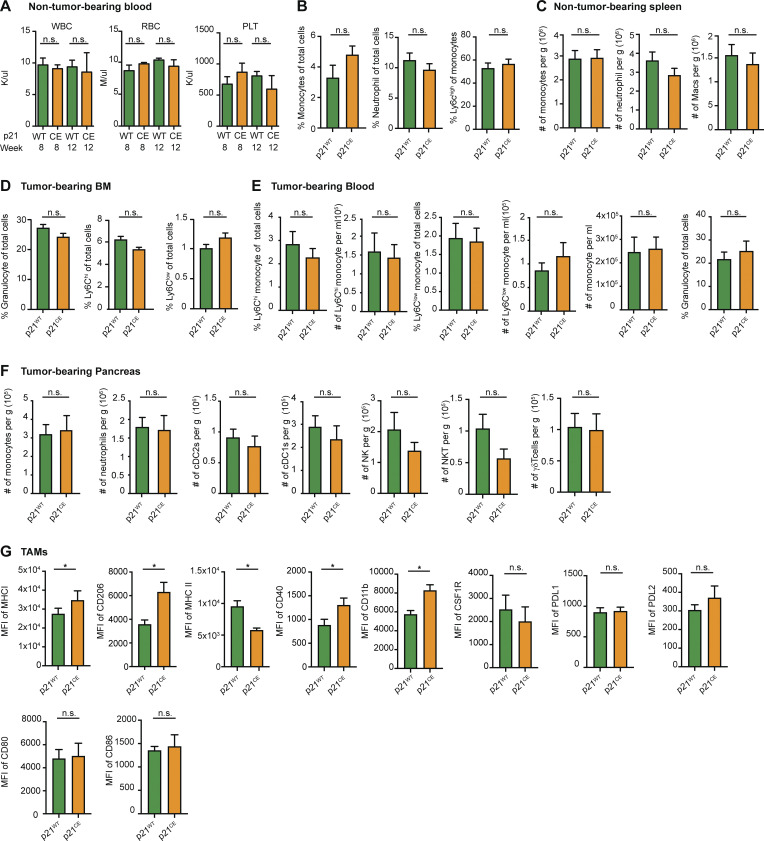
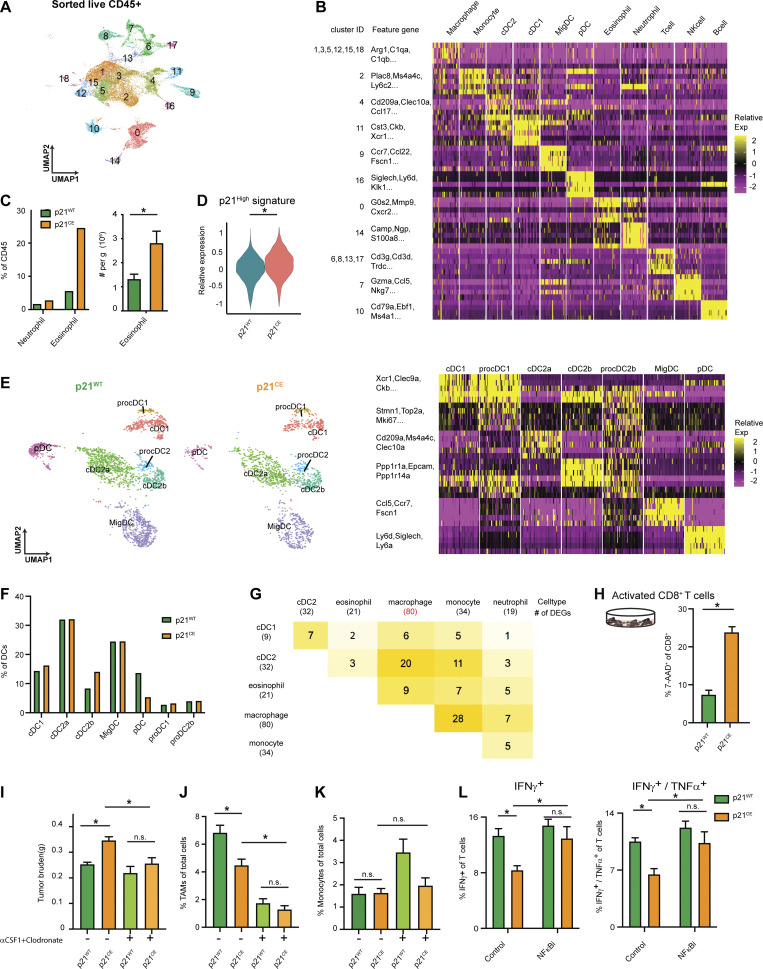
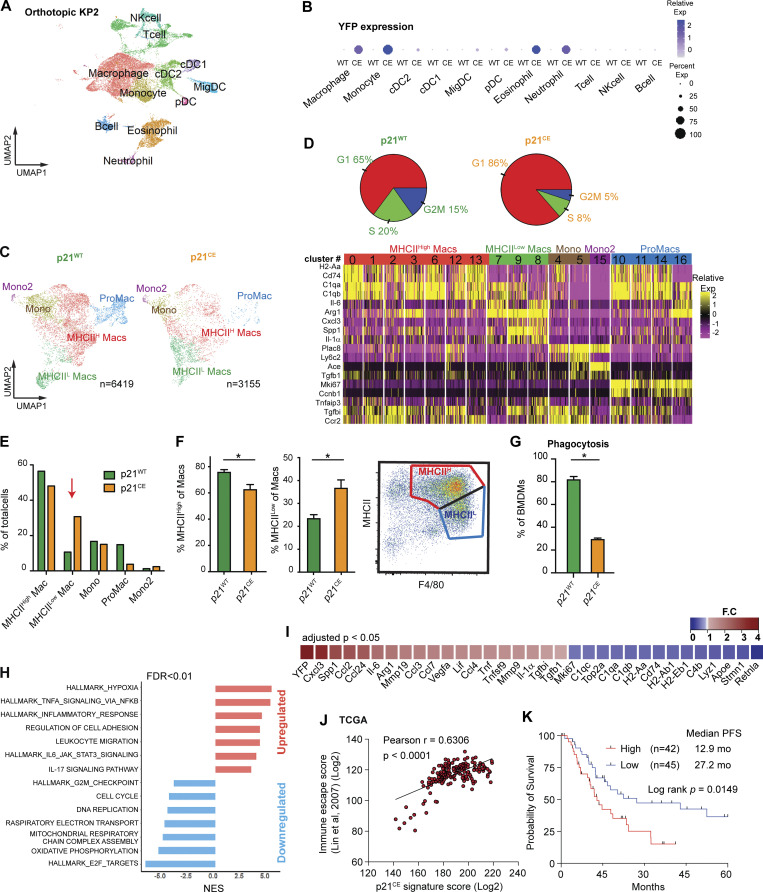
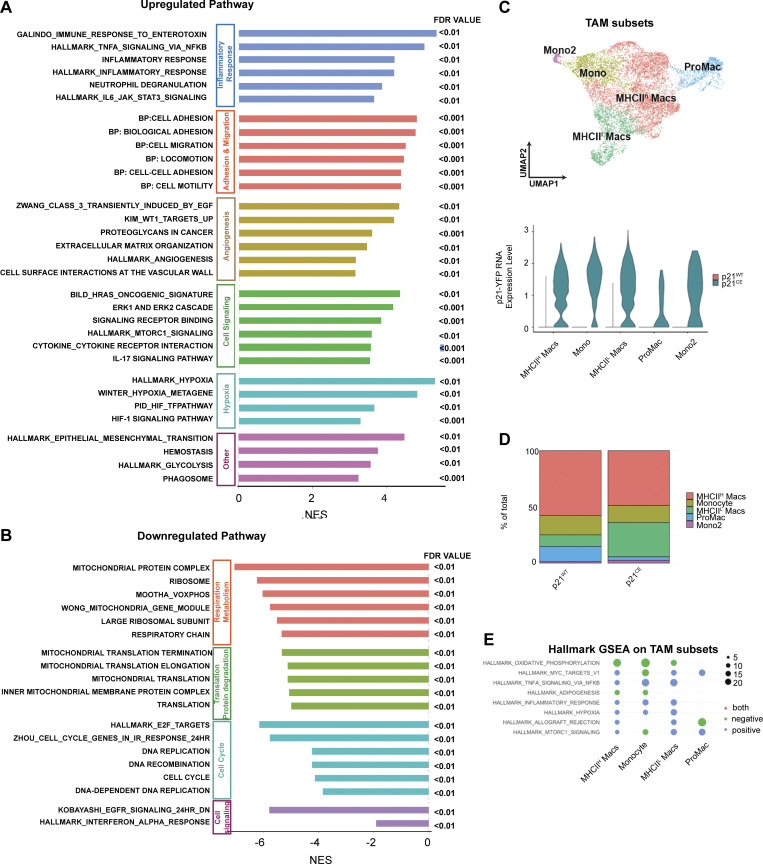
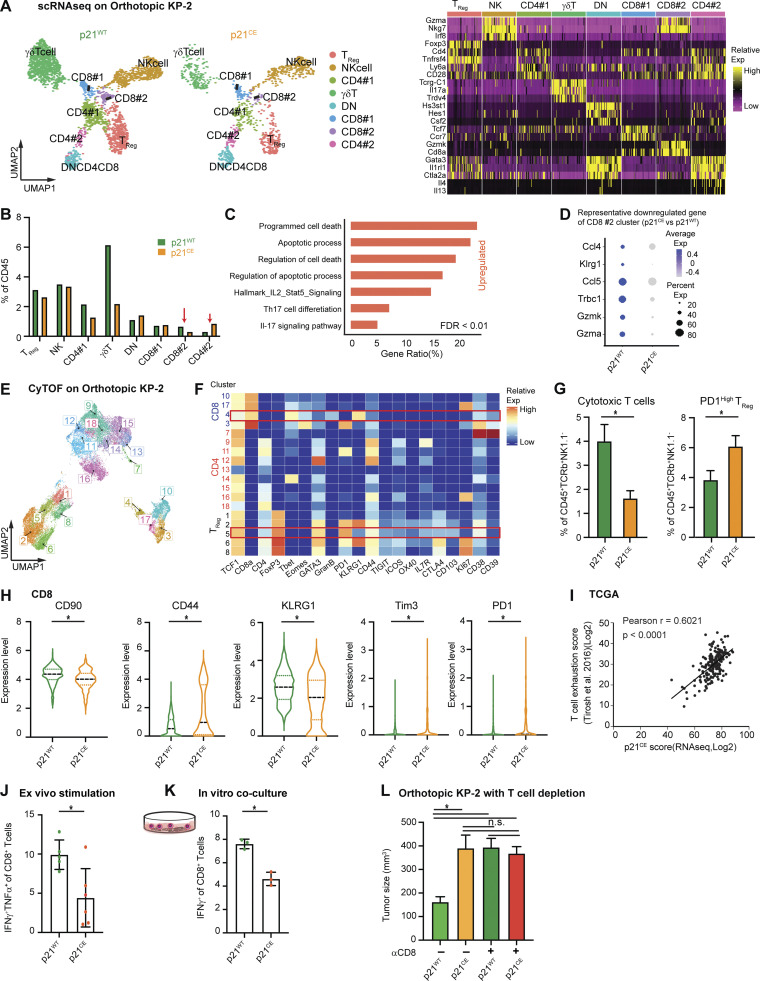
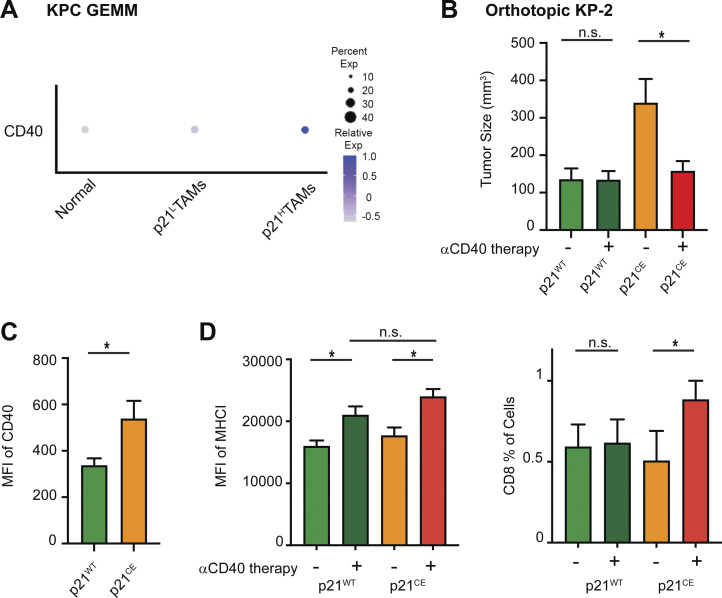
Tumor-associated macrophages (TAMs) are abundant in pancreatic ductal adenocarcinomas (PDACs). While TAMs are known to proliferate in cancer tissues, the impact of this on macrophage phenotype and disease progression is poorly understood. We showed that in PDAC, proliferation of TAMs could be driven by colony stimulating factor-1 (CSF1) produced by cancer-associated fibroblasts. CSF1 induced high levels of p21 in macrophages, which regulated both TAM proliferation and phenotype. TAMs in human and mouse PDACs with high levels of p21 had more inflammatory and immunosuppressive phenotypes. p21 expression in TAMs was induced by both stromal interaction and/or chemotherapy treatment. Finally, by modeling p21 expression levels in TAMs, we found that p21-driven macrophage immunosuppression in vivo drove tumor progression. Serendipitously, the same p21-driven pathways that drive tumor progression also drove response to CD40 agonist. These data suggest that stromal or therapy-induced regulation of cell cycle machinery can regulate both macrophage-mediated immune suppression and susceptibility to innate immunotherapy.


Conflict of interest statement

Disclosures: J.M. Baer reported grants from the National Institutes of Health during the conduct of the study. No other disclosures were reported.

Figures

None
Graphical abstract
Figure 1.
Figure 1.
PDAC-infiltrating macrophages are highly proliferative. (A) Representative immunohistochemistry (IHC) analyses of CD68+ macrophages and CK19+ tumor cells in the late stage of PDAC tissues and adjacent normal tissues from human patients. Scale bars, 100 µm. (B) Representative IHC analyses of F4/80+ macrophage and CK19+ tumor cells in normal pancreas, pancreatic tissues from early, mid, and late stages of KPC GEMMs. Scale bars, 500 µm. (C) Quantification of F4/80+ cells per millimeter of measured tissue area in B; n = 6–8 mice/group, two independent experiments. (D) Representative t-SNE plots of total normalized CD45+ cells from a PDAC patient, annotated with manually assigned cell identity. The macrophage cluster was marked with a red circle, and expressions of PCNA and Ki67 were explicitly displayed. (E and F) Dot plot displaying quantification of TAMs, Ki67+ TAMs, and Ki67+ neutrophils across nine human PDAC patients. (G and H) Representative mpIHC displaying F4/80+ macrophages, CK19+ tumor cells, and Ki67+ proliferating cells in tumors from KPC GEMMs with quantification of Ki67+ macrophages; n = 6 mice, two independent experiments. Scale bars, 100 µm. (I and J) Quantification of total TAMs as per gram of tumor and percentage of cells, and BrdU incorporation of TAMs in orthotopic tumors from two PDAC cell lines. n = 6–8 mice. Data were consistent in at least four independent repeats for KP-2 and two independent repeats for PDA.69. (K) UMAP of realigned and reprocessed publicly available human PDAC dataset (Peng et al., 2019), displaying major CD45+ clusters and a heat map showing key gene expressions for each cluster. n = 21 PDAC samples, n = 6 normal samples. (L) UMAP plots displaying normalized expression levels of MKI67 across subpopulations with red arrow pointing to MKI67 expressing myeloid cells. (M and N) UMAP displaying proliferating macrophages and non-proliferating macrophage clusters across the mouse scRNAseq dataset with quantification in N. Data are presented as the mean ± SEM. *, P < 0.05. For comparisons between any two groups, Student’s two-tailed t test was used.
Figure S1.
Figure S1.
Tumor-infiltrating macrophages are highly proliferative in PDAC. (A) Representative t-SNE plots of CyTOF analysis of human PDAC samples, displaying markers used for identifying major cell types, CD56+ for natural killer cells, CD19+CD3+ for T cells, CD16+ for neutrophils, CD68+CD64+CD14+ for macrophages, CD1c+ for cDC2, and CD141+ for cDC1 cells; n = 9 PDAC patients. (B) Representative Ki67+ gating in macrophage and neutrophil clusters. (C) Bar graph displaying percentage of Ki67+ cells in TAMs, monocytes, neutrophils, and eosinophils from B6 mice bearing orthotopic KPC tumor. (D) Representative flow cytometry plots showing the gating strategy to identify macrophages, monocytes, neutrophils, and eosinophil in orthotopic KP-2, KPC tumors. (E) Schematic of the scRNAseq analysis pipeline. Details of each step for the specific dataset are listed in the Materials and methods. (F) UMAP dimensionality reduction plot of integrated sorted CD45+ cells from the murine normal pancreas and pancreatic tissues from KPC PDACs and KP-2 orthotopic PDACs with cell type annotations and cell cycle regression. (G) UMAP plot of reclustered macrophages/monocytes in F without cell cycle regression with a heat map displaying corresponding gene signatures.
Figure 2.
Figure 2.
Fibroblasts drive macrophage proliferation through CSF1. (A) Representative mpIHC image of KPC mouse PDACs displaying αSMA+ (white) fibroblasts, CK19+ (teal) tumor cells, and F4/80+ (green) macrophages. Scale bars, 100 µm. (B) Frequency distribution of Pdpn+ fibroblasts (blue curve) and CK19+ tumor cells (green curve) to a nearest F4/80+ macrophage. n = 6 KPC mice. (C) The BrdU incorporation and number of BMDMs in co-culture with KP-1, KP-2, fibroblasts, or the combination for 48 h, BrdU pulsed for the last 6 h; n = 6. (D) The BrdU incorporation of BMDMs when cultured with fibroblasts in a transwell assay or 10 ng/ml of CSF1 for 48 h, and BrdU pulsed for the last 6 h; n = 3. (E) Representative image of a cytokine antibody array resulting from fibroblast- and KP-2–conditioned media, highlighting the top 10 highly expressed cytokines in fibroblast-conditioned medium and the corresponding mean pixel densities. The arrays were repeated two times. (F) Bar graph shows the concentrations of CSF1 from three tumor-conditioned media (KP-1, KP-2, and KI) and fibroblast-conditioned medium measured by an ELISA. (G) BrdU incorporation of BMDMs in co-culture with fibroblasts treated with 2 µg of aCSF1 or 2 µg of aIgG for 24 h, and BrdU pulsed for the last 6 h; n = 3. (H and I) BrdU incorporation and number of BMDMs in transwell cultures with fibroblasts with or without siRNA knockdown for CSF1; n = 3. Data are presented as the mean ± SEM. *, P < 0.05. All in vitro assay data are representative of two to three agreeing independent repeats. For comparisons between any two groups, Student’s two-tailed t test was used. Frequency distributions were compared using the nonparametric Kolmogorov–Smirnov test.
Figure S2.
Figure S2.
The p21-expressing TAMs have a distinct phenotype, and p21 expression could be induced by chemotherapy. (A) Dot plot displaying the percentage of Ki67+ BMDMs after CSF1 or LPS treatment for 24 h; n = 3/group. (B) Immunoblot showing expression of p21 in BMDMs after treatment with non-targeting siRNA or siRNA targeting for p21 in the presence of CSF1 for 24 h. Experiments were repeated in more than three independent repeats, and included tumor-conditioned medium treatment or were cultured with fibroblasts in the transwell assays. (C) Bar plot displaying quantification of BrdU+ BMDMs in B. The BrdU was pulsed for 20 h. The experiments were repeated three times with three different siRNA oligonucleotides. (D) Bar plot showing percentage of p21+ in different immune populations from human PDAC tumors identified in Fig. S1 A. (E) Representative image of mpIHC for F4/80+ macrophages, CK19+ tumor cells, and p21+ cells with quantification of p21+ macrophages from KPC PDACs; n = 8. (F) Dot plot showing Cdkn1a (p21) gene expressions in the normal pancreas and pancreatic tissues from EKIC, LKIC, LKPC, and LKPFC GEMMs (Hosein et al., 2019). (G) Bar plot showing the expression levels of p21 in Ki67+ and Ki67 TAMs identified in Fig. S1 B; n = 9. (H) Violin plot of the expressions of p21 and Ccnb1 in non-proliferating and proliferating macrophages in the mouse scRNAseq dataset from the KPC, orthotopic KP-2, and normal pancreas in Fig. 1 M. (I) UMAP displaying p21High and p21Low macrophages in KPC PDAC tumors and orthotopic KP-2 tumors. (J) Representative mpIHC images of KPC mouse PDACs displaying p21, CK19, F4/80, and Pdpn staining; n = 8. Scale bars, 100 µm. (K) Violin plot displaying the expressions of p21High signature scores, identified in Fig. 4 M, in TAMs from KPC mice 24 h after GEM/PTX or dimethyl sulfoxide treatment. (L) Bar plot showing percentage of p21High TAMs in KPC GEMM PDAC after DMSO or GEM/PTX treatments. (M) Immunoblot showing expression of p21 in BMDMs in the transwell assay with fibroblast with or without addition of αCSF1 for 24 h. All graphs are expressed as the mean ± SEM. *, P < 0.05. All in vitro assays were consistent across more than two independent repeats. For comparisons between any two groups, Student’s two-tailed t test was used, except for K where the Bonferroni-corrected adjusted P value was used. Source data are available for this figure: SourceData FS2.
Figure 3.
Figure 3.
CAFs drive tumor associated macrophage proliferation through CSF1. (A) Dot plot summarizing CSF1 expressions in different cell types across three mouse PDAC models from the publicly available scRNAseq dataset (Hosein et al., 2019). (B) UMAP dimensionality reduction plot of integrated cells from LKIC, LKP R172H/+C, and LKPFC GEMMs in scRNAseq dataset used in A, annotated with different cell types. Data were filtered and reprocessed as described in the Materials and methods. (C) Dot plot displaying CSF1 expressions in different cell types across 21 human PDAC patient samples from the publicly available scRNAseq dataset (Peng et al., 2019). (D) UMAP dimensionality reduction plot of integrated cells from 21 pancreatic adenocarcinoma patients used in C, annotated with different cell types. (E–H) Representative flow cytometry plot and quantification bar plot showing BrdU+ macrophages and monocytes, and total number of macrophages following αIgG control or αCSF1 injections; n = 6–8 mice per group. Data are presented as the mean ± SEM. *, P < 0.05. For comparisons between any two groups, Student’s two-tailed t test was used.
Figure 4.
Figure 4.
The p21 cell cycle–dependent kinase inhibitor is induced by CSF1 and regulates the macrophage phenotype. (A) Immunoblots of p21, p27, c-Myc, and cyclinD1 in BMDMs after treatment with 100 ng/ml of LPS or CSF1 for 24 h. The experiments were repeated three times. (B and C) Immunoblot displaying p21 expression in BMDMs following 4 ng/ml CSF1 treatment at time 0 with quantification of BrdU+ BMDMs shown in C. BrdU was added at time 0 and pulsed until harvest. BMDMs were starved without CSF1 overnight. (D) Immunoblot displaying p21 expression in BMDMs combined with fibroblasts in transwell assays at time 0. BMDMs were starved without CSF1 overnight. (E) Bar plot displaying the quantification of BrdU+ BMDMs in a transwell assay, as in D. (F) Heat map displaying the microarray analysis of DEGs between non-target siRNA–treated or siRNA targeting for p21–treated BMDMs cultured in tumor-conditioned medium for 24 h; n = 3 per group. Genes were filtered with adjusted P < 0.05 and fold-change > or <1.5. (G) Bar graph displaying top overrepresentation analysis of DEGs in F to known biological functions (GO, KEGG, Reactome, and MSigDB) with an FDR < 0.05. (H) Heat map displaying qPCR analysis of gene expressions of cell cycle and IFN-related genes between non-target siRNA–treated or siRNA targeting for p21–treated BMDMs cultured in tumor-conditioned medium for 24 h; fold-change >1.5, n = 3/group of the comparison. (I) Representative t-SNE plot displaying major cell types from CyTOF analysis of a human PDAC patient (same as in Fig. 1 D) with macrophages circled in red and p21 expression. (J) UMAP displaying CDKN1A gene expression in CD45+ cells from the human PDAC scRNAseq dataset (Peng et al., 2019) with annotation of key cell types. (K) Violin plot showing the expression levels for p21 gene in macrophage clusters from integrated scRNAseq analyses of the mouse normal pancreas and pancreatic tissue from KPC GEMMs and orthotopic KP-2 tumor-bearing mice. Representative lines were drawn for two groups of stratified macrophages based on the top 10% of p21 expression and bottom 10% of p21 expression. (L) Heat map of net enrichment score (NES) of shared enriched pathways identified by GSEA analysis comparing the two groups of macrophages (p21High vs. p21Low) in human PDAC scRNAseq dataset (Peng et al., 2019), KPC GEMMs (Hosein et al., 2019) and orthotopic scRNAseq data. Enriched pathways were selected by FDR < 0.01. (M) Heat map displaying the shared DEGs when comparing p21High to p21Low TAMs in each dataset with adjusted P < 0.05 and fold-change >1.2 or <0.8. p21High signature score was created utilizing filtered DEGs with fold-change >1.5 across three mouse scRNAseq datasets. (N) Representative mpIHC image displaying F4/80+ TAMs, CK19+ tumor cells, and p21+ cells in KPC GEMM treated with dimethyl sulfoxide or FIRINOX (i.v; 50 mg/kg 5-FU, 25 mg/kg irinotecan, 6.6 mg/kg oxaliplatin) for 24 h with quantification of p21+ TAMs as total cells and total TAMs on the right. Scale bars, 100 µm. (O) Immunoblots showing expressions of p21 in wild-type BMDMs after chemotherapeutics treatment for 24 h. (P) Heat map of NES of shared enriched pathways identified by GSEA analysis in comparing p21High to p21Low TAMs in KPC GEMM PDAC and in comparing chemotherapeutic-treated KPC GEMM PDAC to DMSO-treated KPC GEMM PDAC with FDR < 0.05. (Q) Correlation plots with Pearson coefficients (r) of p21 signature score vs. T cell exhaustion score (Tirosh et al., 2016), immune escape score (Lin et al., 2007), and CSF1 expression from TCGA PDAC PanCancer Atlas study (n = 180). All graphs are expressed as the mean ± SEM. *, P < 0.05. All in vitro assays and immunoblots are representative of two to three agreeing independent repeats unless otherwise specified. For comparisons between any two groups, Student’s two-tailed t-test was used, except for F and M where the Bonferroni correction was used and for L and P where the FDR was used. Source data are available for this figure: SourceData F4.
Figure 5.
Figure 5.
Expression of p21 drives tumor-promoting phenotypes in macrophages. (A) Genetic loci for the p21CE model. (B) Immunoblot for p21 expression in p21CE or B6-derived BMDMs with or without 10 ng/ml of CSF1 treatment for 24 h. Experiments were consistent in at least three independent repeats. (C) Bar plot displaying the percentage of YFP+ cells in non-tumor-bearing p21CE mice; n = 4. (D) Bar plot showing flow cytometry quantification of cellular composition in non-tumor-bearing bone marrow from p21CE and p21WT mice; n = 6–9 mice/group. Data were consistent in two independent repeats. (E) Heat map displaying gene expression analysis of BMDMs derived from non-tumor-bearing p21WT, p21−/−, and p21CE mice treated with 10 ng/ml of CSF1 for 24 h, by RT-qPCR; n = 3/group. Data was consistent from three independent repeats. (F) Immunoblots for phos-p65, total p65, IκB, and p21 expression in p21CE or p21WT BMDMs after withdrawing CSF1 overnight. Data were consistent in four independent repeats. (G) Flow cytometry quantification of YFP+ cells in p21CE mice bearing orthotopic KP-2 tumors; n = 6–7 mice. (H and I) Quantification of BrdU+ macrophages and density of macrophages in tumors of p21CE and p21WT mice; n = 6–7 mice/group. Data were pooled across multiple independent experiments. (J) Bar plot displaying the tumor sizes in p21CE and p21WT mice, 21–27 d following orthotopic implantation of KP-2 tumor cells; n = 8–10 mice/group. Data were pooled from multiple independent experiments. (K) Bar plot displaying tumor sizes, density of macrophages, and quantification of BrdU+ macrophages from p21CE and p21WT mice, 21–23 d after the orthotopic implantation of the PDA.69 cell line; n = 8–10 mice/group. Data were pooled from multiple agreeing and independent experiments. (L) Caliper measurement of orthotopic PyMT in p21WT and p21CE mice; n = 6–8 mice/group. All graphs are expressed as the mean ± SEM. *, P < 0.05. All in vitro assays are representative of two to three agreeing independent repeats unless otherwise specified. For comparisons between any two groups, Student’s two-tailed t test was used. Source data are available for this figure: SourceData F5.
Figure S3.
Figure S3.
Immune compositions in non-tumor- and tumor-bearing p21CE and p21WT mice. (A) Quantification of white blood cells, red blood cells, and platelets in non-tumor-bearing p21WT and p21CE mice at weeks 8 and 12; n = 3–4 mice/group. (B) Flow cytometry quantification of total monocytes, neutrophils, and Ly6Chi monocytes in blood of non-tumor-bearing p21WT and p21CE mice; n = 7–9 mice/group. (C) Flow cytometry quantification of monocytes, neutrophils, and macrophages in the spleens of 8–12 wk p21WT and p21CE non-tumor-bearing mice; n = 7–9 mice/group. (D and E) Flow cytometry quantification of myeloid cells in bone marrow and blood of tumor-bearing p21CE and p21WT mice; n = 6 mice/group. (F) Flow cytometry analyses of the number of monocytes, neutrophils, cDC2s, cDC1s, NK cells, NKT cells, and γδT cells in the pancreas of p21CE and p21WT mice bearing orthotopic KP-2 tumors; n = 6 mice/group. (G) Bar graphs showing the MFI of MHCI, CD206, MHCII, CD40, CD11b, CSF1R, PDL1, PDL2, CD80, CD86 in TAMs from p21WT and p21CE mice bearing orthotopic KP-2 tumors. Data were pooled from multiple independent experiments. n = 6 mice/group. All graphs are expressed as the mean ± SEM. *, P < 0.05. For comparisons between any two groups, the Student’s two-tailed t test was used.
Figure S4.
Figure S4.
scRNAseq analyses on tumor-bearing p21CE and p21WT mice and ex vivo T cell assays. (A) UMAP plot of all sorted CD45+ cell clusters on merged objects from p21CE and p21WT KP-2 orthotopic tumor–bearing mice. Three mice were pooled for each genotype. (B) Heat map listing all clusters in A and corresponding cell type annotations and key gene expressions. (C) Bar plot displaying the percentages of neutrophils and eosinophils in p21WT and p21CE tumor-bearing mice from single cell analysis and number of eosinophils per gram of pancreas from flow cytometry analyses. (D) Violin plot displaying the expression levels of p21High signature scores, identified in Fig. 4 M, in TAMs from p21CE and p21WT mice. *, Wilcox-adjusted P value < 0.05. (E) UMAP plot of the reclustered DC populations in Fig. 6 A, annotated with cell type and associated key gene expressions in the heat map (right). (F) Quantification of major DC populations identified in E from p21CE tumors when compared with p21WT tumors. (G) Heat map showing the number of shared DEGs between two genotypes in each cell population, including macrophage and close lineages. The number of DEGs for each single-cell population when comparing p21CE to p21WT was listed in the parenthesis below. (H) Bar plot displaying the percentage of 7-AAD+CD8+ T cells activated with CD3/CD28 Dynabeads (Gibco) when cocultured with BMDMs from p21CE and p21WT mice for 48 h. Data were consistent in three independent repeats. (I–K) Bar plot showing the tumor burden, percentages of TAMs and monocytes in p21WT and p21CE mice bearing orthotopic KP-2 tumors with or without CSF1 and clodronate treatment; n = 8–10 mice/group. (L) Bar plot displaying the mean percentage of IFNγ+ and IFNγ+TNF-α+ CD8 T cells in culture with BMDMs from p21CE and p21WT mice for 5 h with or without pre-exposure to NF-κB inhibitor. *, P < 0.05. For comparisons between any two groups, the Student’s two-tailed t test was used. All in vitro assays are representative of two to three agreeing independent repeats.
Figure 6.
Figure 6.
p21 expression in macrophages led to an inflammatory but immunosuppressive phenotype. (A) UMAP dimensionality reduction plot of total CD45+ cells from p21WT and p21CE mice bearing orthotopic KP-2 tumors. Cells in each genotype were pooled from three mice and created as two libraries. Clusters were annotated with corresponding cell types. (B) Dot plot displaying YFP expression in each cell type between the two groups. The legend shows the dot size and corresponding percentage that are expressed as a color gradient of normalized expressions. (C) Reclustered UMAP plot of macrophage and monocyte clusters in A without cell cycle regression and split into p21WT and p21CE and annotated with major subpopulations. On the right, heat map showing key gene expressions in each subpopulation in C. (D) Pie chart showing cell cycle analysis of macrophages (MHCIIhi, MHCIIlow, and ProMac) in tumors from p21WT and p21CE mice. (E) Bar plot showing quantification of each population between p21WT and p21CE mice identified in C. (F) Quantification of flow cytometry analysis of the percentages of MHCIIhi and MHCIIlow macrophages from p21CE and p21WT mice bearing orthotopic KP-2 tumors with the representative gating strategy; n = 6–10 mice/group. Data were consistent in four independent repeats. (G) Bar plot displaying quantification of fluorescent-bead+ BMDMs from p21WT and p21CE mice. Data were consistent in three independent repeats. (H) Bar plot displaying GSEA results of comparing TAMs from p21CE to p21WT mice. The key upregulated and downregulated pathways are shown with FDR <0.01. (I) Heat map showing the key DEGs comparing TAMs from p21CE and p21WT mice. DEGs were filtered with an adjusted P < 0.05 and fold-change >1.3 or <0.75. All gene expressions were normalized by SCTransform. (J) Correlation plots with Pearson coefficients (r) of p21CE signature score (included genes with logFC > 0.75) vs. immune escape score from TCGA PDAC PanCancer Atlas study (n = 180). (K) Kaplan–Meier survival analysis of PDA patients from TCGA whose samples were stratified by expression of the p21CE signature (logFC > 0.75) by quartiles. All graphs are expressed as the mean ± SEM. *, P < 0.05 using the t test, except for I where the Bonferroni-corrected adjusted P value was used.
Figure S5.
Figure S5.
GSEA analyses of comparing p21CE and p21WT TAMs. (A and B) Bar plot showing significantly upregulated and downregulated pathways identified by GSEA in TAMs from p21CE compared with p21WT mice. The pathways were grouped into biological functions with FDR <0.01. (C) UMAP of reclustered macrophage and monocyte clusters from Fig. 6 C and annotated with major subpopulations. Violin plot showing the expression of p21-YFP construct in each cluster. (D) Bar plot showing the composition of each subpopulation as of total macrophages/monocytes from p21CE and p21WT mice. (E) Dot plot showing the result from GSEA when comparing each cluster of cells from p21CE to p21WT counterpart; dot size represents gene ratio, and color represents either positive or negative enrichment.
Figure 7.
Figure 7.
p21 expression in macrophages impaired effector T cells. (A) UMAP dimensionality reduction plot of selected lymphocytes (clusters 6, 7, 8, 13, and 17 in Fig. S4, A and B) from p21WT and p21CE orthotopic KP-2 tumors. Clusters were annotated with corresponding cell types and heat maps displaying selected gene expressions in each cell type. (B) Bar graph displaying the composition of each cell type as the percentage of total CD45+ cells in p21WT and p21CE tumor-bearing mice. CD8#2 and CD4#2 are highlighted with red arrows. (C) Bar graph displaying the upregulated pathways in the CD8#2 cluster from p21CE using overrepresentation analysis of DEGs to known biological functions (GO, KEGG, Reactome, and the MSigDB). DEGs were filtered with a value of P < 0.05, fold-change >1.2, and past MAST test. (D) Table showing the DEGs comparing CD8#2 cluster from p21CE to p21WT with P value <0.05. (E) UMAP plot of selected CD45+TCRβ+CD90+NK1.1TCRγδT cells from p21CE and p21WT orthotopic KP-2 tumors with clusters annotated; n = 7 mice/group. (F) Heat map displaying the feature expressions in each cluster. Cytotoxic T cells (cluster 4) and PD1High Treg (cluster 5) were highlighted. (G) Bar plot showing the percentages of cytotoxic T cells and PD1High Treg in p21WT and p21CE tumors. (H) Violin plot visualizing the expression levels of CD90, CD44, KLRG1, TIM3, and PD1 in the CD8 cluster between tumors from two genotypes. (I) Correlation plots with Pearson coefficients (r) of p21CE score vs. T cell exhaustion score from TCGA PDAC PanCancer Atlas study (n = 180). (J) Bar graph displaying the percentage of IFNγTNFα+ effector CD8 T cells as total CD8 in p21WT and p21CE tumors; n = 5–6 mice/group, two independent experiments. (K) Bar graph displaying the percentage of IFNγ+ activated CD8 T cells when co-cultured with BMDMs from p21WT and p21CE mice; n = 3, three independent experiments. (L) Bar graphs showing the tumor burden between p21WT and p21CE orthotopic KP-2 tumors after αCD8 treatment; n = 6–8 mice/group, two agreeing independent experiments. All graphs are expressed as the mean ± SEM. *, P < 0.05; for comparisons between two groups (G and I–L), Student’s two-tailed t test was used. For comparisons in H, the Bonferroni-corrected P value was used.
Figure 8.
Figure 8.
p21 expression in macrophages sensitizes tumors for innate immunotherapy. (A) Dot plot showing average expression of CD40 in macrophages from normal pancreas and in TAMs from KPC tumors. Dot size representing the percent of cells expressing CD40. (B) Bar graph showing the tumor burdens of p21WT and p21CE mice bearing orthotopic KP-2 tumors with or without CD40 agonist (100 μg) and gemcitabine (75 mg/kg) treatment. n = 6–8 mice/group. Data were consistent in two independent repeats. (C) Bar graph showing the mean fluorescent intensity (MFI) of CD40 in TAMs from p21WT and p21CE mice bearing orthotopic KP-2 tumors. (D) Bar graphs showing the MFI of MHCI in TAMs and the percentage of CD8 as of total cells from p21WT and p21CE mice bearing orthotopic KP-2 tumors. All graphs are expressed as the mean ± SEM. *, P < 0.05 for comparisons between two groups; Student’s two-tailed t test was used.

References

    1. Abram, C.L., Roberge G.L., Hu Y., and Lowell C.A.. 2014. Comparative analysis of the efficiency and specificity of myeloid-Cre deleting strains using ROSA-EYFP reporter mice. J. Immunol. Methods. 408:89–100. 10.1016/j.jim.2014.05.009 - DOI - PMC - PubMed
    1. Amano, S.U., Cohen J.L., Vangala P., Tencerova M., Nicoloro S.M., Yawe J.C., Shen Y., Czech M.P., and Aouadi M.. 2014. Local proliferation of macrophages contributes to obesity-associated adipose tissue inflammation. Cell Metab. 19:162–171. 10.1016/j.cmet.2013.11.017 - DOI - PMC - PubMed
    1. Balkwill, F. 2006. TNF-alpha in promotion and progression of cancer. Cancer Metastasis Rev. 25:409–416. 10.1007/s10555-006-9005-3 - DOI - PubMed
    1. Borgoni, S., Iannello A., Cutrupi S., Allavena P., D’Incalci M., Novelli F., and Cappello P.. 2017. Depletion of tumor-associated macrophages switches the epigenetic profile of pancreatic cancer infiltrating T cells and restores their anti-tumor phenotype. OncoImmunology. 7:e1393596. 10.1080/2162402X.2017.1393596 - DOI - PMC - PubMed
    1. Bottazzi, B., Erba E., Nobili N., Fazioli F., Rambaldi A., and Mantovani A.. 1990. A paracrine circuit in the regulation of the proliferation of macrophages infiltrating murine sarcomas. J. Immunol. 144:2409–2412. 10.4049/jimmunol.144.6.2409 - DOI - PubMed

Publication types