. 2023 Mar;9(3):mgen000959.
doi: 10.1099/mgen.0.000959.

Global population structure, genomic diversity and carbohydrate fermentation characteristics of clonal complex 119 (CC119), an understudied Shiga toxin-producing E. coli (STEC) lineage including O165:H25 and O172:H25

Affiliations

Global population structure, genomic diversity and carbohydrate fermentation characteristics of clonal complex 119 (CC119), an understudied Shiga toxin-producing E. coli (STEC) lineage including O165:H25 and O172:H25

Keiji Nakamura et al. Microb Genom. 2023 Mar.

Abstract

Among Shiga toxin (Stx)-producing Escherichia coli (STEC) strains of various serotypes, O157:H7 and five major non-O157 STEC (O26:H11, O111:H8, O103:H2, O121:H19 and O145:H28) can be selectively isolated by using tellurite-containing media. While human infections by O165:H25 STEC strains have been reported worldwide, their detection and isolation are not easy, as they are not resistant to tellurite. Systematic whole-genome sequencing (WGS) analyses have not yet been conducted. Here, we defined O165:H25 strains and their close relatives, including O172:H25 strains, as clonal complex 119 (CC119) and performed a global WGS analysis of the major lineage of CC119, called CC119 sensu stricto (CC119ss), by using 202 CC119ss strains, including 90 strains sequenced in this study. Detailed comparisons of 13 closed genomes, including 7 obtained in this study, and systematic analyses of Stx phage genomes in 50 strains covering the entire CC119ss lineage, were also conducted. These analyses revealed that the Stx2a phage, the locus of enterocyte effacement (LEE) encoding a type III secretion system (T3SS), many prophages encoding T3SS effectors, and the virulence plasmid were acquired by the common ancestor of CC119ss and have been stably maintained in this lineage, while unusual exchanges of Stx1a and Stx2c phages were found at a single integration site. Although the genome sequences of Stx2a phages were highly conserved, CC119ss strains exhibited notable variation in Stx2 production levels. Further analyses revealed the lack of SpLE1-like elements carrying the tellurite resistance genes in CC119ss and defects in rhamnose, sucrose, salicin and dulcitol fermentation. The genetic backgrounds underlying these defects were also clarified.

Keywords: O165:H25; O172:H25; Shiga toxin-producing Escherichia coli; carbohydrate fermentation; comparative genomics; phylogenetic analysis.


Conflict of interest statement

The authors declare that there are no conflicts of interest.

Figures
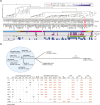
Fig. 1.
Fig. 1.
Phylogenetic position of CC119 in E. coli and STEC-related gene profiles of CC119 strains. (a) A core gene-based maximum-likelihood (ML) tree of 104 chromosome-closed E. coli strains with an Escherichia cryptic clade I strain (TW10509; AEKA00000000) as an outgroup is shown along with the names and serotypes of each strain. The tree was constructed based on the 100 652 SNPs identified in 2647 core genes. The phylogroups, the alignment coverages of the SpLE1 sequence of O157:H7 strain Sakai [10] and the presence (coloured) or absence (open) of the ter gene cluster and the eae, stx1 and stx2 genes in each strain are also indicated. The percentage coverage (>99 % nucleotide sequence identity threshold) of the SpLE1 sequence is indicated by the colour gradient. The ter gene cluster, which comprises eight genes, was judged as ‘positive’ when seven or eight genes were detected. (b) An unrooted ML tree of CC119 strains, each representing 10 STs, is shown with an O177:H25 strain as an outlier. The tree was constructed based on the recombination-free SNPs (n=9,263) identified on the chromosomal backbone (3 864 656 bp). The strain names are displayed at each tip with their STs and serotypes. ST119 and its close relatives (defined as CC119ss in the main text) are indicated by a blue circle. In the lower panel, allele IDs for MLST and the prevalence of the stx1, stx2, eae, hlyA and ter genes in each ST are shown, along with that of the wild type (WT) or frameshift (FS) mutation-containing rhaR, cscB and cscK genes. A high prevalence (>80 %) is indicated by coloured characters. The presence/absence of ter genes was determined as described in (a). Bar, the mean number of nucleotide substitutions per site.
Fig. 2.
Fig. 2.
Phylogenetic relationships of 194 CC119ss strains. A maximum-likelihood (ML) tree constructed based on the recombination-free SNPs (n=8,471) identified on the chromosomal backbone (3 669 646 bp) is shown along with strain information on fastbaps clades; isolation countries and sources; and the presence/absence of stx1a, stx2a, stx2c, eae (subtype ε1) and hlyA genes. The positions of 13 genome-closed strains are indicated by IDs (A1–H3). Of the 13 strains, the 7 strains sequenced in this study are indicated in red. The presence and absence of the five genes are indicated by filled and open boxes, respectively. Bar, the mean number of nucleotide substitutions per site.
Fig. 3.
Fig. 3.
Comparison of the O-antigen biosynthesis gene clusters and their flanking regions between O165:H25 and O172:H25. Genetic organizations of the O-antigen biosynthesis gene cluster and its flanking regions in strains G1 and H1 representing each O-serotype are shown. The levels of nucleotide sequence identities between CDSs are indicated by coloured shading.
Fig. 4.
Fig. 4.
Conservation and variation of the prophages (PPs), integrative elements (IEs) and virulence plasmids in the 13 closed CC119ss genomes. In the upper panel, the positions of the 13 genome-closed strains are indicated in the maximum-likelihood (ML) tree (the same tree as in Fig. 2). In the lower panel, the chromosomal integration sites of PPs and IEs identified in the 13 genomes are shown on the PP-removed chromosome backbone of strain K-12 MG1655 (K-12∆PP; asterisks indicate tRNA genes) on the left-hand side, while the presence/absence of PP/IE at each site in each strain, the features of each PP, the types of integration sites, the length distributions and pairwise alignment coverage (with >99 % nucleotide sequence identity) of PPs/IEs integrated into each site are shown on the right-hand side. The latter two data are shown by box-and-whisker plots with the median (line in box), first and third qualities (edges of box), and 1.5× interquartile range (lines extending from edges of box). Outliers are indicated by black squares. The data for the virulence plasmid are also shown at the bottom. The highly degraded PP at icd of strain F1 (marked by a dagger; see Fig. S3 for its genome structure) is not indicated in the plot. Mu-like phages integrated into several PPs (indicated by section) were excluded from the analyses of PP lengths and pairwise alignment coverage. In the column ‘core/variable’, those containing PPs/IEs in >75 % strains are indicated by ‘core site’, and the remaining are indicated by ‘variable site’. The core sites are divided into three groups (core, core(d+) and core_v) according to the variations in lengths and genome sequences (see the main text for more details).
Fig. 5.
Fig. 5.
Distribution of major virulence-related genes in CC119ss strains. Along with the maximum-likelihood (ML) tree of the 194 CC119ss strains (the same tree in Fig. 2), the presence or absence of each subtype of stx (stx1a, stx2a, or stx2c), PP- and IE-encoded T3SS effector genes, and virulence plasmid-encoded virulence genes in each strain are shown. The PPs and IEs of strain A2 are indicated, as this strain contained the highest number of T3SS effector genes among the 13 genome-closed strains. Bar, the mean number of nucleotide substitutions per site.
Fig. 6.
Fig. 6.
Variation in the integration sites of Stx phages and the Stx2 production levels among CC119ss strains The maximum-likelihood (ML) phylogenetic tree of 50 CC119ss strains, which was constructed based on the recombination-free SNPs (5165 sites) identified on the conserved chromosome backbone (4 129 840 bp), is shown, along with the geographic and clade information concerning strains and the presence/absence, integration sites (coloured box in each prophage) and types (long- or short-tailed) of Stx prophages. The IDs of 13 genome-closed strains are also indicated. Strain 90–3040 (H2) contained two Stx2a phages at sapB and argW. In the right panel, the MMC-induced Stx2 production levels of each strain are shown as the mean values with standard deviations of biological triplicates. Note that the Stx2 production levels of six stx2-positive strains whose closed genome sequences were obtained from NCBI were not determined.
Fig. 7.
Fig. 7.
Rhamnose fermentation of CC119ss strains. (a) Comparison of the rha gene cluster in O165:H25 strain JNE072951, O26:H11 strain 11368 [4] and K-12. Homologous sequences (>95 % amino acid sequence identity) are depicted by shading. The positions and sequences of the regions containing frameshift mutations in the rhaR gene of strain JNE072951 and the rhaS gene of strain 11 368 are shown. (b) Rhamnose fermentation abilities of 10 CC119ss strains detected by the cell suspension spot assay. Bacterial cell suspensions (approximately 1×10⁶ c.f.u.) were spotted onto a rhamnose-containing MacConkey agar base and grown for 48 h at 37 °C. E. coli strain K-12 was used as a positive control, and O26:H11 strain 11 368 was used as a negative control. Along with the strain name, the intactness of the four rha genes in each strain is indicated (WT, wild type; FS, frameshift; Inf, in-frame insertion).
Fig. 8.
Fig. 8.
Sucrose fermentation of CC119ss strains. (a) The results for the spot assay on sucrose-containing MacConkey agar base are shown. The same assay as that in Fig. 7b was conducted, but O26:H11 strain 11 368 was used as a positive control and E. coli strain K-12 was used as a negative control. Along with the strain name, the intactness of the two csc genes and a fructokinase-encoding gene in each strain is indicated (WT, wild type; FS, frameshift). By picking red microcolonies in the spots of strains JNE102603 and JNE130574 and culturing them for 16 h on sucrose-containing MacConkey agar, sucrose-fermenting colonies were isolated and used in subsequent sequencing analysis. (b) The csc gene cluster and a fructokinase-encoding gene in O26:H11 strain 11368 [4] and the mutations found in CC119ss strains are shown. The positions of the insertions and deletions (InDels) in cscB and cscK, which were found in CC119ss strains, are indicated by an orange line. The sequences of the regions containing the InDels in the sucrose-fermenting colonies in (a) were compared with those of strain 11 368. The 1 bp deletion found in a single strain [not included in the strain set used in (a)] is indicated by an asterisk.

Similar articles

Cited by

References

    1. Scheutz F, Teel LD, Beutin L, Piérard D, Buvens G, et al. Multicenter evaluation of a sequence-based protocol for subtyping Shiga toxins and standardizing Stx nomenclature. J Clin Microbiol. 2012;50:2951–2963. doi: 10.1128/JCM.00860-12. - DOI - PMC - PubMed
    1. Deng W, Puente JL, Gruenheid S, Li Y, Vallance BA, et al. Dissecting virulence: systematic and functional analyses of a pathogenicity island. Proc Natl Acad Sci. 2004;101:3597–3602. doi: 10.1073/pnas.0400326101. - DOI - PMC - PubMed
    1. Tobe T, Beatson SA, Taniguchi H, Abe H, Bailey CM, et al. An extensive repertoire of type III secretion effectors in Escherichia coli O157 and the role of lambdoid phages in their dissemination. Proc Natl Acad Sci. 2006;103:14941–14946. doi: 10.1073/pnas.0604891103. - DOI - PMC - PubMed
    1. Ogura Y, Ooka T, Iguchi A, Toh H, Asadulghani M, et al. Comparative genomics reveal the mechanism of the parallel evolution of O157 and non-O157 enterohemorrhagic Escherichia coli . Proc Natl Acad Sci. 2009;106:17939–17944. doi: 10.1073/pnas.0903585106. - DOI - PMC - PubMed
    1. Eppinger M, Mammel MK, Leclerc JE, Ravel J, Cebula TA. Genomic anatomy of Escherichia coli O157:H7 outbreaks. Proc Natl Acad Sci. 2011;108:20142–20147. doi: 10.1073/pnas.1107176108. - DOI - PMC - PubMed

Publication types