

Smartphone-Tracked Digital Markers of Momentary Subjective Stress in College Students: Idiographic Machine Learning Analysis
- PMID: 36951924
- PMCID: PMC10132040
- DOI: 10.2196/37469
Smartphone-Tracked Digital Markers of Momentary Subjective Stress in College Students: Idiographic Machine Learning Analysis
Abstract
Background: Stress is an important predictor of mental health problems such as burnout and depression. Acute stress is considered adaptive, whereas chronic stress is viewed as detrimental to well-being. To aid in the early detection of chronic stress, machine learning models are increasingly trained to learn the quantitative relation from digital footprints to self-reported stress. Prior studies have investigated general principles in population-wide studies, but the extent to which the findings apply to individuals is understudied.
Objective: We aimed to explore to what extent machine learning models can leverage features of smartphone app use log data to recognize momentary subjective stress in individuals, which of these features are most important for predicting stress and represent potential digital markers of stress, the nature of the relations between these digital markers and stress, and the degree to which these relations differ across people.
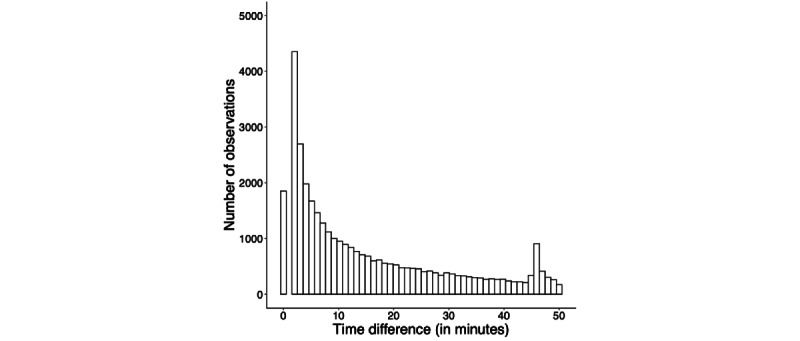
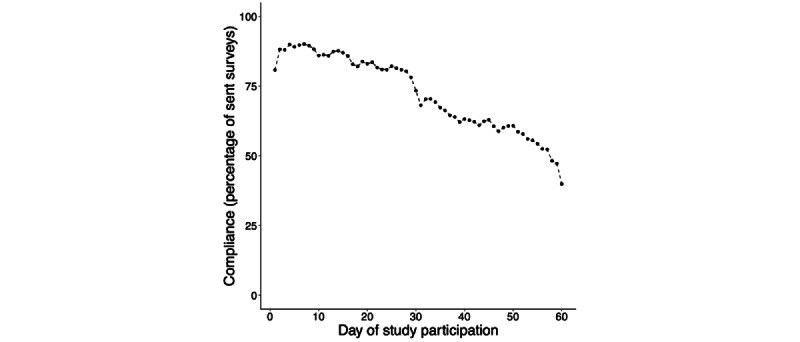
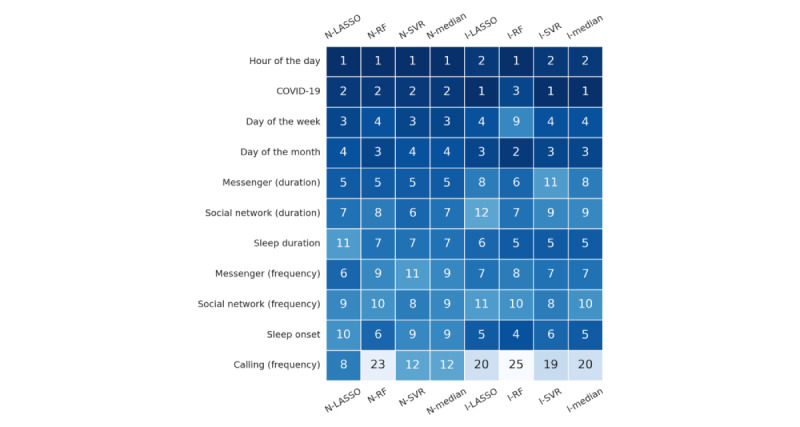
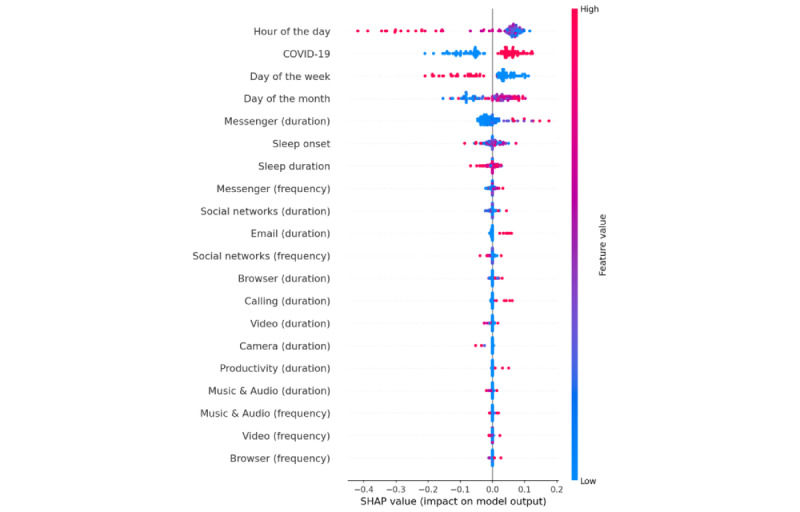
Methods: Student participants (N=224) self-reported momentary subjective stress 5 times per day up to 60 days in total (44,381 observations); in parallel, dedicated smartphone software continuously logged their smartphone app use. We extracted features from the log data (eg, time spent on app categories such as messenger apps and proxies for sleep duration and onset) and trained machine learning models to predict momentary subjective stress from these features using 2 approaches: modeling general relations at the group level (nomothetic approach) and modeling relations for each person separately (idiographic approach). To identify potential digital markers of momentary subjective stress, we applied explainable artificial intelligence methodology (ie, Shapley additive explanations). We evaluated model accuracy on a person-to-person basis in out-of-sample observations.
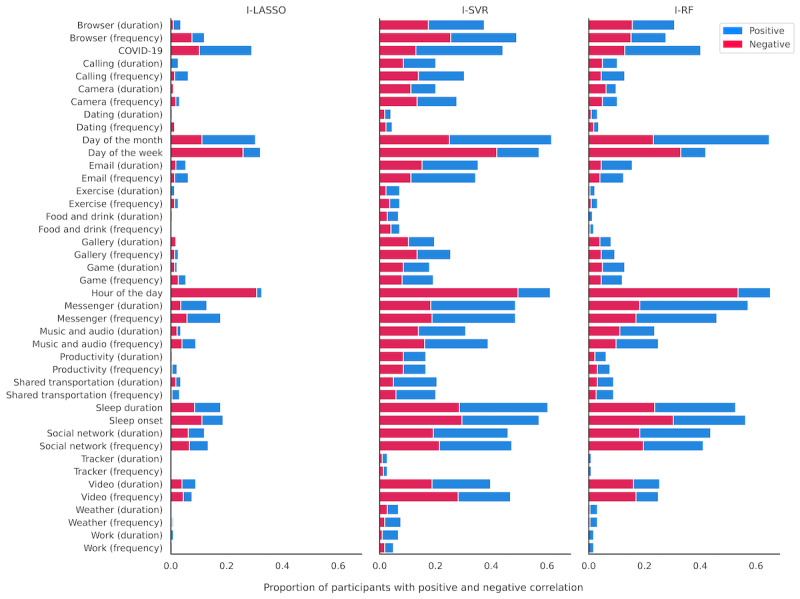
Results: We identified prolonged use of messenger and social network site apps and proxies for sleep duration and onset as the most important features across modeling approaches (nomothetic vs idiographic). The relations of these digital markers with momentary subjective stress differed from person to person, as did model accuracy. Sleep proxies, messenger, and social network use were heterogeneously related to stress (ie, negative in some and positive or zero in others). Model predictions correlated positively and statistically significantly with self-reported stress in most individuals (median person-specific correlation=0.15-0.19 for nomothetic models and median person-specific correlation=0.00-0.09 for idiographic models).
Conclusions: Our findings indicate that smartphone log data can be used for identifying digital markers of stress and also show that the relation between specific digital markers and stress differs from person to person. These findings warrant follow-up studies in other populations (eg, professionals and clinical populations) and pave the way for similar research using physiological measures of stress.
Keywords: digital biomarker; digital phenotype; machine learning; mobile health; mobile phone; personalized models.
©George Aalbers, Andrew T Hendrickson, Mariek MP Vanden Abeele, Loes Keijsers. Originally published in JMIR mHealth and uHealth (https://mhealth.jmir.org), 23.03.2023.
Conflict of interest statement
Conflicts of Interest: None declared.
Figures
Similar articles
-
Identifying Person-Specific Drivers of Depression in Adolescents: Protocol for a Smartphone-Based Ecological Momentary Assessment and Passive Sensing Study.JMIR Res Protoc. 2024 Jul 16;13:e43931. doi: 10.2196/43931. JMIR Res Protoc. 2024. PMID: 39012691 Free PMC article.
-
Mental Health and Behavior of College Students During the COVID-19 Pandemic: Longitudinal Mobile Smartphone and Ecological Momentary Assessment Study, Part II.J Med Internet Res. 2021 Jun 4;23(6):e28892. doi: 10.2196/28892. J Med Internet Res. 2021. PMID: 33900935 Free PMC article.
-
Using Smartphone Sensor Paradata and Personalized Machine Learning Models to Infer Participants' Well-being: Ecological Momentary Assessment.J Med Internet Res. 2022 Apr 28;24(4):e34015. doi: 10.2196/34015. J Med Internet Res. 2022. PMID: 35482397 Free PMC article.
-
Mobile Apps to Reduce Tobacco, Alcohol, and Illicit Drug Use: Systematic Review of the First Decade.J Med Internet Res. 2020 Nov 24;22(11):e17156. doi: 10.2196/17156. J Med Internet Res. 2020. PMID: 33231555 Free PMC article.
-
Development and Validation of Risk Scores for All-Cause Mortality for a Smartphone-Based "General Health Score" App: Prospective Cohort Study Using the UK Biobank.JMIR Mhealth Uhealth. 2021 Feb 16;9(2):e25655. doi: 10.2196/25655. JMIR Mhealth Uhealth. 2021. PMID: 33591285 Free PMC article. Review.
Cited by
-
Applying AI in the Context of the Association Between Device-Based Assessment of Physical Activity and Mental Health: Systematic Review.JMIR Mhealth Uhealth. 2025 Mar 6;13:e59660. doi: 10.2196/59660. JMIR Mhealth Uhealth. 2025. PMID: 40053765 Free PMC article.
-
Using Natural Language Processing to Track Negative Emotions in the Daily Lives of Adolescents.Res Sq [Preprint]. 2025 Apr 17:rs.3.rs-6414400. doi: 10.21203/rs.3.rs-6414400/v1. Res Sq. 2025. PMID: 40321753 Free PMC article. Preprint.
-
Uncovering the potential of smartphones for behavior monitoring during migraine follow-up.BMC Med Inform Decis Mak. 2025 Feb 18;25(1):88. doi: 10.1186/s12911-025-02916-w. BMC Med Inform Decis Mak. 2025. PMID: 39966928 Free PMC article.
-
How do machine learning models perform in the detection of depression, anxiety, and stress among undergraduate students? A systematic review.Cad Saude Publica. 2024 Dec 20;40(11):e00029323. doi: 10.1590/0102-311XEN029323. eCollection 2024. Cad Saude Publica. 2024. PMID: 39775769 Free PMC article.
-
Future pHealth Ecosystem-Holistic View on Privacy and Trust.J Pers Med. 2023 Jun 26;13(7):1048. doi: 10.3390/jpm13071048. J Pers Med. 2023. PMID: 37511661 Free PMC article.
References
-
- Yates SW. Physician stress and burnout. Am J Med. 2020 Mar;133(2):160–4. doi: 10.1016/j.amjmed.2019.08.034. https://www.amjmed.com/article/S0002-9343(19)30757-0/fulltext S0002-9343(19)30757-0 - DOI - PubMed
-
- Fukazawa Y, Ito T, Okimura T, Yamashita Y, Maeda T, Ota J. Predicting anxiety state using smartphone-based passive sensing. J Biomed Inform. 2019 May;93:103151. doi: 10.1016/j.jbi.2019.103151. https://linkinghub.elsevier.com/retrieve/pii/S1532-0464(19)30069-3 S1532-0464(19)30069-3 - DOI - PubMed
-
- Ferdous R, Osmani V, Mayora O. Smartphone app usage as a predictor of perceived stress levels at workplace. Proceedings of the 9th International Conference on Pervasive Computing Technologies for Healthcare; PervasiveHealth '15; May 20-23, 2015; Istanbul, Turkey. 2015. pp. 225–8. https://ieeexplore.ieee.org/abstract/document/7349403 - DOI
Publication types
MeSH terms
LinkOut - more resources
Full Text Sources
