. 2023 May 15;133(10):e167955.
doi: 10.1172/JCI167955.

Durability of immune responses to mRNA booster vaccination against COVID-19

Affiliations

Durability of immune responses to mRNA booster vaccination against COVID-19

Prabhu S Arunachalam et al. J Clin Invest. .

Abstract

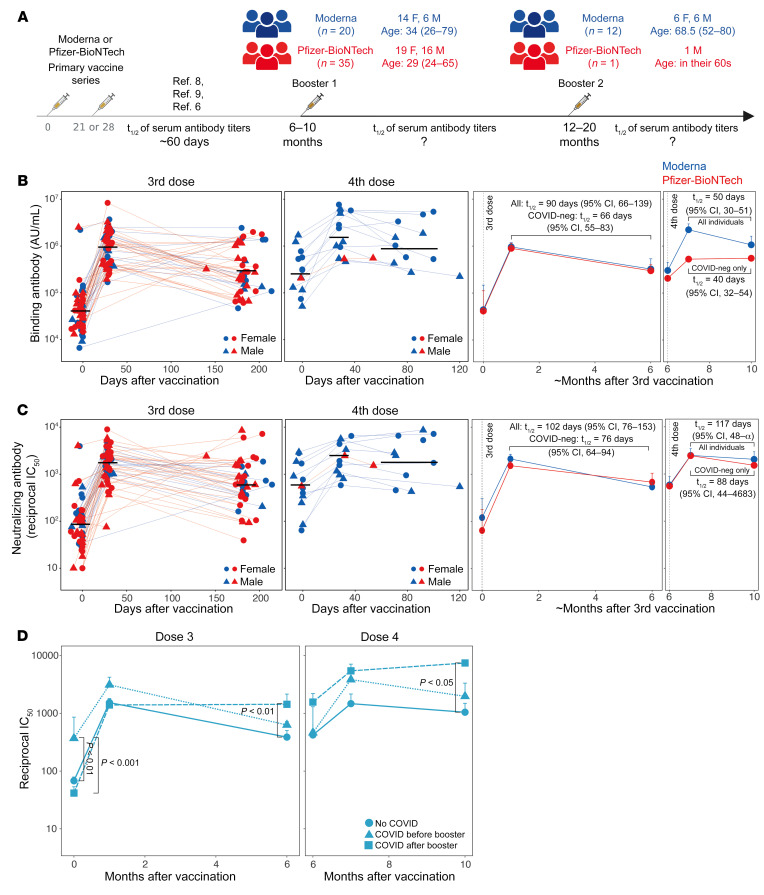
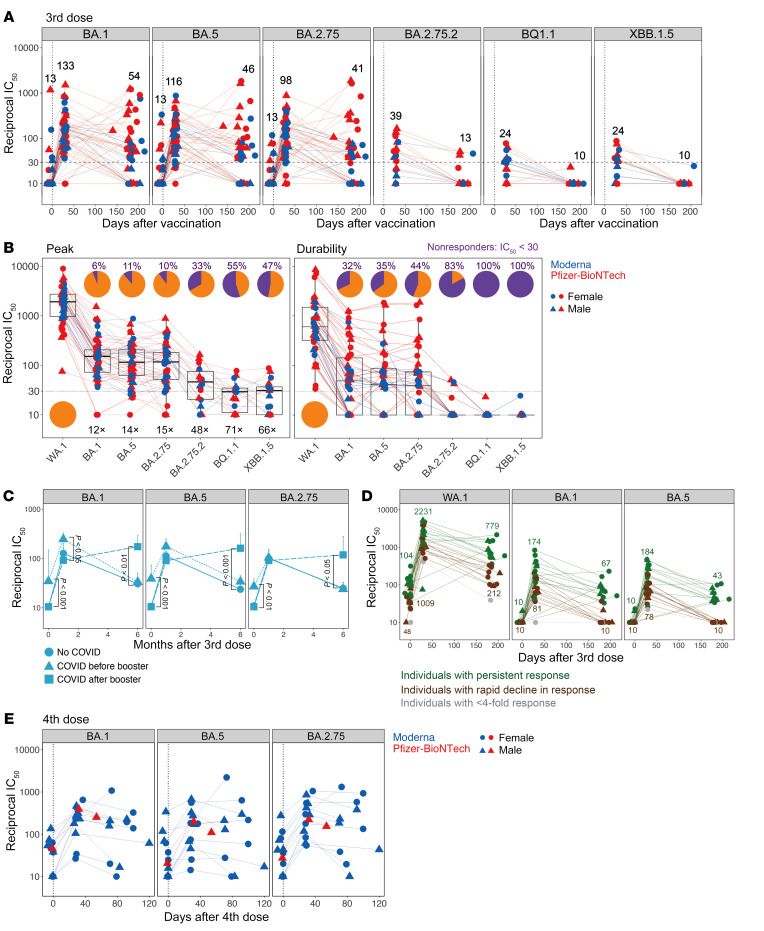
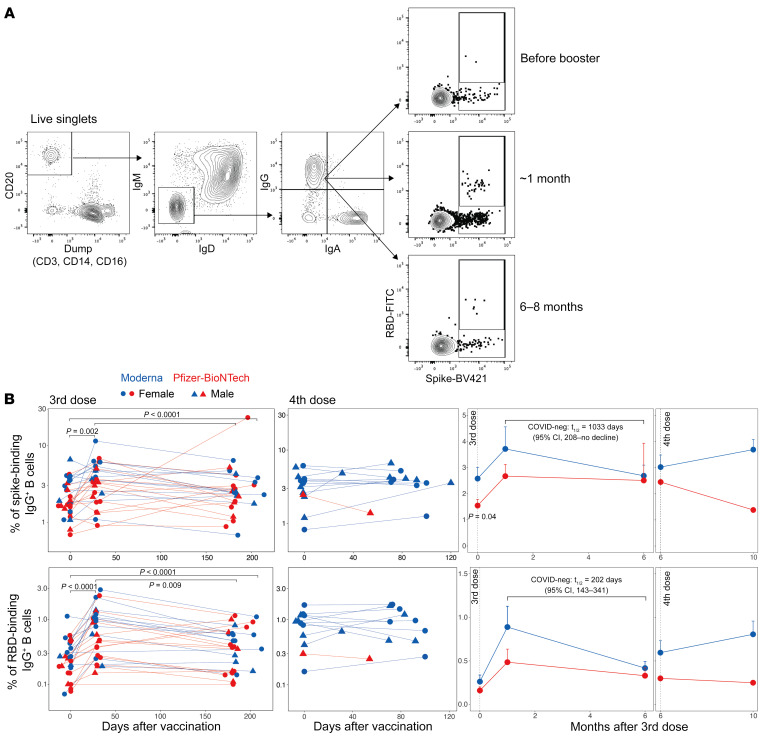
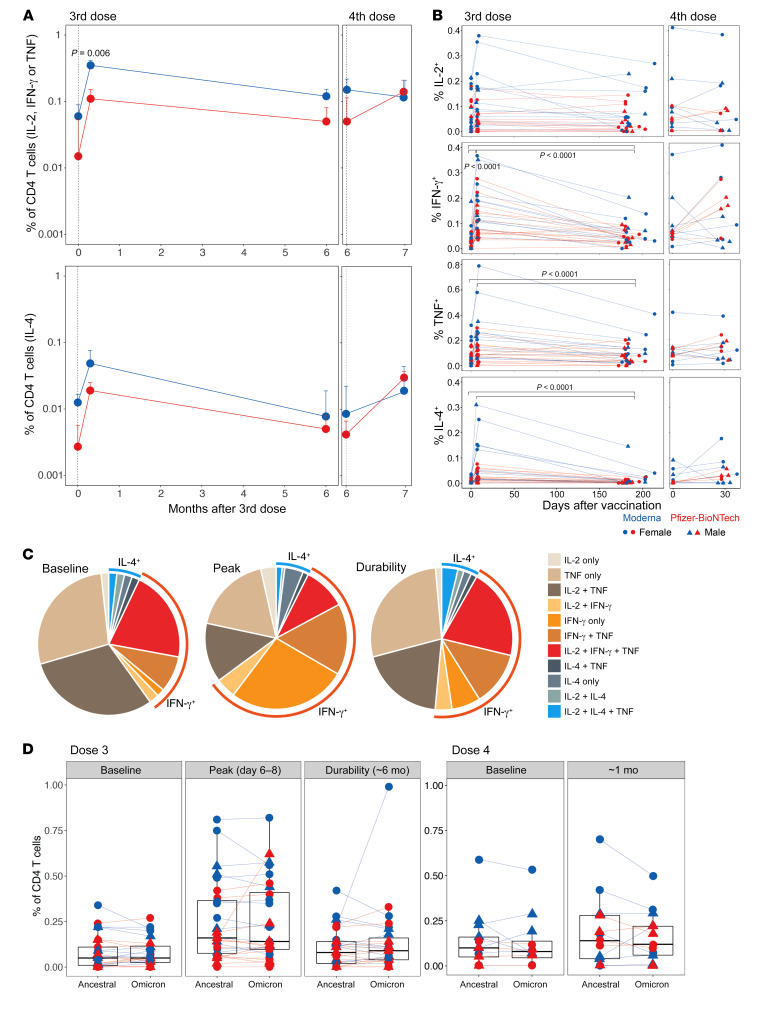
BackgroundMaintaining durable immunity following vaccination represents a major challenge, but whether mRNA booster vaccination improves durability is unknown.MethodsWe measured antibody responses in 55 healthy adults, who received a booster dose of the Pfizer-BioNTech or Moderna vaccine against SARS-CoV-2 and calculated the half-life of the antibody titers. We also measured memory B and T cell responses in a subset of 28 participants. In 13 volunteers who received a second booster vaccine, we measured serum antibody titers and memory B and T cell responses.ResultsThe booster (third immunization) dose at 6 to 10 months increased the half-life of the serum-neutralizing antibody (nAb) titers to 76 days from 56 to 66 days after the primary 2-dose vaccination. A second booster dose (fourth immunization) a year after the primary vaccination further increased the half-life to 88 days. However, despite this modestly improved durability in nAb responses against the ancestral (WA.1) strain, there was a loss of neutralization capacity against the Omicron subvariants BA.2.75.2, BQ.1.1, and XBB.1.5 (48-, 71-, and 66-fold drop in titers, respectively, relative to the WA.1 strain). Although only 45% to 65% of participants demonstrated a detectable nAb titer against the newer variants after the booster (third dose), the response declined to below the detection limit in almost all individuals by 6 months. In contrast, booster vaccination induced antigen-specific memory B and T cells that persisted for at least 6 months.ConclusionThe durability of serum antibody responses improves only marginally following booster immunizations with the Pfizer-BioNTech or Moderna mRNA vaccines.

Keywords: Adaptive immunity; Vaccines.


Figures

Figure 1
Figure 1. Serum antibody responses following mRNA booster vaccinations.
(A) Schematic of the study design and participants’ details. The schematic was made using BioRender. (B and C) Anti–spike-binding IgG (B) and live-virus nAb titers (C) against the ancestral WA.1 strain. Each symbol represents an individual in the 2 plots on the left (n = 55 and n = 13 for the 3- and 4-dose groups, respectively). The black horizontal lines indicate geometric mean titers. The 2 graphs on the right show a summary (geometric mean + SEM) of the antibody responses. (D) nAb titers in groups of participants stratified by exposure to COVID-19. Data shown are the geometric mean for each group + SEM. The statistical difference between groups at each time point was analyzed by the Mann-Whitney U test. F, female; M, male; neg, negative.
Figure 2
Figure 2. nAb breadth following booster vaccinations.
(A) Live-virus nAb response measured against Omicron BA.1, BA.5, BA.2.75, BA.2.75.2, and BQ.1.1 variants (n = 55 for BA.1, BA.5, and BA.2.75; n = 18 for BA.2.75.2 and BQ.1.1; n = 17 for XBB.1.5). Participants who had the highest titers against the ancestral and Omicron BA.1 variant were selected for this assay. (B) nAb titers against the viruses indicated on the x axis at peak (left panel) and their durability (right panel). Pie charts show the proportion of participants who responded (in orange) versus those who did not (in purple) against each virus. Nonresponders were defined as those who had an IC50 below 30. The numbers inside the graph followed by X indicate the decrease in titers against variants in comparison with the ancestral strain. The fold change was calculated using responders, i.e., those with an IC50 above 30 only. Horizontal dotted lines in A and B indicate the cutoff used to define the responders. (C) nAb titers against the variants indicated on the plots in participants stratified by exposure to COVID-19. Data shown are the geometric mean for each group + SEM. The statistical difference between groups at each time point was analyzed by the Mann-Whitney U test. (D) nAb titers in all SARS-CoV-2–naive individuals. Each symbol represents an individual. Individuals who showed a neutralization titer below 30 against BA.1, BA.5, or BA.2.75 at 6 months were classified as those with a rapid decline (brown). Data points for individuals who showed a less than 4-fold increase in titers against the variants are shown in gray. The rest of the individuals were considered normal responders (green). (E) Live-virus nAb response measured against Omicron variants BA.1, BA.5, and BA.2.75 (n = 13) in participants who received a fourth dose of the mRNA vaccine.
Figure 3
Figure 3. Memory B cell responses to the booster vaccination.
(A) Representative flow cytometry profile showing the gating strategy to define spike-specific B cell frequencies (gated as live CD20+IgDIgMspike+ RBD+/– cells. (B) Frequency of WA.1 spike–specific (top panel) or RBD-specific (bottom panel) memory B cells relative to CD20+IgDIgM B cells. Each symbol represents an individual (n = 28, after the third dose; n = 13, after the fourth dose). The statistical differences between time points were determined using the Wilcoxon matched-pairs, signed-rank test. The 2 graphs on the right show a summary of the responses (geometric mean + SEM). The statistical difference between the groups was determined using the Mann-Whitney U test.
Figure 4
Figure 4. T cell responses induced by the mRNA booster vaccination.
(A) Summary of the frequency of ancestral spike–specific CD4+ T cells secreting IL-2, IFN-γ, or TNF (Th1-type, top panel) and IL-4 (Th2-type, bottom panel). Median responses ± SEM are plotted. The statistical difference between groups was determined using a Mann-Whitney U test. (B) Frequency of spike-specific CD4+ T cells that produced the indicated individual cytokines (geometric mean + SEM). Each symbol represents an individual (n = 28 after the third dose and 13 after the fourth dose). The statistical significance between time points was calculated using a Wilcoxon matched-pairs, signed-rank test. (C) Pie charts showing the proportion of spike-specific CD4+ T cells producing 1, 2, or 3 cytokines in response to the third dose of the vaccine. (D) Comparison of CD4+ T cell frequencies (Th1-type producing IL-2, TNF, or IFN-γ) between ancestral and Omicron BA.1 viral strains measured at the time points indicated on the plots.

Update of

Similar articles

Cited by

References

    1. Collie S, et al. Effectiveness and durability of the BNT162b2 vaccine against omicron sublineages in South Africa. N Engl J Med. 2022;387(14):1332–1333. doi: 10.1056/NEJMc2210093. - DOI - PMC - PubMed
    1. Andrews N, et al. Covid-19 vaccine effectiveness against the omicron (B.1.1.529) Variant. N Engl J Med. 2022;386(16):1532–1546. doi: 10.1056/NEJMoa2119451. - DOI - PMC - PubMed
    1. Moreira ED, Jr, et al. Safety and efficacy of a third dose of BNT162b2 Covid-19 vaccine. N Engl J Med. 2022;386(20):1910–1921. doi: 10.1056/NEJMoa2200674. - DOI - PMC - PubMed
    1. Lustig Y, et al. Superior immunogenicity and effectiveness of the third compared to the second BNT162b2 vaccine dose. Nat Immunol. 2022;23(6):940–946. doi: 10.1038/s41590-022-01212-3. - DOI - PubMed
    1. Regev-Yochay G, et al. Efficacy of a fourth dose of Covid-19 mRNA vaccine against Omicron. N Engl J Med. 2022;386(14):1377–1380. doi: 10.1056/NEJMc2202542. - DOI - PMC - PubMed

Publication types