

Identification of the regulatory mechanism of ACE2 in COVID-19-induced kidney damage with systems genetics approach
- PMID: 36951969
- PMCID: PMC10034233
- DOI: 10.1007/s00109-023-02304-9
Identification of the regulatory mechanism of ACE2 in COVID-19-induced kidney damage with systems genetics approach
Abstract
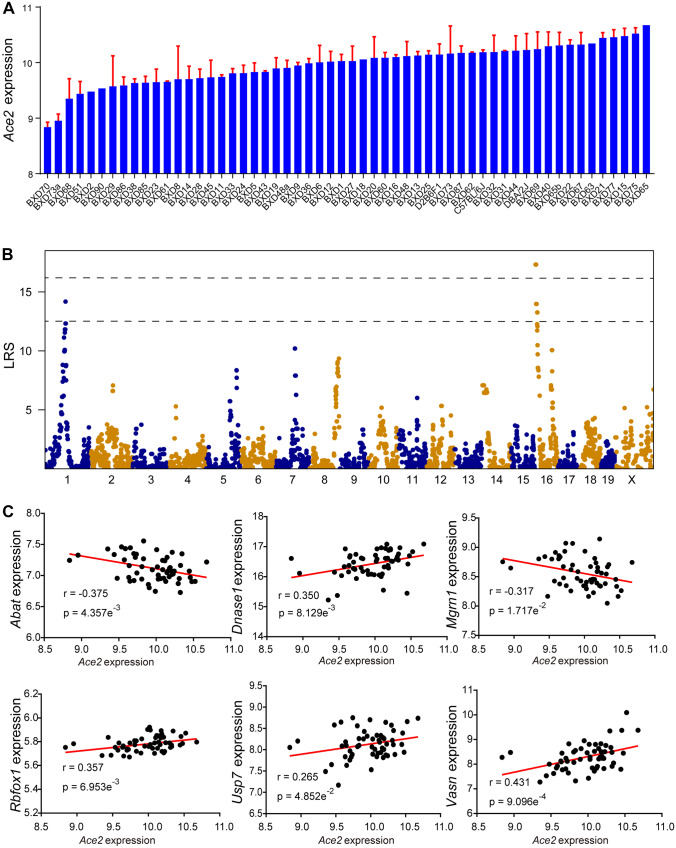
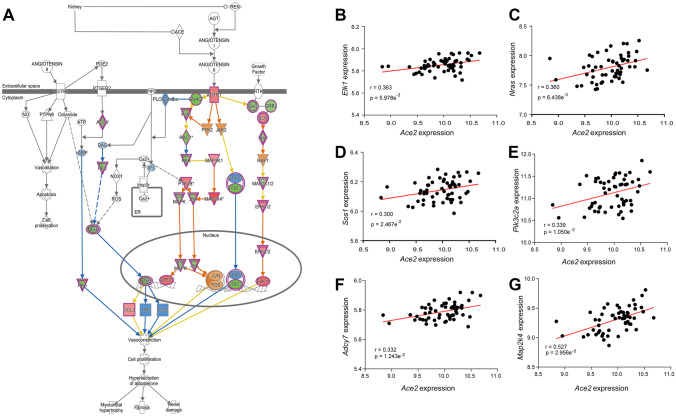
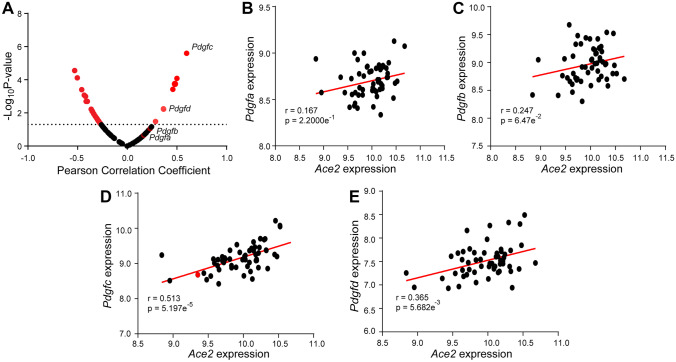
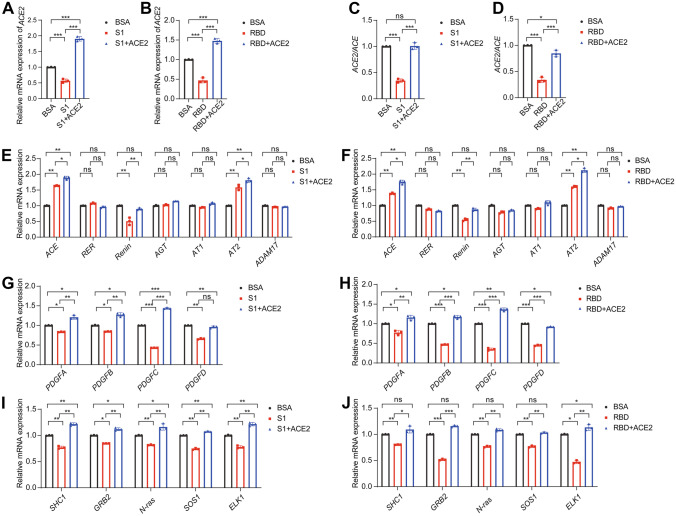
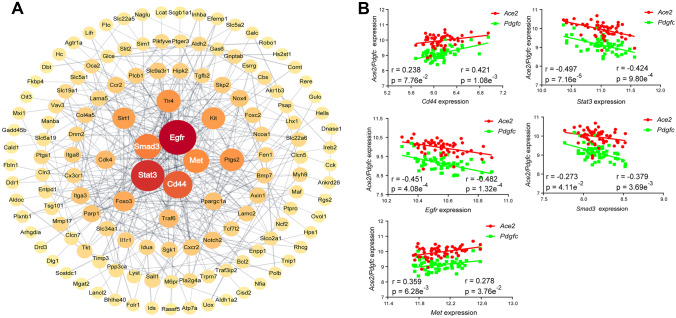
Studies showed that SARS-CoV-2 can directly target the kidney and induce renal damage. As the cell surface receptor for SARS-CoV-2 infection, the angiotensin-converting enzyme 2 (ACE2) plays a pivotal role for renal physiology and function. Thus, it is important to understand ACE2 through which pathway influences the pathogenesis of renal damage induced by COVID-19. In this study, we first performed an eQTL mapping for Ace2 in kidney tissues in 53 BXD mice strains. Results demonstrated that Ace2 is highly expressed and strongly controlled by a genetic locus on chromosome 16 in the kidney, with six genes (Dnase1, Vasn, Usp7, Abat, Mgrn1, and Rbfox1) dominated as the upstream modulator, as they are highly correlated with Ace2 expression. Gene co-expression analysis showed that Ace2 co-variates are significantly involved in the renin-angiotensin system (RAS) pathway which acts as a reno-protector. Importantly, we also found that Ace2 is positively correlated with Pdgf family members, particularly Pdgfc, which showed the most association among the 76 investigated growth factors. Mammalian Phenotype Ontology enrichment indicated that the cognate transcripts for both Ace2 and Pdgfc were mainly involved in regulating renal physiology and morphology. Among which, Cd44, Egfr, Met, Smad3, and Stat3 were identified as hub genes through protein-protein interaction analysis. Finally, in aligning with our systems genetics findings, we found ACE2, pdgf family members, and RAS genes decreased significantly in the CAKI-1 kidney cancer cells treated with S protein and receptor binding domain structural protein. Collectively, our data suggested that ACE2 work with RAS, PDGFC, as well as their cognate hub genes to regulate renal function, which could guide for future clinical prevention and targeted treatment for COVID-19-induced renal damage outcomes. KEY MESSAGES: • Ace2 is highly expressed and strongly controlled by a genetic locus on chromosome 16 in the kidney. • Ace2 co-variates are enriched in the RAS pathway. • Ace2 is strongly correlated with the growth factor Pdgfc. • Ace2 and Pdgfc co-expressed genes involved in the regulation of renal physiology and morphology. • SARS-CoV-2 spike glycoprotein induces down-regulation of Ace2, RAS, and Pdgfc.
Keywords: BXD mice; COVID-19; Kidney; PDGF family; RAS; SARS-CoV-2; Transcriptome.
© 2023. The Author(s), under exclusive licence to Springer-Verlag GmbH Germany, part of Springer Nature.
Conflict of interest statement
The authors declare no competing interests.
Figures
Similar articles
-
Expressions and significances of the angiotensin-converting enzyme 2 gene, the receptor of SARS-CoV-2 for COVID-19.Mol Biol Rep. 2020 Jun;47(6):4383-4392. doi: 10.1007/s11033-020-05478-4. Epub 2020 May 14. Mol Biol Rep. 2020. PMID: 32410141 Free PMC article.
-
Spike-mediated ACE2 down-regulation was involved in the pathogenesis of SARS-CoV-2 infection.J Infect. 2022 Oct;85(4):418-427. doi: 10.1016/j.jinf.2022.06.030. Epub 2022 Jul 3. J Infect. 2022. PMID: 35793758 Free PMC article.
-
ACE2: from protection of liver disease to propagation of COVID-19.Clin Sci (Lond). 2020 Dec 11;134(23):3137-3158. doi: 10.1042/CS20201268. Clin Sci (Lond). 2020. PMID: 33284956 Review.
-
ApoE4 associated with severe COVID-19 outcomes via downregulation of ACE2 and imbalanced RAS pathway.J Transl Med. 2023 Feb 9;21(1):103. doi: 10.1186/s12967-023-03945-7. J Transl Med. 2023. PMID: 36759834 Free PMC article.
-
Regulation of Angiotensin-Converting Enzyme 2: A Potential Target to Prevent COVID-19?Front Endocrinol (Lausanne). 2021 Oct 22;12:725967. doi: 10.3389/fendo.2021.725967. eCollection 2021. Front Endocrinol (Lausanne). 2021. PMID: 34745001 Free PMC article. Review.
Cited by
-
Studying the Roles of the Renin-Angiotensin System in Accelerating the Disease of High-Fat-Diet-Induced Diabetic Nephropathy in a db/db and ACE2 Double-Gene-Knockout Mouse Model.Int J Mol Sci. 2023 Dec 26;25(1):329. doi: 10.3390/ijms25010329. Int J Mol Sci. 2023. PMID: 38203500 Free PMC article.
-
New Insights into the Link between SARS-CoV-2 Infection and Renal Cancer.Life (Basel). 2023 Dec 28;14(1):52. doi: 10.3390/life14010052. Life (Basel). 2023. PMID: 38255667 Free PMC article. Review.
References
Publication types
MeSH terms
Substances
LinkOut - more resources
Full Text Sources
Medical
Research Materials
Miscellaneous
