. 2023 Apr 25;42(4):112293.
doi: 10.1016/j.celrep.2023.112293. Epub 2023 Mar 21.

Transcriptomic atlas and interaction networks of brain cells in mouse CNS demyelination and remyelination

Affiliations

Transcriptomic atlas and interaction networks of brain cells in mouse CNS demyelination and remyelination

Jinchao Hou et al. Cell Rep. .

Abstract

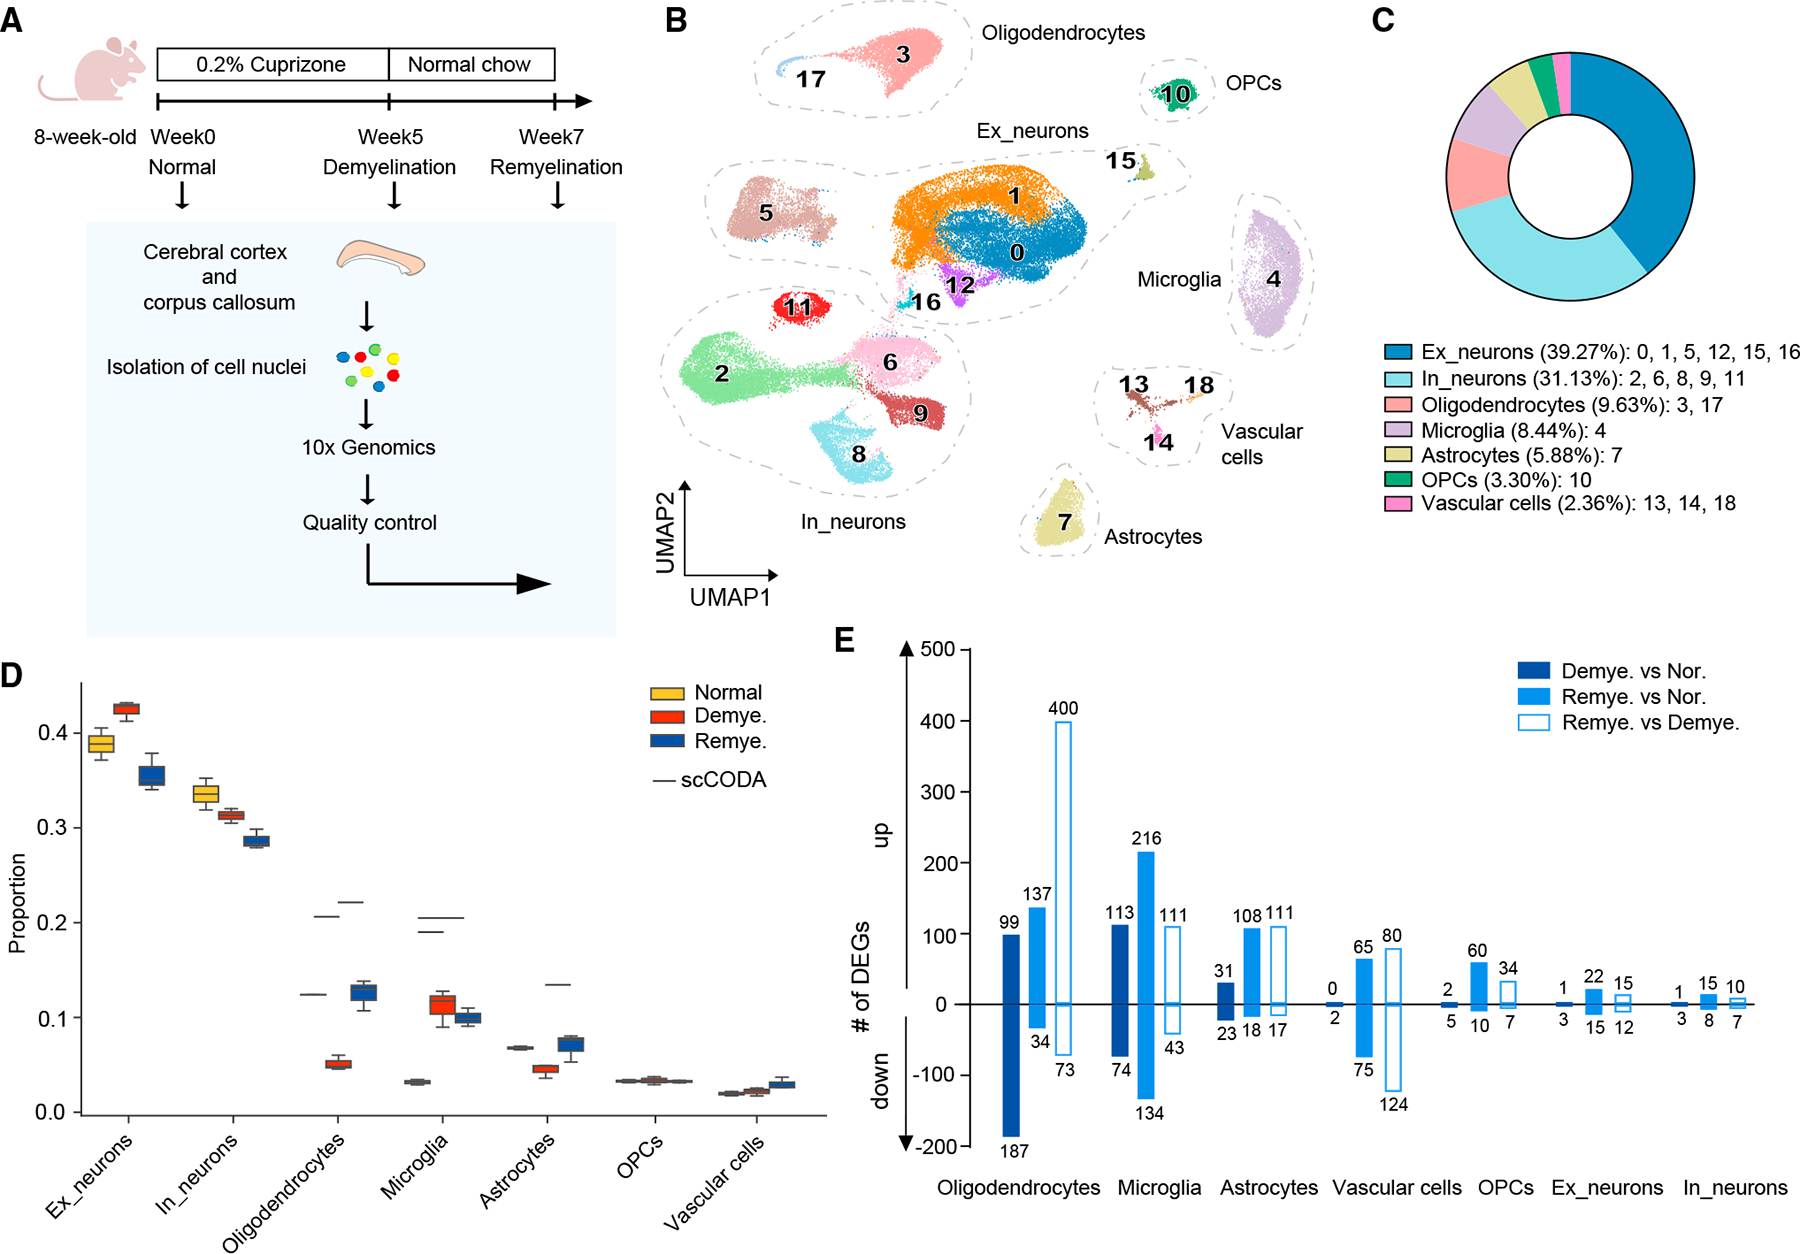
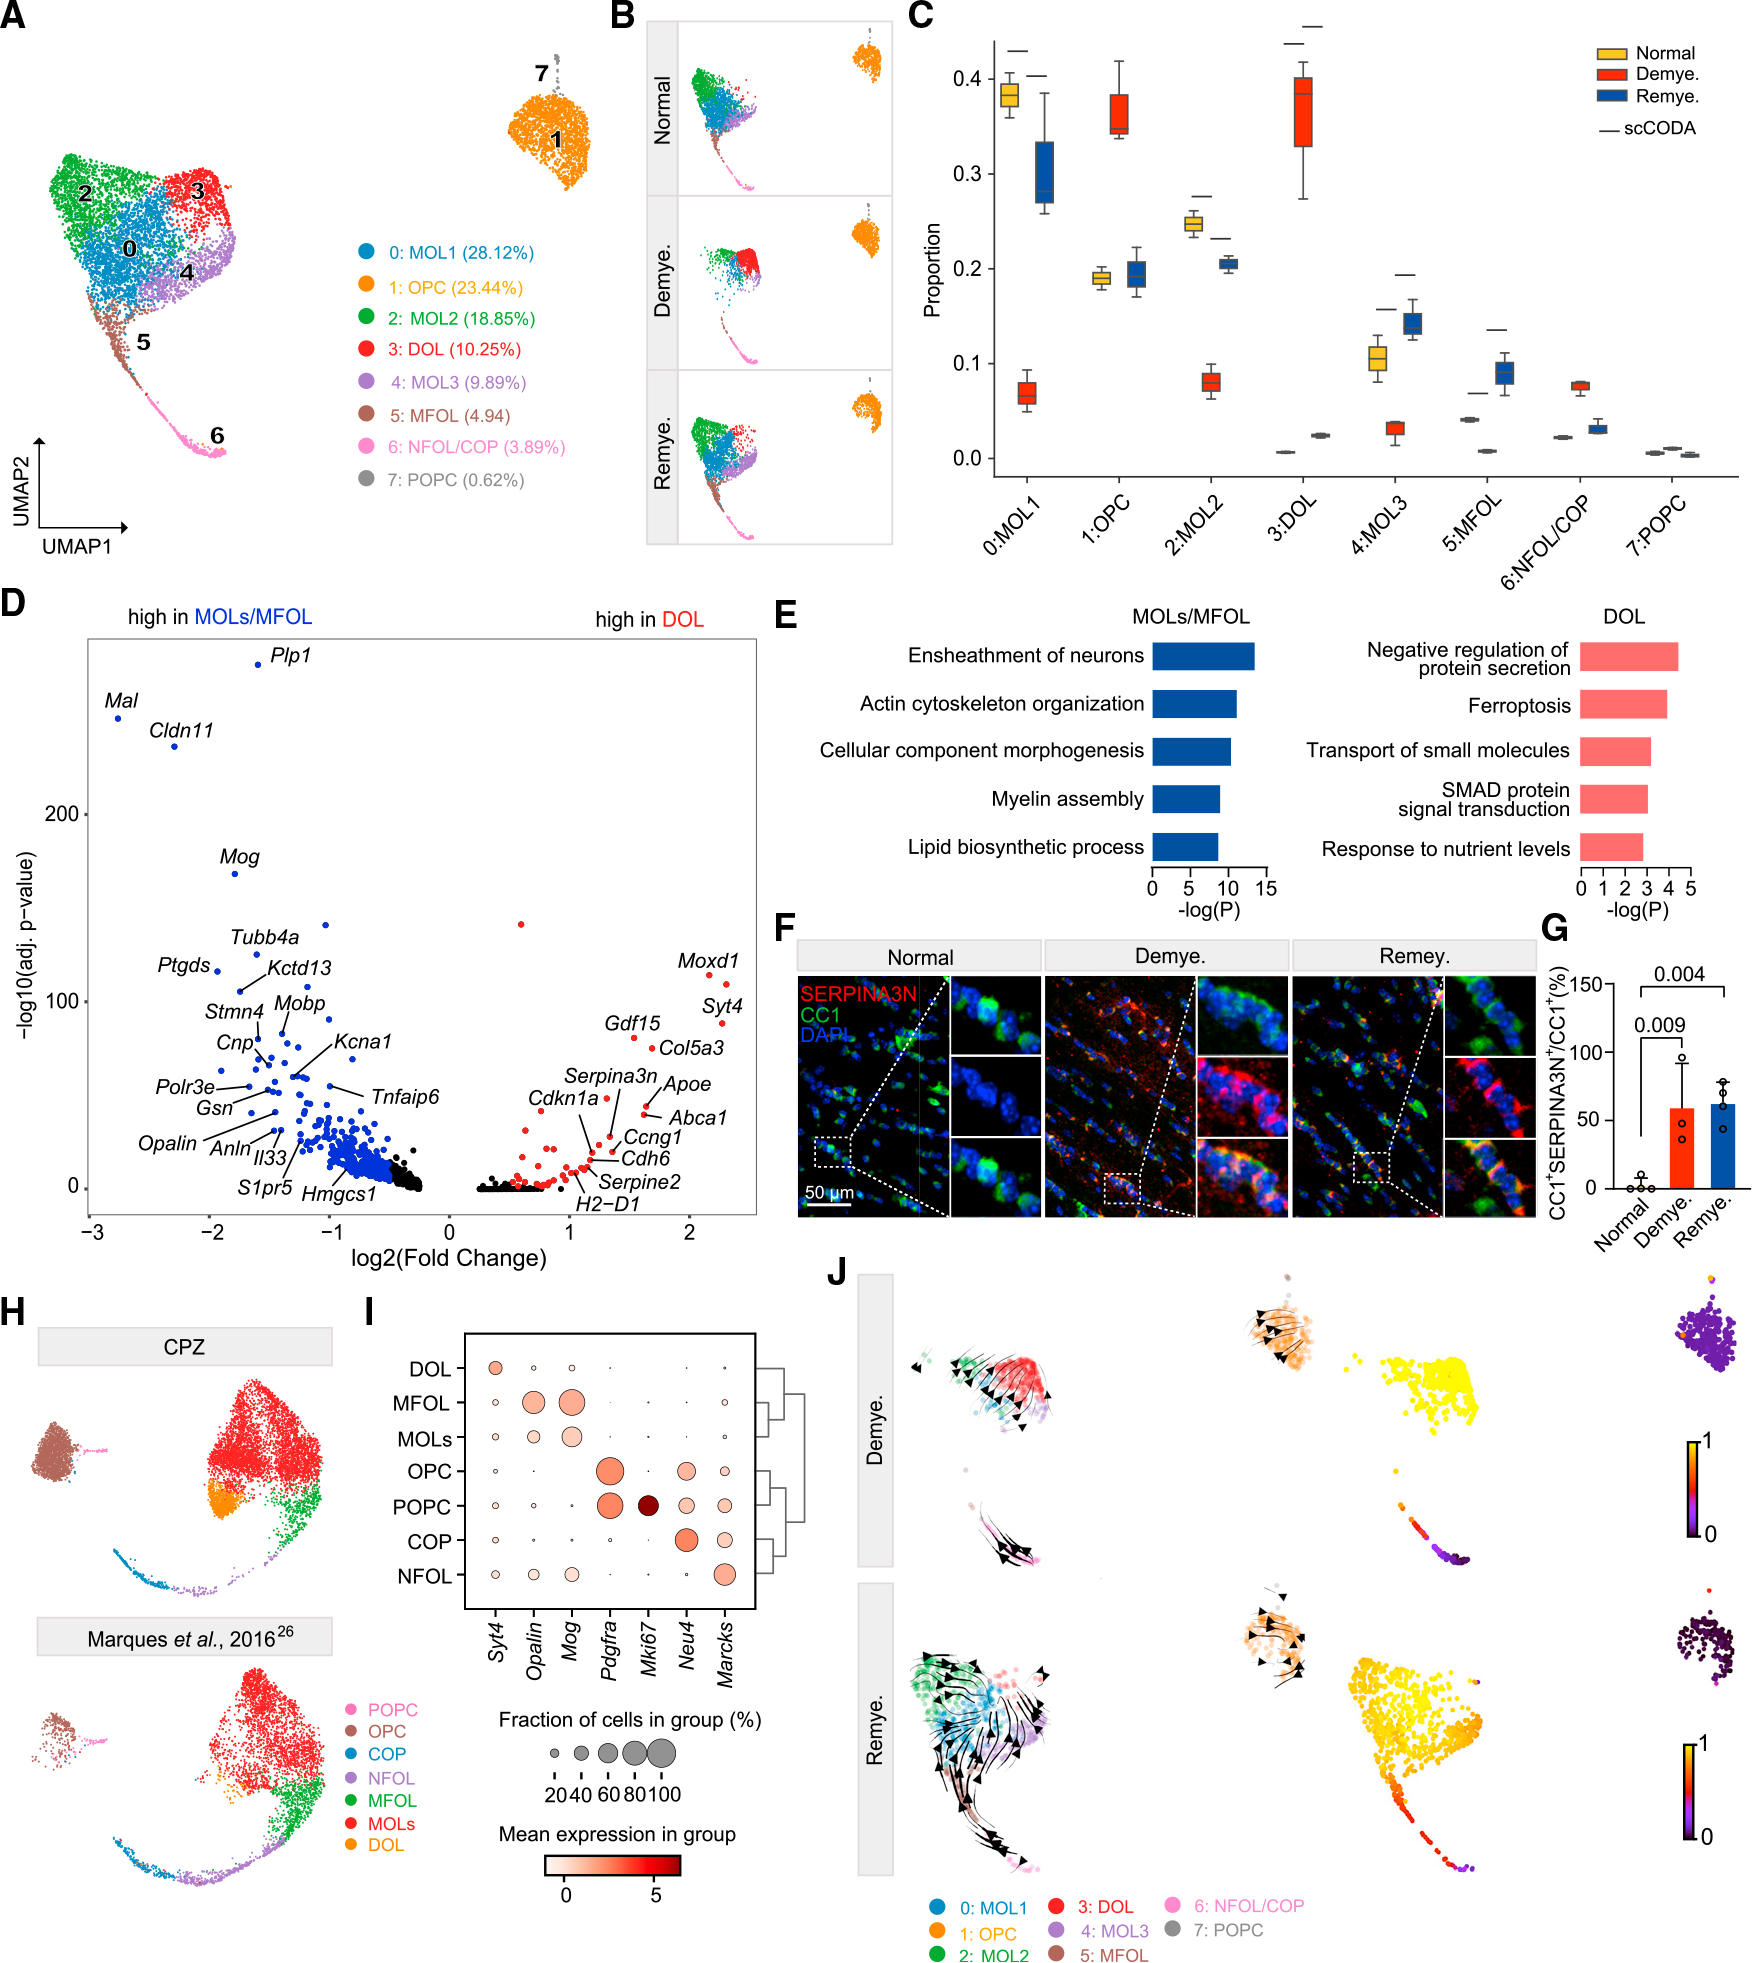
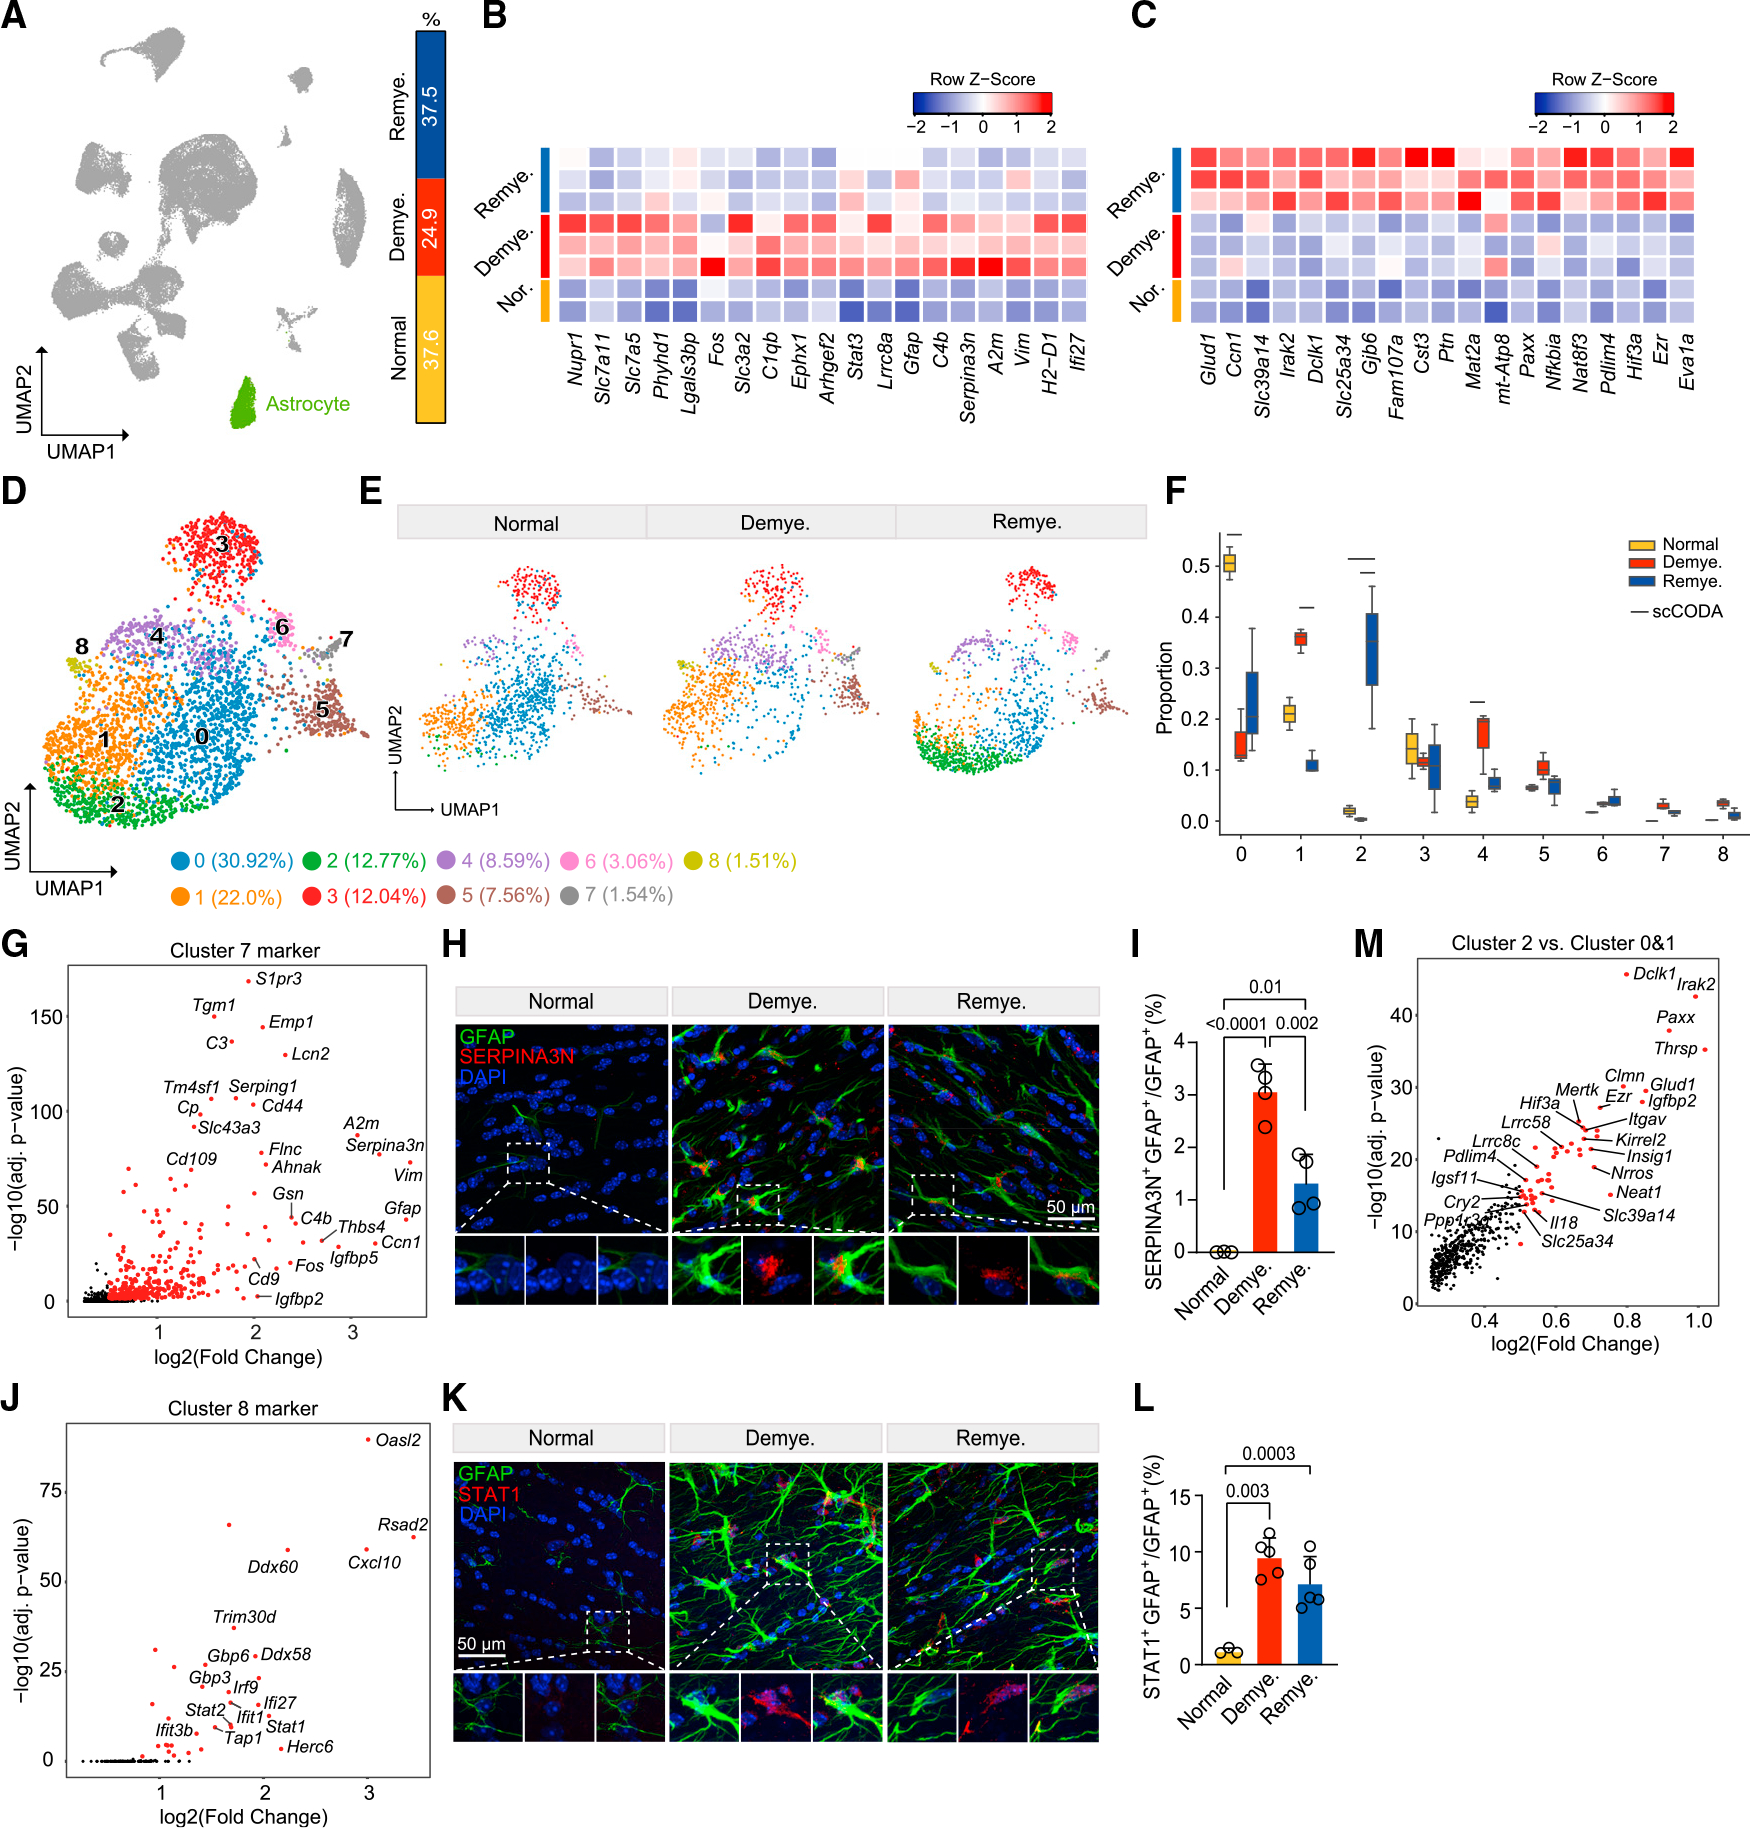
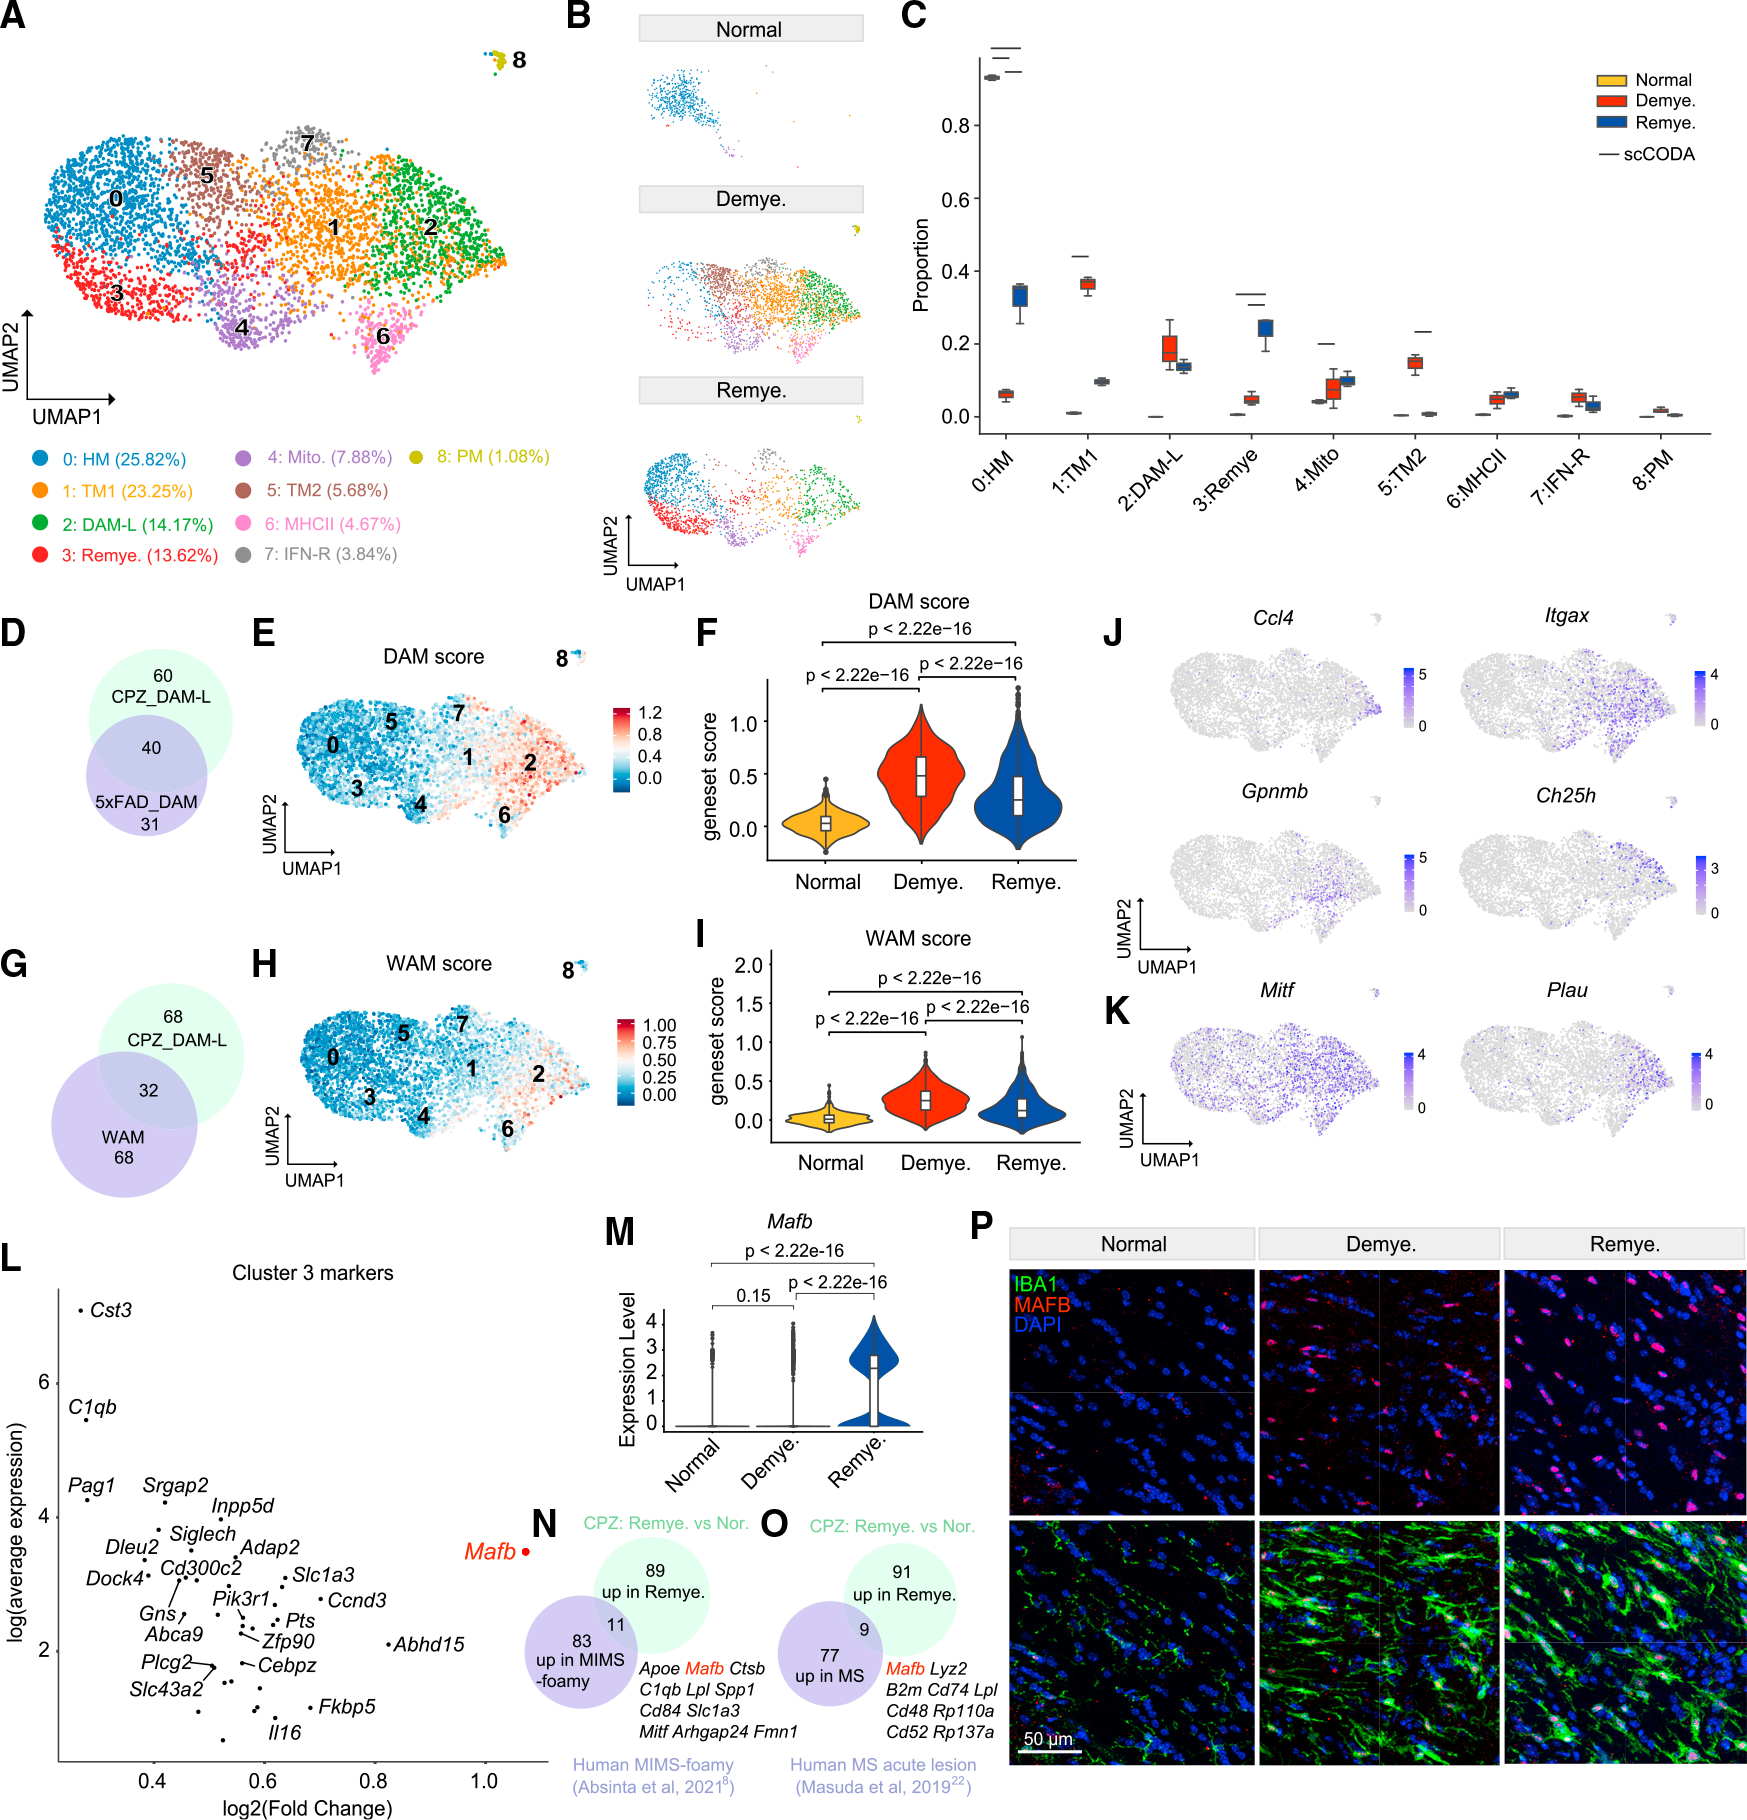
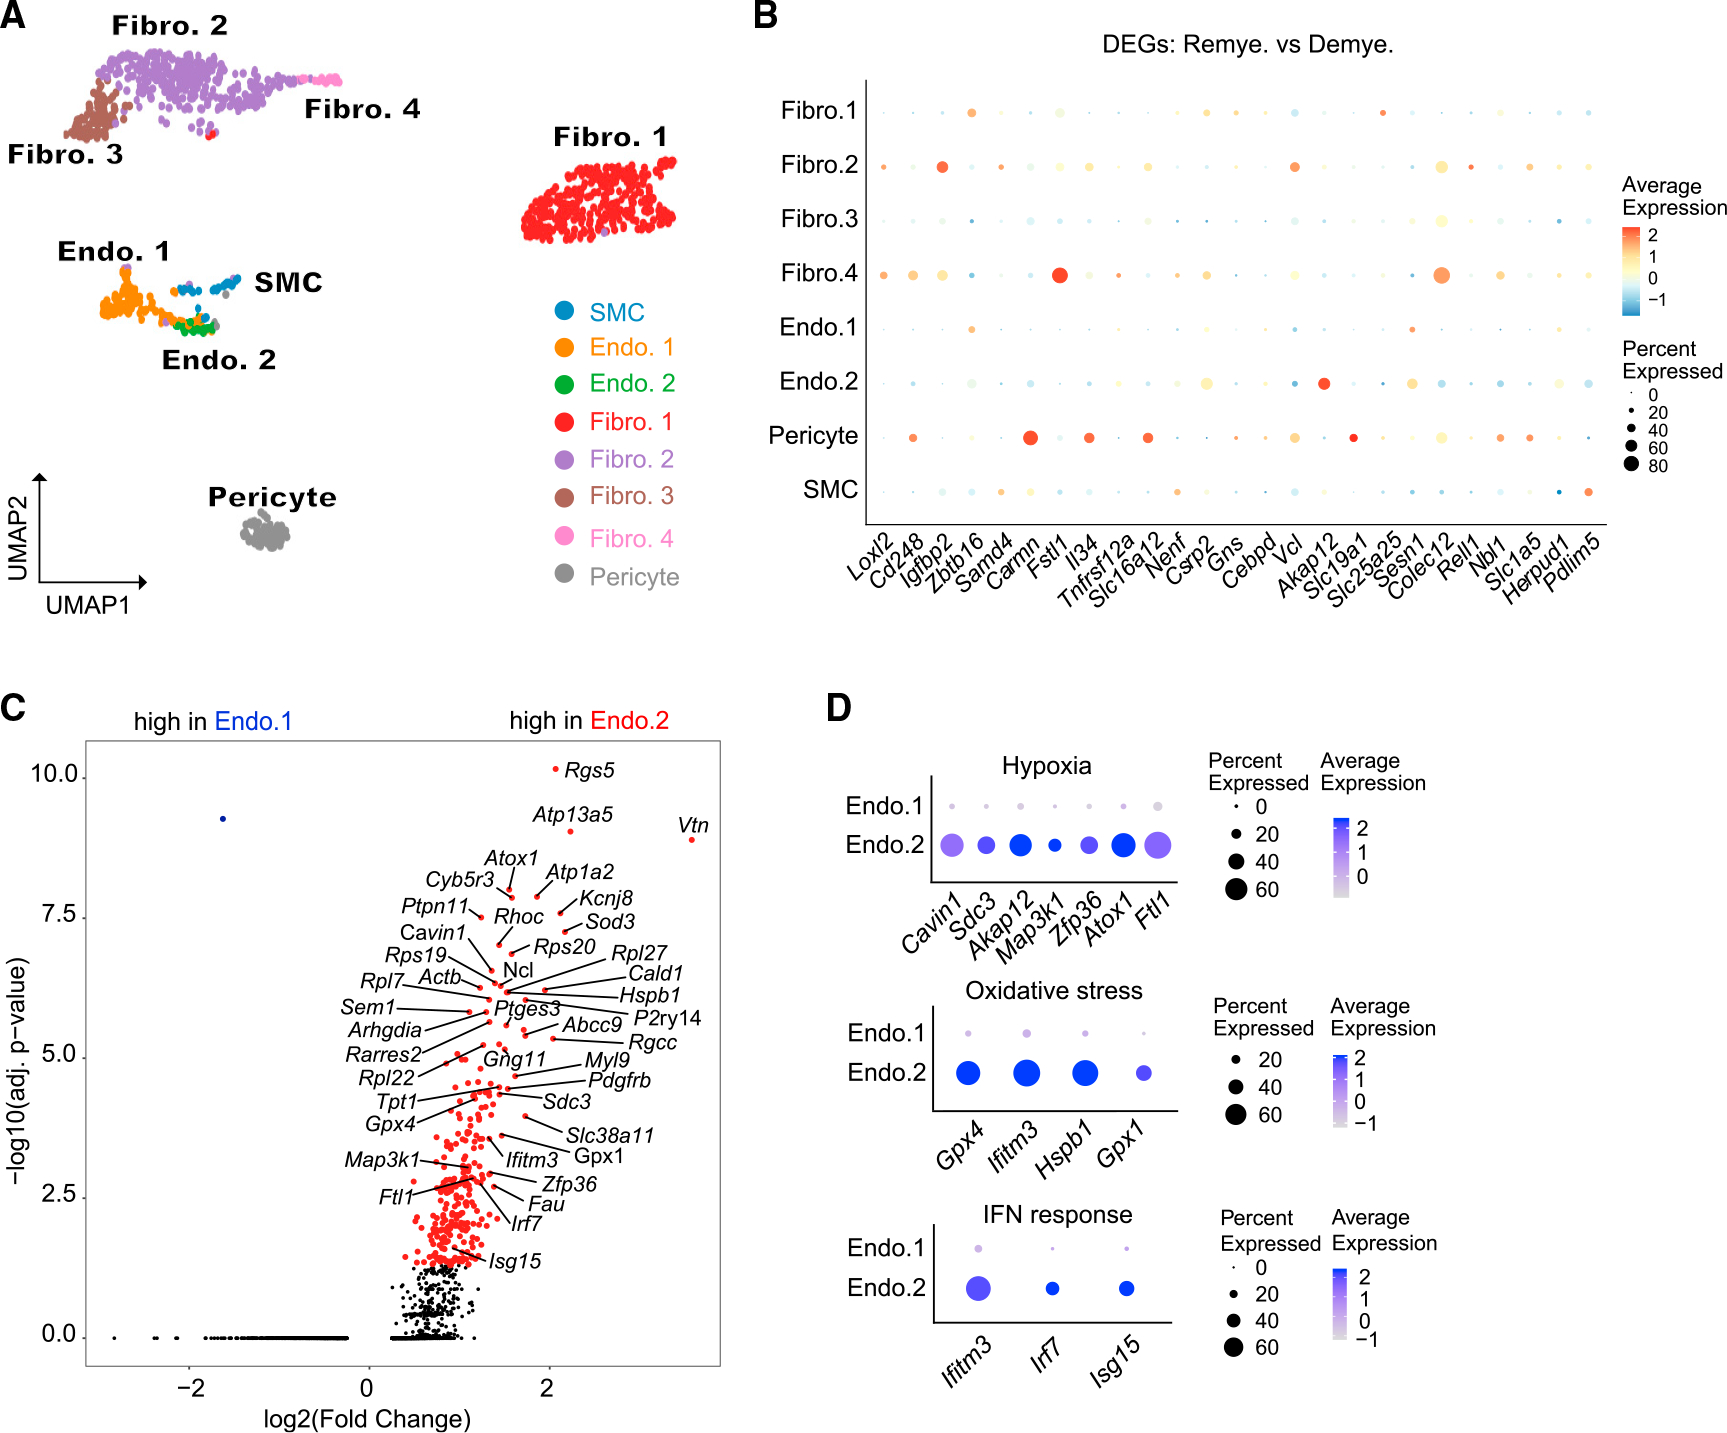
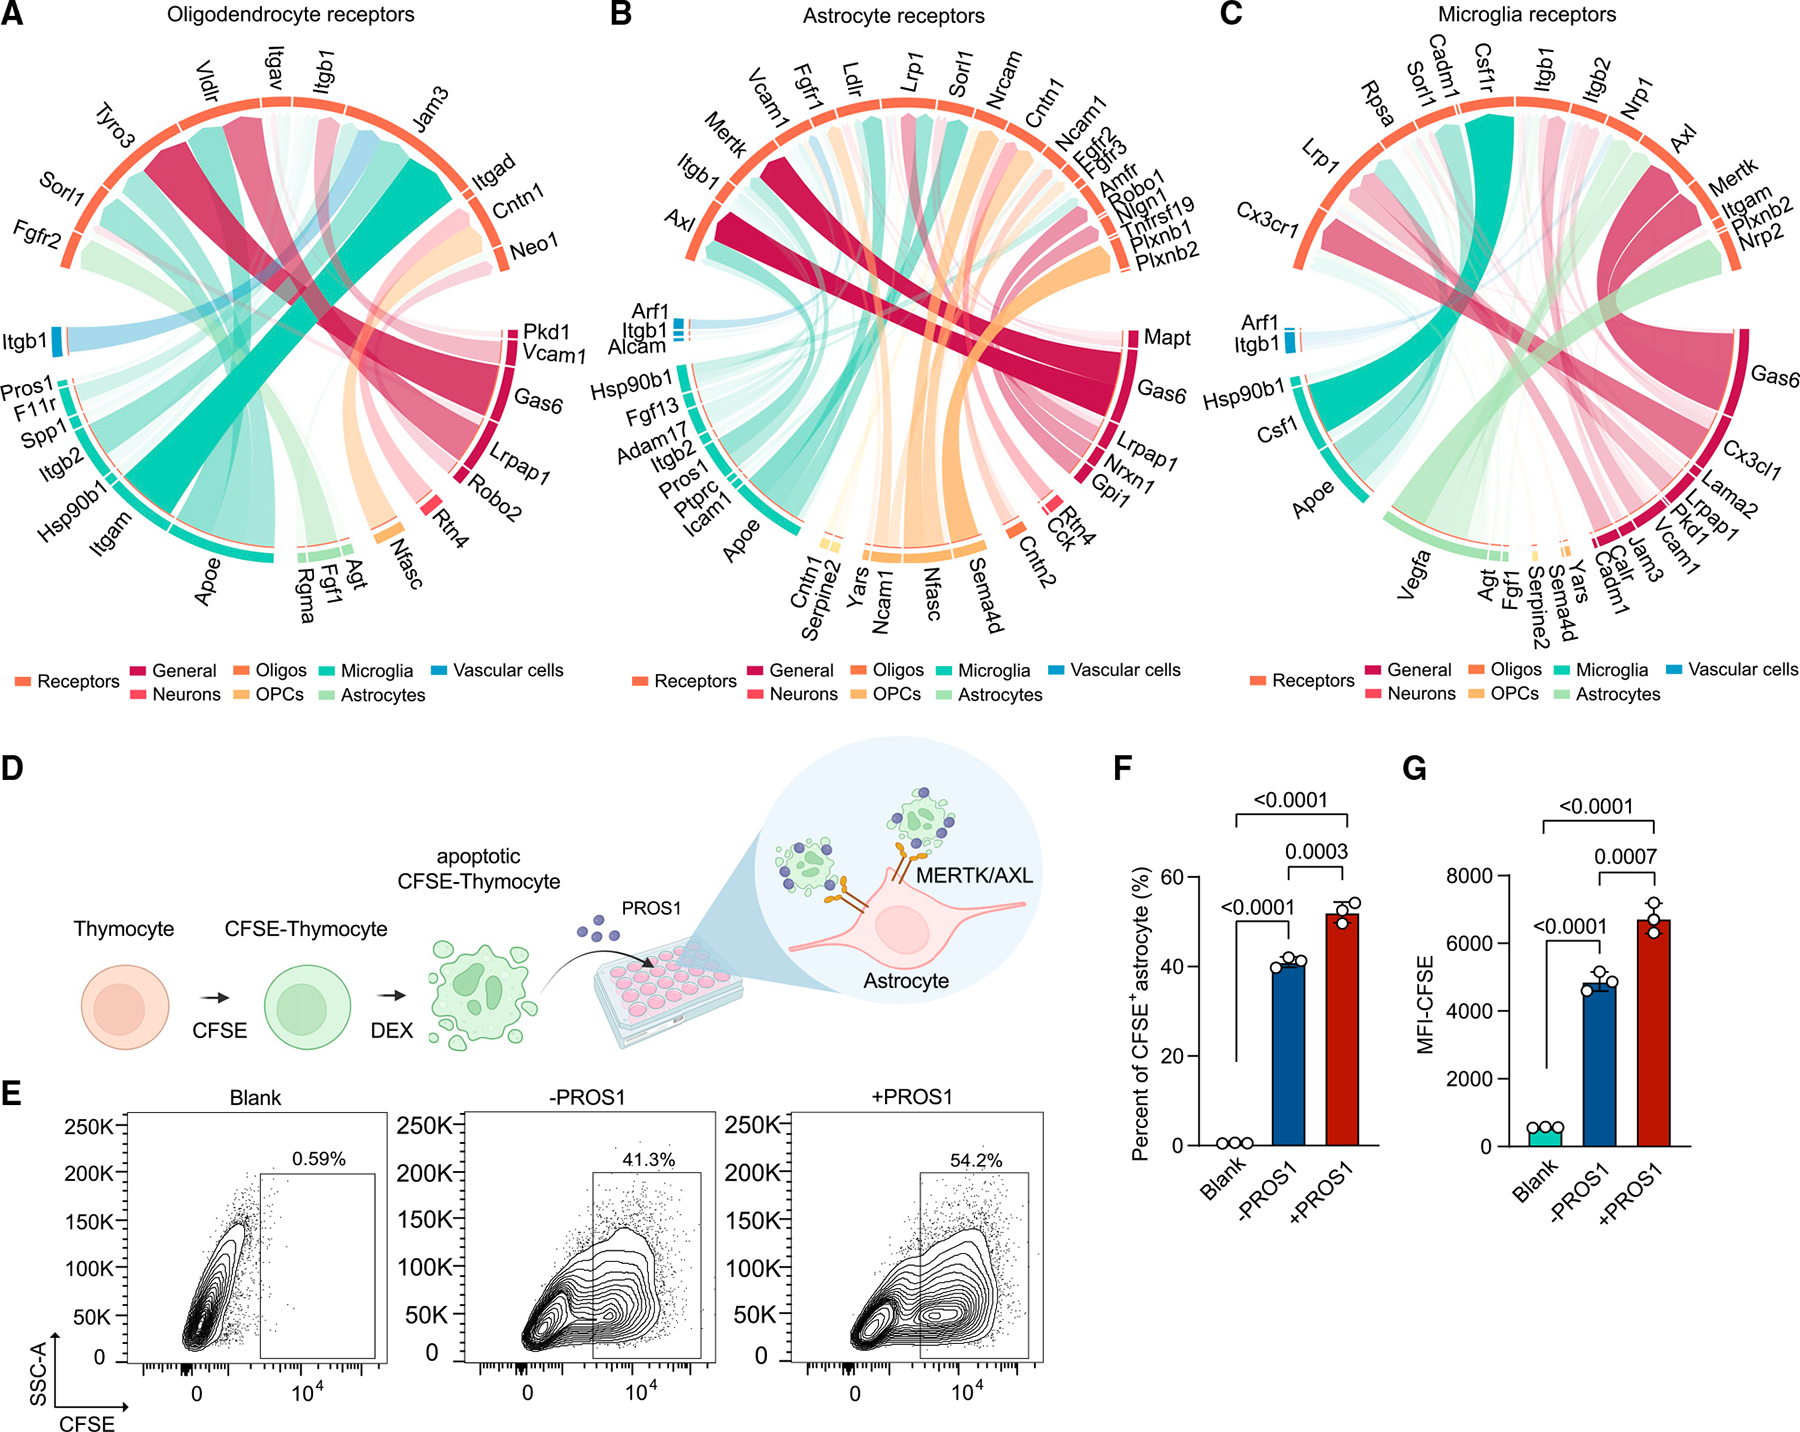
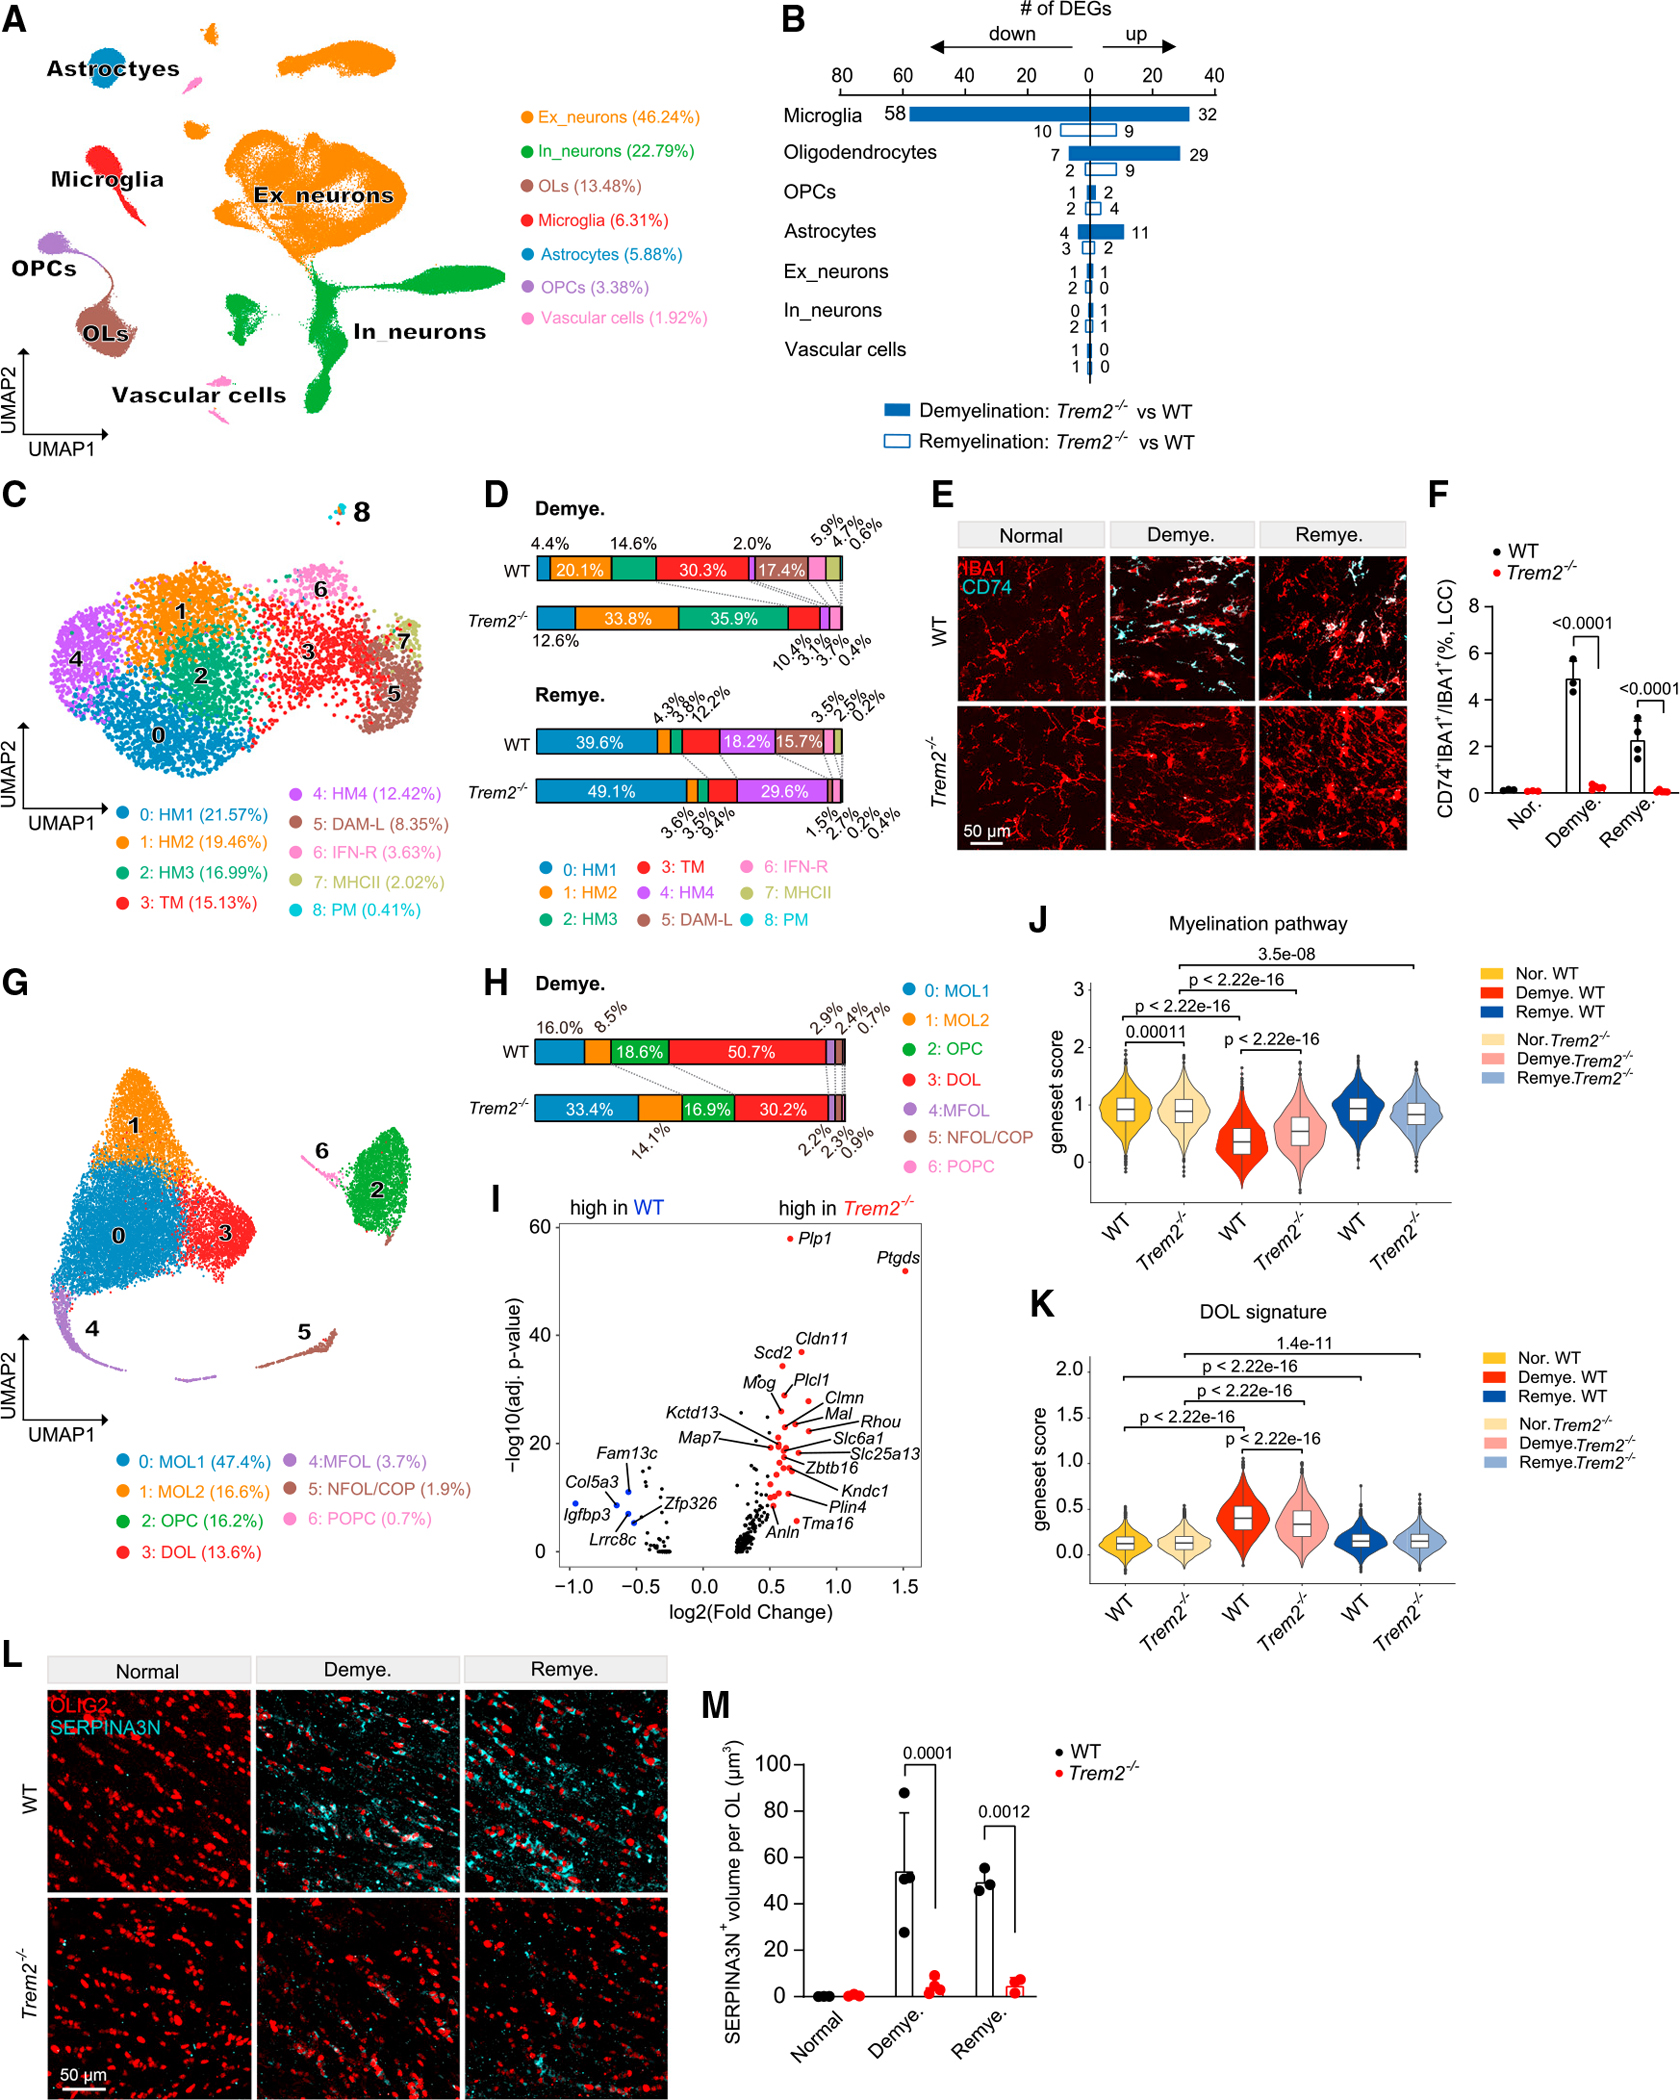
Demyelination is a hallmark of multiple sclerosis, leukoencephalopathies, cerebral vasculopathies, and several neurodegenerative diseases. The cuprizone mouse model is widely used to simulate demyelination and remyelination occurring in these diseases. Here, we present a high-resolution single-nucleus RNA sequencing (snRNA-seq) analysis of gene expression changes across all brain cells in this model. We define demyelination-associated oligodendrocytes (DOLs) and remyelination-associated MAFBhi microglia, as well as astrocytes and vascular cells with signatures of altered metabolism, oxidative stress, and interferon response. Furthermore, snRNA-seq provides insights into how brain cell types connect and interact, defining complex circuitries that impact demyelination and remyelination. As an explicative example, perturbation of microglia caused by TREM2 deficiency indirectly impairs the induction of DOLs. Altogether, this study provides a rich resource for future studies investigating mechanisms underlying demyelinating diseases.

Keywords: CP: Neuroscience; IL-33; MAFB; TREM2; astrocytes; cuprizone; demyelination; microglia; oligodendrocytes; remyelination; single-nucleus RNA-seq.


Conflict of interest statement

Declaration of interests M.C. is a member of the scientific advisory board of Vigil, receives research support from Vigil, and is a consultant for CST.

Figures

Figure 1.
Figure 1.. CPZ-mediated myelin alterations induce global transcriptional changes
(A) Schematic diagram of the experimental strategy. (B) UMAP plot of 58,079 nuclei showing 19 distinguished clusters with cell-type identities determined by expression of specific markers. n = 2 mice in normal, n = 3 in demyelination, and n = 3 in remyelination condition. (C) Pie chart showing the frequency of each cell type across all conditions. (D) Cell-type compositional analysis across different conditions. Statistically credible changes, as tested by scCODA, are denoted with bars on top. n = 2 mice innormal, n = 3 in demyelination, and n = 3 in remyelination condition. (E) Number of differentially expressed genes (DEGs) in each cell type by pairwise comparisons between demyelination vs. normal (Demye. vs. Nor.), remyelinationvs. normal (Remye. vs. Nor.), or remyelination vs. demyelination (Remye. vs. Demye.). Log2(fold change) > 0.5, adjusted p < 0.05, non-parametric Wilcoxon rank-sum test, Bonferroni correction. See also Figure S1; Tables S1 and S2.
Figure 2.
Figure 2.. Demyelination induces SERPINA3N+ oligodendrocytes
(A) UMAP plot of reclustered oligodendrocyte lineage nuclei identifying eight subclusters. n = 7,251 oligodendrocyte lineage nuclei. (B) UMAP plot of oligodendrocyte subclusters split by condition. n = 2,572 nuclei in normal, n = 1,839 nuclei in demyelination, and n = 2,840 nuclei in remyelination. (C) Subcluster compositional analysis across different conditions. Statistically credible changes, as tested by scCODA, are denoted with bars on top. n = 2 mice in normal, n = 3 in demyelination, and n = 3 in remyelination condition. (D) Volcano plot showing significant DEGs in DOLs (subcluster 3) vs. MOLs/MFOLs (subclusters 0, 2, 4, 5). Log2(fold change) > 0.5, adjusted p < 0.05, non-parametric Wilcoxon rank-sum test, Bonferroni correction. (E) Pathways enriched in MOLs/MFOLs (left panel) and DOLs (right panel). p value by hypergeometric test. (F) Representative immunofluorescence (IF) images of SERPINA3N and CC1 staining in the medial corpus callosum (MCC) in each condition. CC1, green;SERPINA3N, red; DAPI, blue. Scale bar, 50 μm. (G) Quantification of SERPINA3N+CC1+/CC1+ ratio across different conditions. p value by one-way ANOVA with Tukey’s multiple comparisons test. Data are presented as mean ± SD. n = 3 mice/condition. (H) Integration of oligodendrocyte lineage cells from Marques et al. and the current CPZ dataset. UMAP plot split by datasets. (I) Dot plot of marker genes enriched in each subpopulation of the integrated data in (H). (J) UMAP plot of oligodendrocyte lineage cells overlaid with the RNA velocity streamlines derived from the basic model, colored by annotated subcluster (left). Corresponding velocity pseudo-time shown on the right. One sample per condition is shown. See also Figures S2 and S3; Table S2.
Figure 3.
Figure 3.. Astrocytes adopt distinct stress-response signatures in demyelination and remyelination
(A) UMAP plot showing the astrocyte cluster (cluster 7 in Figure 1B), and relative frequency across different conditions. (B and C) Heatmap showing average expression of top astrocyte DEGs upregulated in demyelination vs. normal (B) and in remyelination vs. demyelination (C). Log2(fold change) > 0.5, adjusted p < 0.05, non-parametric Wilcoxon rank-sum test, Bonferroni correction. Each column represents one sample. Color scheme represents row Z score. (D) UMAP plot of reclustered astrocytes identifying nine subclusters. n = 3,305 astrocyte nuclei. (E) UMAP plot of astrocyte subclusters split by condition. n = 1,114 astrocyte nuclei in normal, n = 986 in demyelination, and n = 1,205 in remyelination. (F) Subcluster compositional analysis across different conditions. Statistically credible changes, as tested by scCODA, are denoted with bars on top. n = 2 mice in normal, n = 3 in demyelination, and n = 3 in remyelination condition. (G) Volcano plot showing subcluster 7 marker genes. (H) Representative IF images showing colocalization of SERPINA3N and GFAP in lateral CC in each condition. SERPINA3N, red; GFAP, green; DAPI, blue. Scalebar, 50 μm. (I) Quantification of SERPINA3N+GFAP+/GFAP+ ratio across different conditions. Data are presented as mean ± SD. n = 3–4 mice/condition. (J) Volcano plot showing subcluster 8 marker genes. (K) Representative IF images showing colocalization of STAT1 and GFAP in LCC in each condition. STAT1, red; GFAP, green; DAPI, blue. Scale bar, 50 μm. (L) Quantification of STAT1+GFAP+/GFAP+ ratio across different conditions. Data are presented as mean ± SD. n = 3–5 mice/condition. (M) Volcano plot showing DEGs of subcluster 2 vs. subclusters 0 and 1. Adjusted p values by non-parametric Wilcoxon rank-sum test, Bonferroni correction (G, J, and M). p values by one-way ANOVA with Tukey’s multiple comparisons test (I and L). See also Figure S4 and Table S2.
Figure 4.
Figure 4.. MAFBhi microglia emerge in remyelination
(A) UMAP plot of reclustered microglia identifying nine subclusters. n = 4,736 microglial nuclei. (B) UMAP plot of microglia subclusters split by condition. n = 510 nuclei in normal, n = 2,450 nuclei in demyelination, and n = 1,776 nuclei in remyelination. (C) Subcluster compositional analysis across different conditions. Statistically credible changes, as tested by scCODA, are denoted with bars on top. n = 2 mice in normal, n = 3 in demyelination, and n = 3 in remyelination condition. (D) Venn diagram depicting overlap between the top 100 markers of microglia subcluster 2 (DAM-L) and the top 71 signature genes of DAM identified in the 5XFADmodel. Gene sets used are listed in Table S3. (E) UMAP plot showing the DAM signature score calculated using the top 71 signature genes of DAM. (F) Violin plot showing DAM gene set score in each condition. p value by Wilcoxon test. (G) Venn diagram depicting overlap between the top 100 markers of microglia subcluster 2 (DAM-L) and the top 100 signature genes of white matter associatedmicroglia (WAM) from Safaiyan et al. Gene sets used are listed in Table S3. (H) UMAP plot showing the WAM score calculated using the top 100 signature genes of WAM. (I) Violin plot showing WAM gene set score in each condition. p value by Wilcoxon test. (J) UMAP plots showing expression pattern of Ccl4, Itgax, Gpnmb, and Ch25h in microglia subclusters. (K) UMAP plots showing expression pattern of Mitf and Plau in microglia subclusters. (L) Scatter plot showing subcluster 3 marker genes. Adjusted p value by non-parametric Wilcoxon rank-sum test, Bonferroni correction. (M) Violin plot of microglial expression of Mafb in each condition. p value by Wilcoxon test. (N) Venn diagram of overlap between top 94 markers of “microglia inflamed in multiple sclerosis”-foamy (MIMS-foamy) from Absinta et al. and top 100 genes upregulated in microglia in remyelination vs. normal in the mouse CPZ model. Overlapping genes are listed on the side. Gene sets used are listed in Table S3. (O) Venn diagram of overlap between top 86 genes upregulated in microglia from patients with early active MS from Masuda et al. and top 100 genes upregulated in microglia in remyelination vs. normal in the mouse CPZ model. Overlapping genes are listed on the side. Gene sets used are listed in Table S3. (P) Representative IF images showing staining of MAFB and IBA1 in the MCC in each condition. IBA1, green; MAFB, red; DAPI, blue. Scale bar, 50 μm. See also Figure S5; Tables S2 and S3.
Figure 5.
Figure 5.. Remyelination is associated with reprogramming of vascular cells
(A) UMAP plot of reclustered vascular cells identifying fibroblasts (Fibro.1–4), endothelial cells (Endo.1 and Endo.2), smooth muscle cells (SMC), and pericytes. n = 1,062 vascular nuclei. n = 2 mice in normal, n = 3 in demyelination, and n = 3 in remyelination condition. (B) Dot plot showing expression of top DEGs between remyelination and demyelination in each subcluster. (C) Volcano plot showing significant DEGs between Endo.2 and Endo.1. Log2(fold change) > 0.5, adjusted p < 0.05, non-parametric Wilcoxon rank-sum test, Bonferroni correction. (D) Dot plot showing expression of DEGs (from C) involved in hypoxia, oxidative stress, and IFN-response pathways across Endo.1 and Endo.2. See also Figure S6 and Table S2.
Figure 6.
Figure 6.. NicheNet analysis reveals cell-cell interactions elicited by demyelination
(A–C) Circos plot showing links between predicted ligands from sender cells (bottom) with their associated receptors on receiver cells (top, tomato). Width and transparency of the blocks represent the prior interaction weight of the ligand-receptor interactions. Colors on the lower part of the plots represent cell types where ligands are mostly derived from: dark red, ligands expressed in multiple cell types (general); dark orange, neurons; orange, oligodendrocytes; light orange, OPCs; dark green, microglia; light green, astrocytes; dark blue, vascular cells. (D) Schematic of the assessment of astrocyte phagocytosis. DEX, dexamethasone. Created with BioRender.com. (E) Representative flow-cytometry plots showing CFSE+ phagocytic astrocytes. Numbers indicate percentage of cells in the indicated gates. (F and G) Quantification of the phagocytic astrocytes by percentage of CFSE+ astrocytes (F) and CFSE mean fluorescence intensity (MFI) (G). Astrocytes without thymocyte incubation were included as blank control. Data are presented as mean ± SD. p value by one-way ANOVA with Tukey’s multiple comparisons test. n = 3 cell culture wells per group. Experiment was repeated three times. See also Figure S7.
Figure 7.
Figure 7.. TREM2 deficiency indirectly impairs DOL induction
(A) UMAP plot of 117,729 nuclei showing seven distinguished cell types of Trem2−/− mice and littermate WT controls. n = 3 mice per genotype per condition. (B) Number of DEGs between Trem2−/− and WT mice in demyelination and remyelination. Log2(fold change) > 0.5, adjusted p < 0.05, non-parametric Wilcoxon rank-sum test, Bonferroni correction. (C) UMAP plot of reclustered microglia. n = 5,567 total nuclei. n = 619 nuclei in normal WT, n = 594 nuclei in normal Trem2−/−, n = 1,848 nuclei in demyelination WT, n = 1,121 nuclei in demyelination Trem2−/−, n = 866 nuclei in remyelination WT, n = 519 nuclei in remyelination Trem2−/−. (D) Distribution of microglia subsets in demyelination and remyelination across WT and Trem2−/− mice. (E) Representative IF images of CD74 and IBA1 staining in the LCC of Trem2−/− and WT mice in each condition. CD74, cyan; IBA1, red. Scale bar, 50 μm. (F) Quantification of CD74+IBA1+/IBA1+ ratio in LCC across different conditions. n = 3–5 mice per genotype per condition. Data are presented as mean ± SD. p value by two-way ANOVA with Tukey’s multiple comparisons test. (G) UMAP plot of reclustered oligodendrocyte lineage cells. n = 19,523 total nuclei. n = 3,939 nuclei in normal WT, n = 4,013 nuclei in normal Trem2−/−, n = 2,966 nuclei in demyelination WT, n = 2,964 nuclei in demyelination Trem2−/−, n = 3,468 nuclei in remyelination WT, n = 2,173 nuclei in remyelination Trem2−/−. (H) Distribution of oligodendrocyte lineage subsets in demyelination across WT and Trem2−/−. (I) Volcano plot showing DEGs of mature oligodendrocytes in Trem2−/− vs. WT during demyelination. Log2(fold change) > 0.5, adjusted p < 0.05, non-parametric Wilcoxon rank-sum test, Bonferroni correction. (J and K) Violin plots showing myelination pathway gene set score (J) and DOL signature score (K) in the oligodendrocytes in each condition. p value by Wilcoxon test. Gene sets used are listed in Table S3. (L) Representative IF images of SERPINA3N and OLIG2 staining in the MCC of Trem2−/− and WT mice in each condition. SERPINA3N, cyan; OLIG2, red. Scale bar, 50 μm. (M) Quantification of SERPINA3N+ volume per OLIG2+ oligodendrocyte in MCC across different conditions. Data are presented as mean ± SD. p value by two-way ANOVA with Tukey’s multiple comparisons test. n = 3–4 mice per genotype per condition. See also Figures S8 and S9; Table S3, Tables S4 and S5.

References

    1. Franklin RJM, and Ffrench-Constant C (2017). Regenerating CNSmyelin - from mechanisms to experimental medicines. Nat. Rev. Neurosci. 18, 753–769. 10.1038/nrn.2017.136. - DOI - PubMed
    1. Lassmann H (2018). Multiple sclerosis pathology. Cold Spring Harb. Perspect. Med. 8, a028936. 10.1101/cshperspect.a028936. - DOI - PMC - PubMed
    1. Sarbu N, Shih RY, Jones RV, Horkayne-Szakaly I, Oleaga L, and Smirniotopoulos JG (2016). White matter diseases with radiologic-pathologic correlation. Radiographics 36, 1426–1447. 10.1148/rg.2016160031. - DOI - PubMed
    1. Nave KA (2010). Myelination and support of axonal integrity by glia. Nature 468, 244–252. 10.1038/nature09614. - DOI - PubMed
    1. Ihara M, Polvikoski TM, Hall R, Slade JY, Perry RH, Oakley AE, Englund E, O’Brien JT, Ince PG, and Kalaria RN (2010). Quantification of myelin loss in frontal lobe white matter in vascular dementia, Alzheimer’s disease, and dementia with Lewy bodies. Acta Neuropathol. 119, 579–589. 10.1007/s00401-009-0635-8. - DOI - PMC - PubMed

Publication types