Systematic screening versus clinical gestalt in the diagnosis of pulmonary embolism in COVID-19 patients in the emergency department
- PMID: 36952456
- PMCID: PMC10035852
- DOI: 10.1371/journal.pone.0283459
Systematic screening versus clinical gestalt in the diagnosis of pulmonary embolism in COVID-19 patients in the emergency department
Abstract
Background: Diagnosing concomitant pulmonary embolism (PE) in COVID-19 patients remains challenging. As such, PE may be overlooked. We compared the diagnostic yield of systematic PE-screening based on the YEARS-algorithm to PE-screening based on clinical gestalt in emergency department (ED) patients with COVID-19.
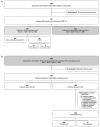
Methods: We included all ED patients who were admitted because of COVID-19 between March 2020 and February 2021. Patients already receiving anticoagulant treatment were excluded. Up to April 7, 2020, the decision to perform CT-pulmonary angiography (CTPA) was based on physician's clinical gestalt (clinical gestalt cohort). From April 7 onwards, systematic PE-screening was performed by CTPA if D-dimer level was ≥1000 ug/L, or ≥500 ug/L in case of ≥1 YEARS-item (systematic screening cohort).
Results: 1095 ED patients with COVID-19 were admitted. After applying exclusion criteria, 289 were included in the clinical gestalt and 574 in the systematic screening cohort. The number of PE diagnoses was significantly higher in the systematic screening cohort compared to the clinical gestalt cohort: 8.2% vs. 1.0% (3/289 vs. 47/574; p<0.001), even after adjustment for differences in patient characteristics (adjusted OR 8.45 (95%CI 2.61-27.42, p<0.001) for PE diagnosis). In multivariate analysis, D-dimer (OR 1.09 per 1000 μg/L increase, 95%CI 1.06-1.13, p<0.001) and CRP >100 mg/L (OR 2.78, 95%CI 1.37-5.66, p = 0.005) were independently associated with PE.
Conclusion: In ED patients with COVID-19, the number of PE diagnosis was significantly higher in the cohort that underwent systematic PE screening based on the YEARS-algorithm in comparison with the clinical gestalt cohort, with a number needed to test of 7.1 CTPAs to detect one PE.
Copyright: © 2023 Luu et al. This is an open access article distributed under the terms of the Creative Commons Attribution License, which permits unrestricted use, distribution, and reproduction in any medium, provided the original author and source are credited.
Conflict of interest statement
I have read the journal’s policy and the authors of this manuscript have the following competing interests: H.C. has received research grants from Bayer and Pfizer and consulting fees from Alveron, has participated on advisory boards for Galapagos, Alexion, and Viatris, and is a stockholder with Coagulation Profile, outside the submitted work. R.L.M.M. has participated on advisory boards for Boehringer-Ingelheim and Galapagos, outside the submitted work. D.J.L.T. has received research grants from Bayer and honoraria for lectures from Bayer and Amgen, and has participated on advisory boards for AstraZeneca and Sanofi, outside the submitted work. I.H.Y.L., T.F., J.B., J.K., M.D.K., G.J.M.M., R.J.H.M., and M.P.G.L. declare no competing interests. This does not alter our adherence to PLOS ONE policies on sharing data and materials.
Figures


References
MeSH terms
Substances
LinkOut - more resources
Full Text Sources
Medical
Research Materials
Miscellaneous

