. 2023 May;12(9):10990-11009.
doi: 10.1002/cam4.5807. Epub 2023 Mar 23.

Nucleoporin 107 is a prognostic biomarker in hepatocellular carcinoma associated with immune infiltration

Affiliations

Nucleoporin 107 is a prognostic biomarker in hepatocellular carcinoma associated with immune infiltration

Ju-Sen Nong et al. Cancer Med. 2023 May.

Abstract

Objective: To assess the diagnostic value and clinical significance of nucleoporin 107 (NUP107) in hepatocellular carcinoma (HCC), and explore the possible mechanisms.

Methods: The transcriptomic and clinical data of HCC patients were retrieved from The Cancer Genome Atlas (TCGA) and GEO databases. Tissue specimens were collected from HCC patients in the Guangxi area. According to the expression levels and prognostic characteristics of NUP107, ROC curves and nomogram models were constructed using the R package.

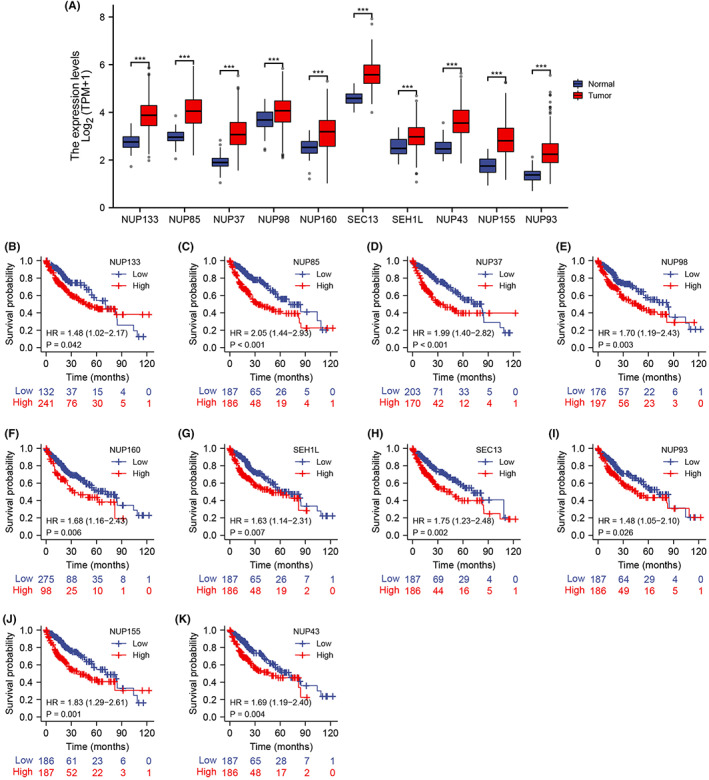
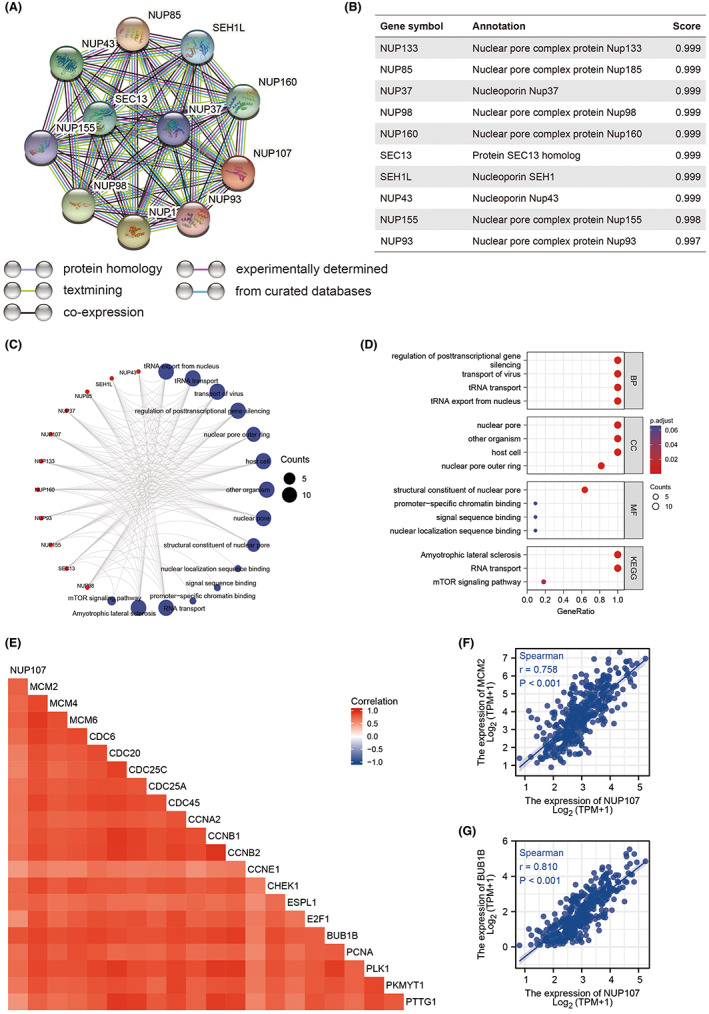
Results: NUP107 was highly expressed in 26 human cancers including HCC, and was associated with advanced HCC staging and worse prognosis. NUP107 showed satisfactory ability to predict the prognosis of HCC patients (AUC >0.8). Results of gene set enrichment analysis (GSEA) further showed that NUP107 was mainly associated with cell cycle-related pathways such as the cell cycle, DNA replication, G2M checkpoint, E2F target, and mitotic spindle. In addition, NUP107 was also associated with immune infiltration in HCC and showed significant positive correlation with immune checkpoints (PD-L1 and TIM-3).

Keywords: cell cycle; hepatocellular carcinoma; immune cells; immune checkpoints; nucleoporin 107 (NUP107).


Conflict of interest statement

The authors have declared that there are no competing interests.

Figures

FIGURE 1
FIGURE 1
Nucleoporin 107 (NUP107) is highly expressed in human cancers and hepatocellular carcinoma (HCC). (A) Expression levels of NUP107 in 31 different human cancers, ns: p ≥ 0.05; *p < 0.05; **p < 0.01; ***p < 0.001. (B) NUP107 expression profile in the cBioPortal OncoPrint plot. The expression levels of NUP107 in (C) 370 HCC tissues and 50 para‐carcinoma tissues in The Cancer Genome Atlas (TCGA) LIHC dataset, (D) 50 paired HCC tissues and para‐carcinoma tissues in TCGA LIHC dataset, (E) 106 HCC tissues and 106 para‐carcinoma tissues in GSE14520 dataset, (F) 115 HCC tissues and 52 para‐carcinoma tissues in GSE76427 dataset, (G) 70 HCC tissues and 37 para‐carcinoma tissues in GSE121248 dataset, (H) 81 HCC tissues and 11 para‐carcinoma tissues in GSE62232 dataset, (I) 39 HCC tissues and 30 para‐carcinoma tissues in GSE136247 dataset.
FIGURE 2
FIGURE 2
High expression of nucleoporin 107 (NUP107) was associated with more advanced hepatocellular carcinoma staging and poor prognosis. Dot plots show the expression levels of NUP107 in different T‐stages (A), pathological stages (B), histological grades (C), and AFP levels (D). Kaplan–Meier curves showing (E) overall survival (OS), (F) disease‐specific survival and (G) PFS in The Cancer Genome Atlas (TCGA), and (H) OS and (I) relapse‐free survival in GSE14520, * p < 0.05; ** p < 0.01; *** p < 0.001.
FIGURE 3
FIGURE 3
Prognostic value of nucleoporin 107 (NUP107) in hepatocellular carcinoma (HCC). (A) Univariate Cox regression model. (B) Multivariate Cox regression model. Kaplan–Meier survival curves of NUP107high and NUP107low patients in (C) male, (D) female, (E) T1 and T2, (F) T3 and T4, (G) stage I and II, (H) stage III and IV, (I) vascular invasion, and (J) non‐vascular invasion subgroups.
FIGURE 4
FIGURE 4
Predictive ability of nucleoporin 107 (NUP107) for hepatocellular carcinoma (HCC). (A–F) Diagnostic ROC curves in The Cancer Genome Atlas (TCGA), GSE14520, GSE76427, GSE121248, GSE62232, and GSE136247. (G) Scatter plot of survival status and NUP107 expression heat map corresponding to HCC patients sorted by risk score. (H) Predictive power of NUP107 for 1‐, 3‐, and 5‐year overall survival (OS) in HCC patients by time‐dependent ROC analysis. (I) Prediction of 1‐, 3‐, and 5‐year OS by column line plots. (J) Calibration plots were used to validate the column line graph model.
FIGURE 5
FIGURE 5
Identification and functional annotation of differentially expressed gene (DEGs). (A) Volcano plot showing the DEGs between NUP107high and NUP107low groups. (B) Heat map showing the top five upregulated and downregulated genes. (C) Bubble plot of the significantly enriched Gene Ontology (GO) terms and Kyoto Encyclopedia of Genes and Genomes (KEGG) pathways. (D) Circle diagram showing the GO and KEGG terms corresponding to the DEGs.
FIGURE 6
FIGURE 6
Validation of nucleoporin 107 (NUP107) in liver cancer patients in Guangxi. (A) Representative immunohistochemistry (IHC) images showing in situ expression of NUP107 in hepatocellular carcinoma (HCC) and adjacent liver tissues. (B) Violin chart showing the immunostaining scores of NUP107 in HCC and adjacent liver tissues in the Guangxi cohort. (C) Diagnostic ROC curve of NUP107 for the Guangxi cohort. (D) Expression level of NUP107 in the different BCLC stages.
FIGURE 7
FIGURE 7
Enrichment plots and normalized enrichment score (NES) visualization of gene set enrichment analysis. (A) Bar graph showing the NES values of the top five Kyoto Encyclopedia of Genes and Genomes (KEGG) pathways positively and negatively correlated with nucleoporin 107 (NUP107). Enrichment plots showing the top five (B) positively and (C) negatively correlated KEGG pathways. (D) Bar graphs showing the NES values of the top five HALLMARK pathways positively and negatively correlated with NUP107. Enrichment plots showing the top five (E) positively and (F) negatively associated HALLMARK pathways.
FIGURE 8
FIGURE 8
(A) Expression levels of 10 functional partners of nucleoporin 107 in hepatocellular carcinoma (HCC) and para‐carcinoma tissues. Survival curves of HCC patients in The Cancer Genome Atlas cohort demarcated in the basis of (B) NUP133, (C) NUP85, (D) NUP37, (E) NUP98, (F) NUP160, (G) SHE1L, (H) SEC13, (I) NUP93, (J) NUP155, and (K) NUP43 expression. * p < 0.05; ** p < 0.01; *** p < 0.001.
FIGURE 9
FIGURE 9
Nucleoporin 107 (NUP107) and its related genes are strongly correlated with cell cycle genes in HCC. (A) PPI network of NUP107‐related genes. (B) Annotation and correlation coefficients of 10 NUP107‐related genes. (C, D) Enriched GO terms and KEGG pathways for the NUP107‐related genes. (E) Correlation matrix showing the correlation between NUP107 and cell cycle regulatory genes including (F) BUB1B and (G) MCM2.
FIGURE 10
FIGURE 10
Correlation between nucleoporin 107 (NUP107) expression and immune infiltration in hepatocellular carcinoma. (A, B) Violin plots showing the degree of infiltration of different immune cells in the NUP107high and NUP107low groups. (C) Bubble plots showing the correlation between NUP107 and different immune cells. (D–G) Scatter plots showing the correlation between NUP107 expression levels and (D) Th2 cells, (E) T helper cells, (F) cytotoxic T cells, and (G) plasma DCs. ns: p ≥ 0.05; * p < 0.05; ** p < 0.01; *** p < 0.001.

Similar articles

Cited by

References

    1. Bray F, Ferlay J, Soerjomataram I, Siegel RL, Torre LA, Jemal A. Global cancer statistics 2018: GLOBOCAN estimates of incidence and mortality worldwide for 36 cancers in 185 countries. CA Cancer J Clin. 2018;68(6):394‐424. - PubMed
    1. Sung H, Ferlay J, Siegel RL, et al. Global cancer statistics 2020: GLOBOCAN estimates of incidence and mortality worldwide for 36 cancers in 185 countries. CA Cancer J Clin. 2021;71(3):209‐249. - PubMed
    1. Yang JD, Hainaut P, Gores GJ, Amadou A, Plymoth A, Roberts LR. A global view of hepatocellular carcinoma: trends, risk, prevention and management. Nat Rev Gastroenterol Hepatol. 2019;16(10):589‐604. - PMC - PubMed
    1. Fitzmaurice C, Allen C, Barber RM, et al. Global, regional, and national cancer incidence, mortality, years of life lost, years lived with disability, and disability‐adjusted life‐years for 32 cancer groups, 1990 to 2015: a systematic analysis for the global burden of disease study. JAMA Oncol. 2017;3(4):524‐548. - PMC - PubMed
    1. Bull CJ, Bell JA, Murphy N, et al. Adiposity, metabolites, and colorectal cancer risk: mendelian randomization study. BMC Med. 2020;18(1):396. - PMC - PubMed

Publication types