

Estimating pulsatile ocular blood volume from intraocular pressure, ocular pulse amplitude, and axial length
- PMID: 36952489
- PMCID: PMC10035833
- DOI: 10.1371/journal.pone.0283387
Estimating pulsatile ocular blood volume from intraocular pressure, ocular pulse amplitude, and axial length
Abstract
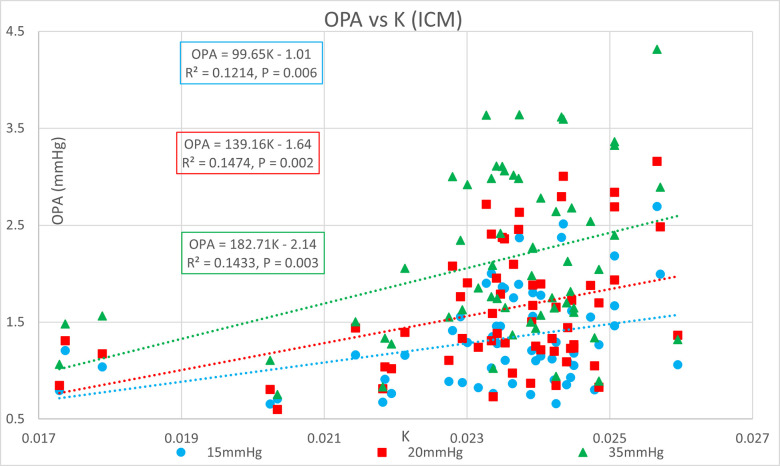
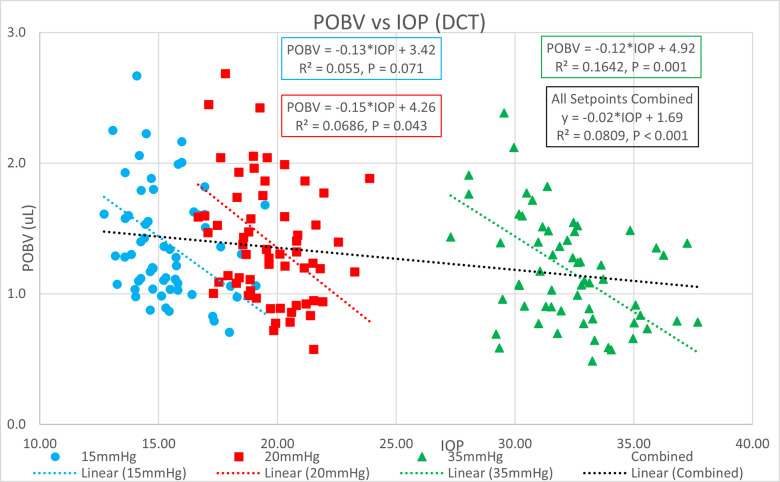
The purpose of this study was to develop a method of estimating pulsatile ocular blood volume (POBV) from measurements taken during an ophthalmic exam, including axial length and using a tonometer capable of measuring intraocular pressure (IOP) and ocular pulse amplitude (OPA). Unpublished OPA data from a previous invasive study was used in the derivation, along with central corneal thickness (CCT) and axial length (AL), as well as IOP from the PASCAL dynamic contour tonometer (DCT) and intracameral (ICM) measurements of IOP for 60 cataract patients. Intracameral mean pressure was set to 15, 20, and 35 mmHg (randomized sequence) in the supine position, using a fluid-filled manometer. IOP and OPA measurements were acquired at each manometric setpoint (DCT and ICM simultaneously). In the current study, ocular rigidity (OR) was estimated using a published significant relationship of OR to the natural log of AL in which OR was invasively measured through fluid injection. Friedenwald's original pressure volume relationship was then used to derive the estimated POBV, delivered to the choroid with each heartbeat as a function of OR, systolic IOP (IOPsys), diastolic IOP (IOPdia), and OPA, according to the derived equation POBV = log (IOPsys/IOPdia) / OR. Linear regression analyses were performed comparing OPA to OR and calculated POBV at each of the three manometric setpoints. POBV was also compared to OPA/IOPdia with all data points combined. Significance threshold was p < 0.05. OR estimated from AL showed a significant positive relationship to OPA for both DCT (p < 0.011) and ICM (p < 0.006) at all three manometric pressure setpoints, with a greater slope for lower IOP. Calculated POBV also showed a significant positive relationship to OPA (p < 0.001) at all three setpoints with greater slope at lower IOP, and a significant negative relationship with IOPdia. In the combined analysis, POBV showed a significant positive relationship to OPA/ IOPdia (p < 0.001) in both ICM and DCT measurements with R2 = 0.9685, and R2 = 0.9589, respectively. POBV provides a straight-forward, clinically applicable method to estimate ocular blood supply noninvasively. Higher IOP in combination with lower OPA results in the lowest values of POBV. The simplified ratio, OPA/ IOPdia, may also provide a useful clinical tool for evaluating changes in ocular blood supply in diseases with a vascular component, such as diabetic retinopathy and normal tension glaucoma. Future studies are warranted.
Copyright: © 2023 Somogye et al. This is an open access article distributed under the terms of the Creative Commons Attribution License, which permits unrestricted use, distribution, and reproduction in any medium, provided the original author and source are credited.
Conflict of interest statement
Dr. C. Roberts is a consultant to Ziemer Ophthalmic Systems AG.(relevant) and Oculus Optikgeräte GmbH (not relevant). This does not alter adherence to PLOS ONE policies on sharing data and materials. The remaining authors have declared that no competing interests exist.
Figures


Similar articles
-
[Clinical evaluation of the Pascal dynamic contour tonometer].J Fr Ophtalmol. 2007 Mar;30(3):260-70. doi: 10.1016/s0181-5512(07)89588-x. J Fr Ophtalmol. 2007. PMID: 17417152 Clinical Trial. French.
-
Physiological diurnal variability and characteristics of the ocular pulse amplitude (OPA) with the dynamic contour tonometer (DCT-Pascal).Int Ophthalmol. 2007 Dec;27(6):357-60. doi: 10.1007/s10792-007-9161-7. Epub 2007 Oct 23. Int Ophthalmol. 2007. PMID: 17955180
-
Dynamic contour tonometry in primary open angle glaucoma and pseudoexfoliation glaucoma: factors associated with intraocular pressure and ocular pulse amplitude.Middle East Afr J Ophthalmol. 2013 Apr-Jun;20(2):158-62. doi: 10.4103/0974-9233.110606. Middle East Afr J Ophthalmol. 2013. PMID: 23741135 Free PMC article.
-
Ocular pulse amplitude before and after cataract surgery.Curr Eye Res. 2012 Feb;37(2):115-9. doi: 10.3109/02713683.2011.626910. Epub 2011 Oct 18. Curr Eye Res. 2012. PMID: 22007729
-
Review on Dynamic Contour Tonometry and Ocular Pulse Amplitude.Ophthalmic Res. 2015;55(2):91-8. doi: 10.1159/000441796. Epub 2015 Dec 10. Ophthalmic Res. 2015. PMID: 26650248 Review.
Cited by
-
Biomechanical and Vascular Metrics Between Eyes of Patients With Asymmetric Glaucoma and Symmetric Glaucoma.J Glaucoma. 2024 May 1;33(5):334-339. doi: 10.1097/IJG.0000000000002363. Epub 2024 Jan 9. J Glaucoma. 2024. PMID: 38194297 Free PMC article.
-
Automated eyeball volume measurement based on CT images using neural network-based segmentation and simple estimation.Sci Rep. 2024 Jul 2;14(1):15094. doi: 10.1038/s41598-024-64913-9. Sci Rep. 2024. PMID: 38956139 Free PMC article.
References
Publication types
MeSH terms
LinkOut - more resources
Full Text Sources
Medical
