

Software Application Profile: The daggle app-a tool to support learning and teaching the graphical rules of selecting adjustment variables using directed acyclic graphs
- PMID: 36952629
- PMCID: PMC10555701
- DOI: 10.1093/ije/dyad038
Software Application Profile: The daggle app-a tool to support learning and teaching the graphical rules of selecting adjustment variables using directed acyclic graphs
Abstract
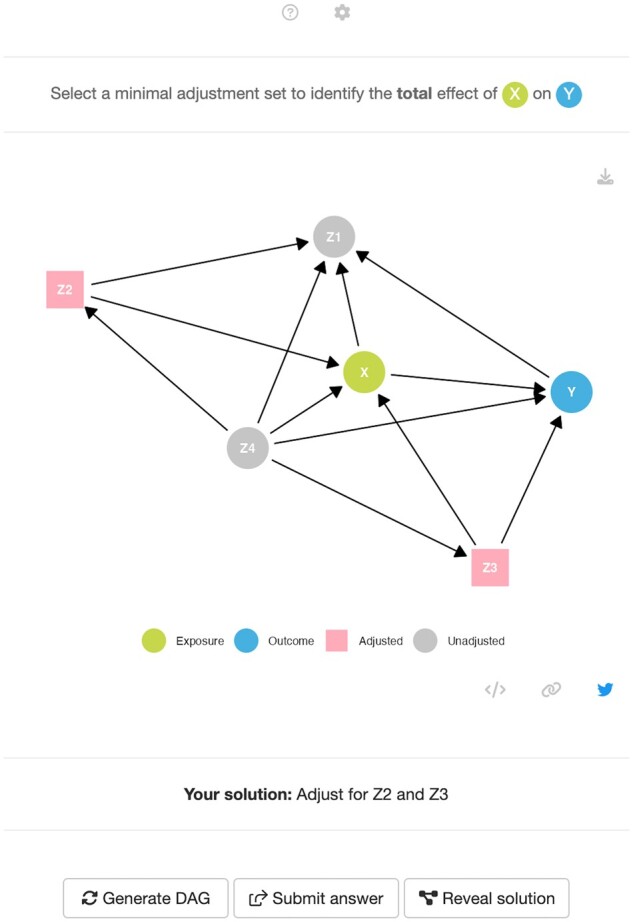
Motivation: Directed acyclic graphs (DAGs) are used in epidemiological research to communicate causal assumptions and guide the selection of covariate adjustment sets when estimating causal effects. For any given DAG, a set of graphical rules can be applied to identify minimally sufficient adjustment sets that can be used to adjust for bias due to confounding when estimating the causal effect of an exposure on an outcome. The daggle app is a web-based application that aims to assist in the learning and teaching of adjustment set identification using DAGs.
General features: The application offers two modes: tutorial and random. The tutorial mode presents a guided introduction to how common causal structures can be presented using DAGs and how graphical rules can be used to identify minimally sufficient adjustment sets for causal estimation. The random mode tests this understanding by presenting the user with a randomly generated DAG-a daggle. To solve the daggle, users must correctly identify a valid minimally sufficient adjustment set.
Implementation: The daggle app is implemented as an R shiny application using the golem framework. The application builds upon existing R libraries including pcalg to generate reproducible random DAGs, dagitty to identify all valid minimal adjustment sets and ggdag to visualize DAGs.
Availability: The daggle app can be accessed online at [http://cbdrh.shinyapps.io/daggle]. The source code is available on GitHub [https://github.com/CBDRH/daggle] and is released under a Creative Commons CC BY-NC-SA 4.0 licence.
Keywords: Directed acyclic graphs; confounding adjustment; teaching.
© The Author(s) 2023. Published by Oxford University Press on behalf of the International Epidemiological Association.
Conflict of interest statement
None declared.
Figures


References
-
- Pearl J. Causal diagrams for empirical research. Biometrika 1995;82:669–88.
-
- Greenland S, Pearl J, Robins JM.. Causal diagrams for epidemiologic research. Epidemiology 1999;37–48. - PubMed
-
- Etminan M, Collins GS, Mansournia MA.. Using causal diagrams to improve the design and interpretation of medical research. Chest 2020;158:S21–28. - PubMed
