. 2023 Jun 22;141(25):3091-3108.
doi: 10.1182/blood.2022018026.

Macrophage metabolic rewiring improves heme-suppressed efferocytosis and tissue damage in sickle cell disease

Affiliations

Macrophage metabolic rewiring improves heme-suppressed efferocytosis and tissue damage in sickle cell disease

Richa Sharma et al. Blood. .

Abstract

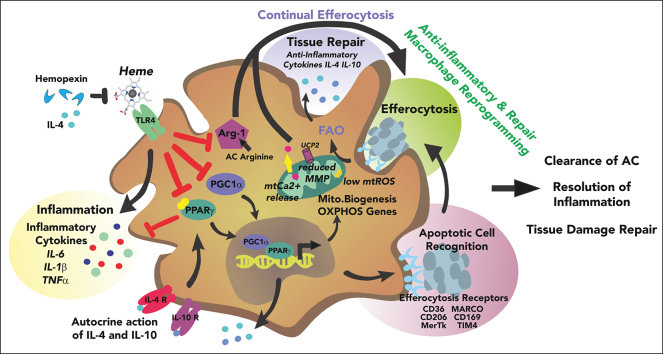
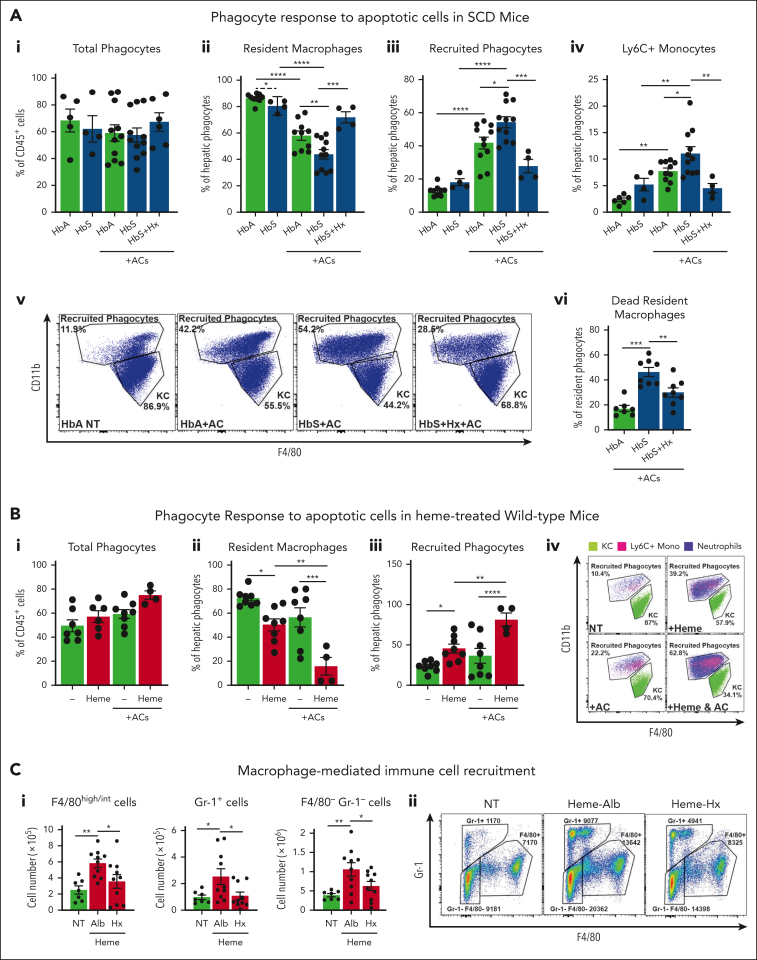
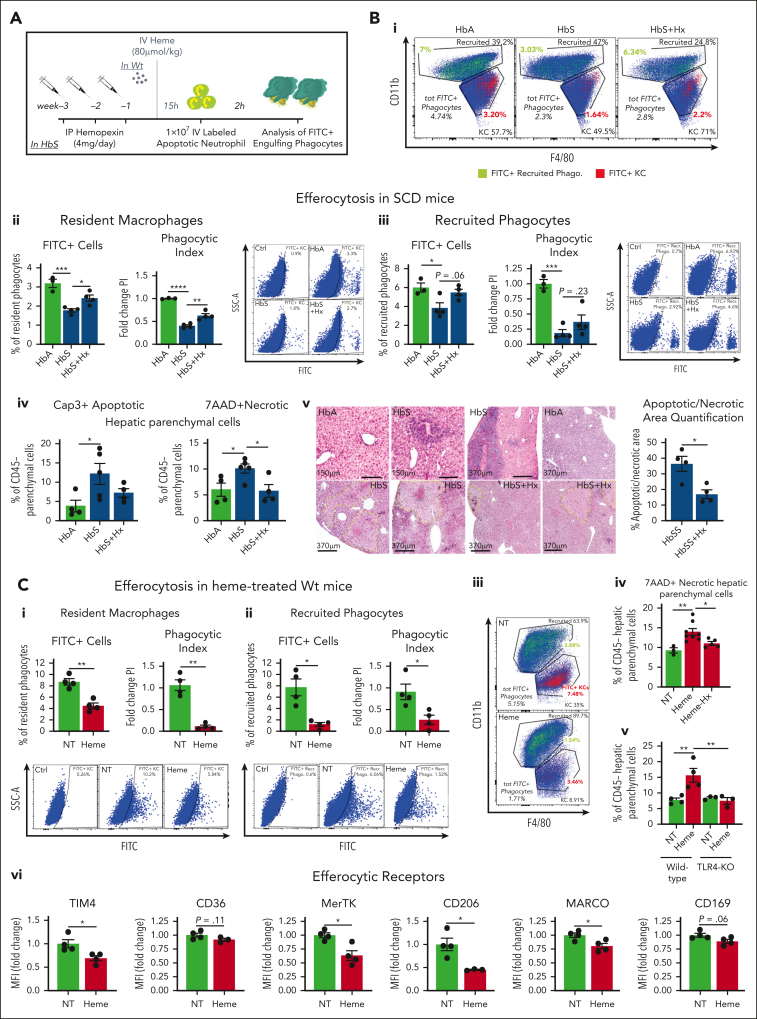
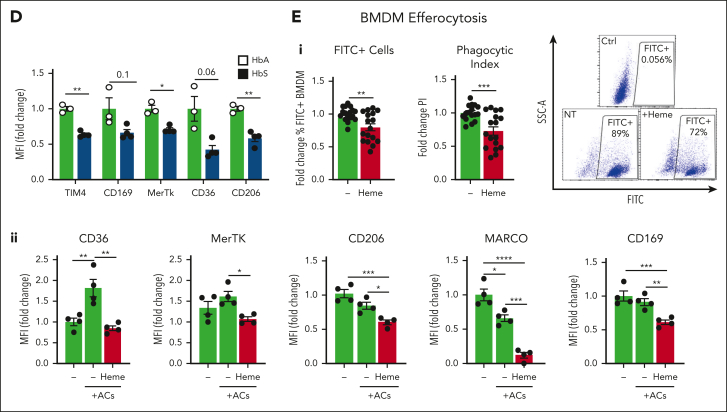
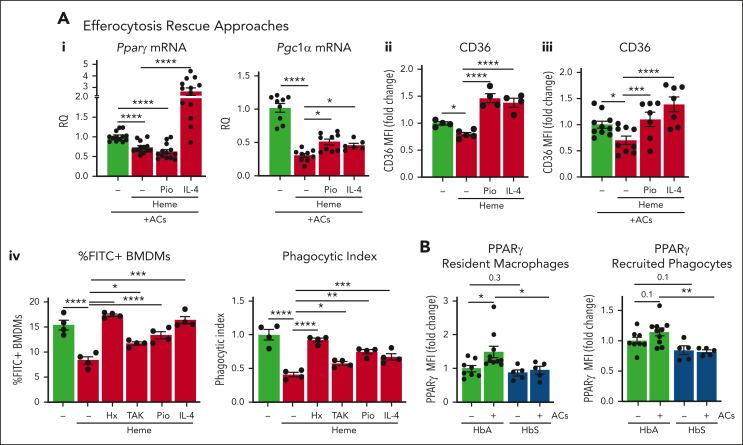
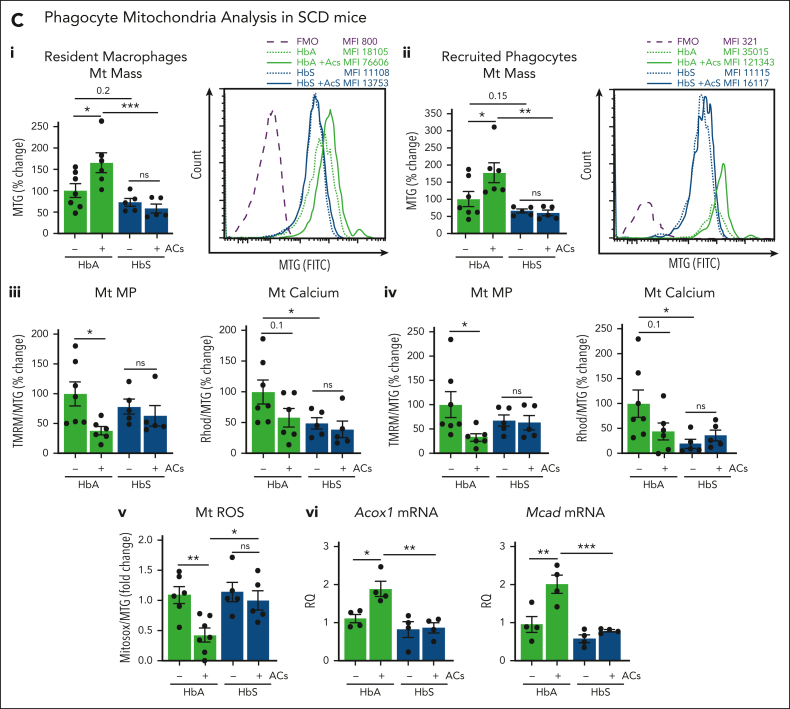
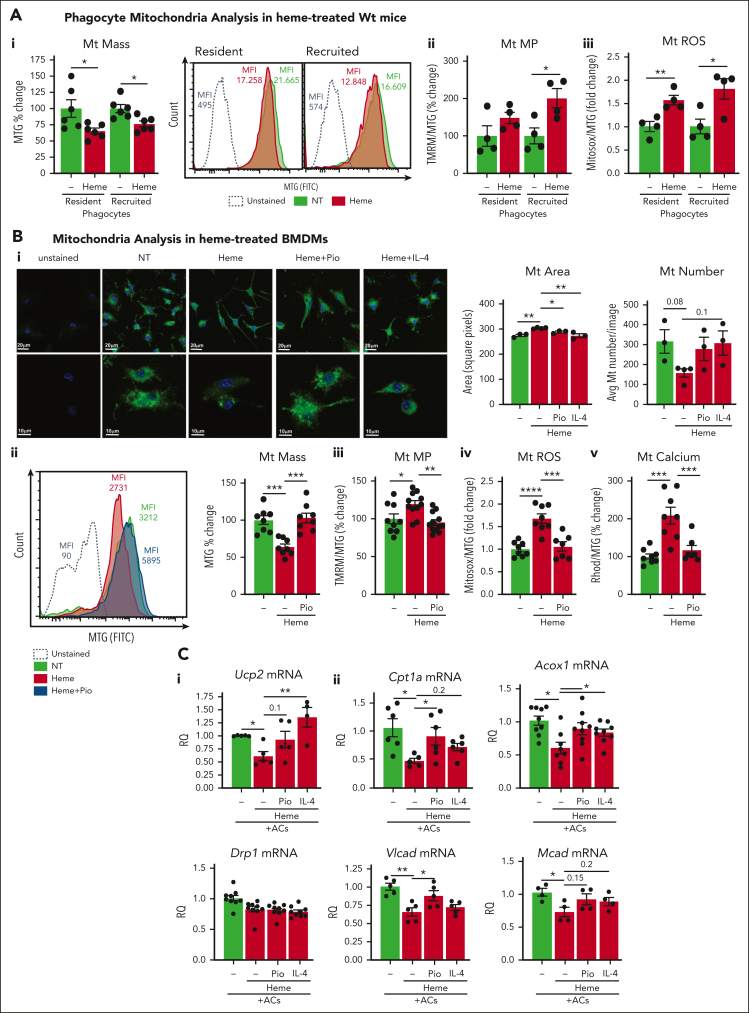
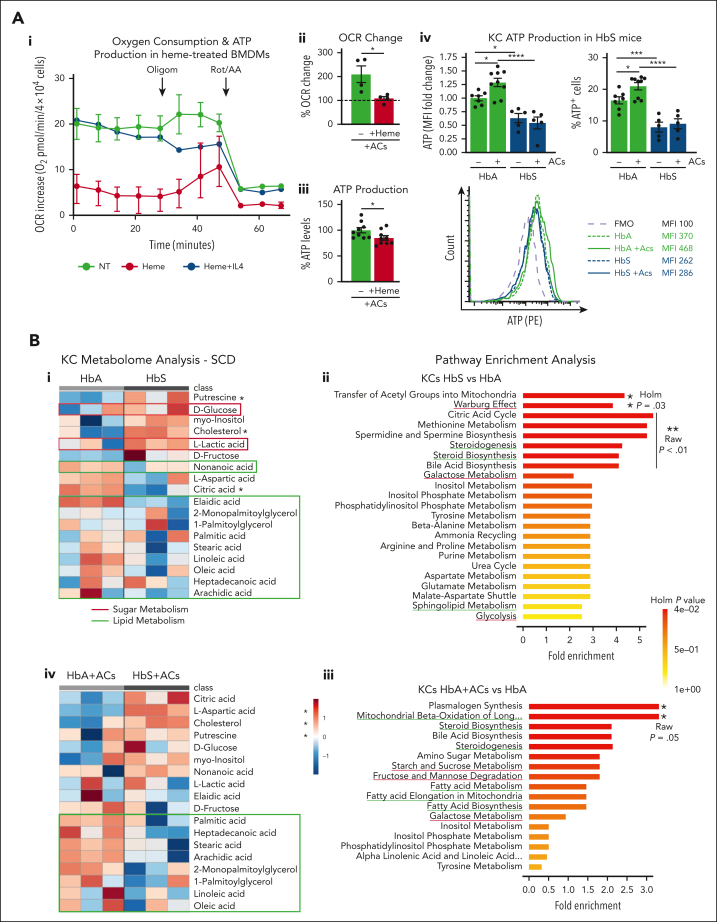
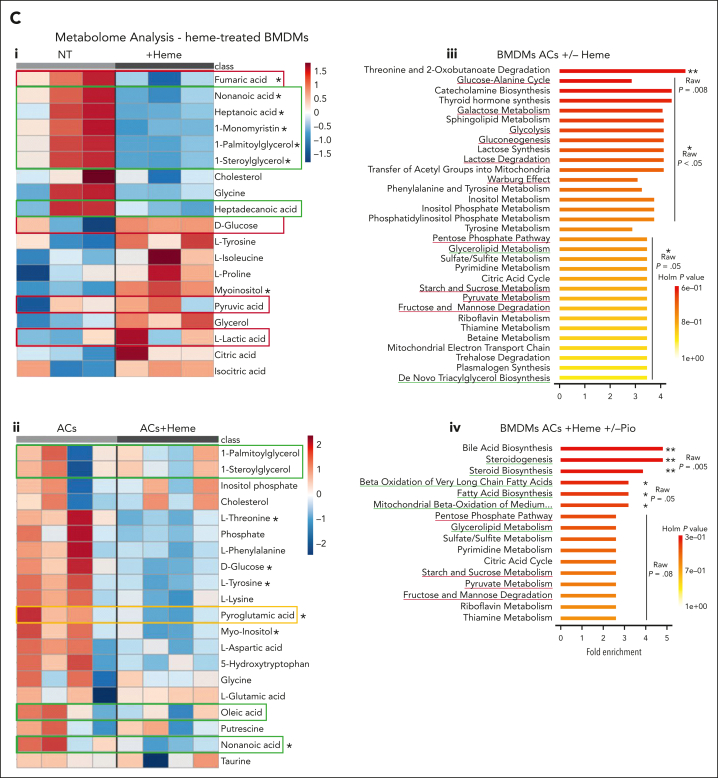
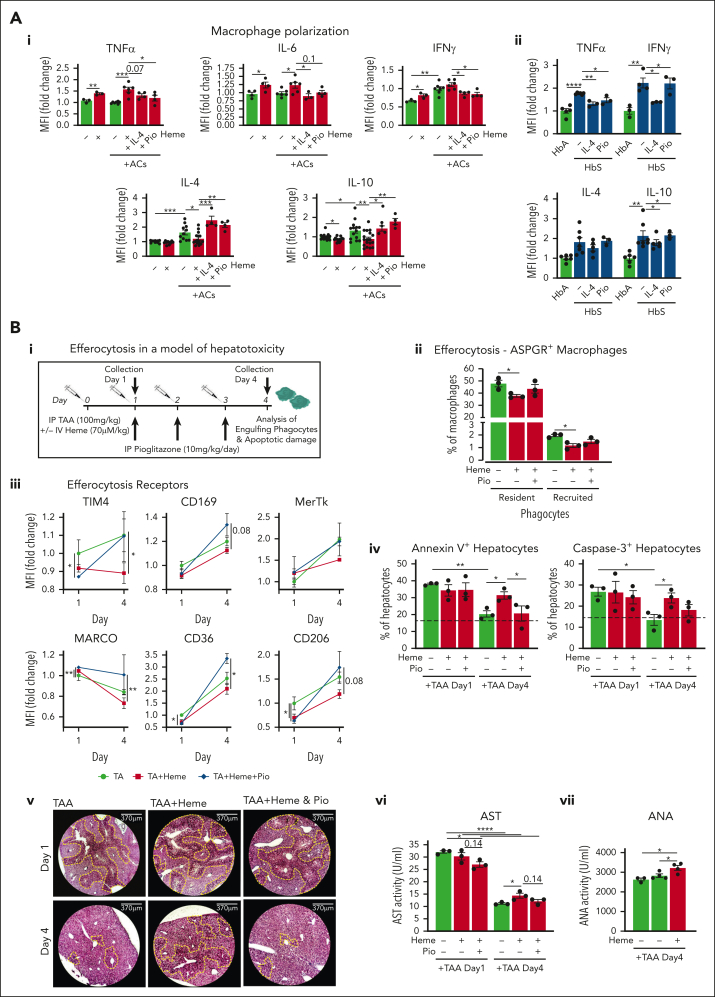
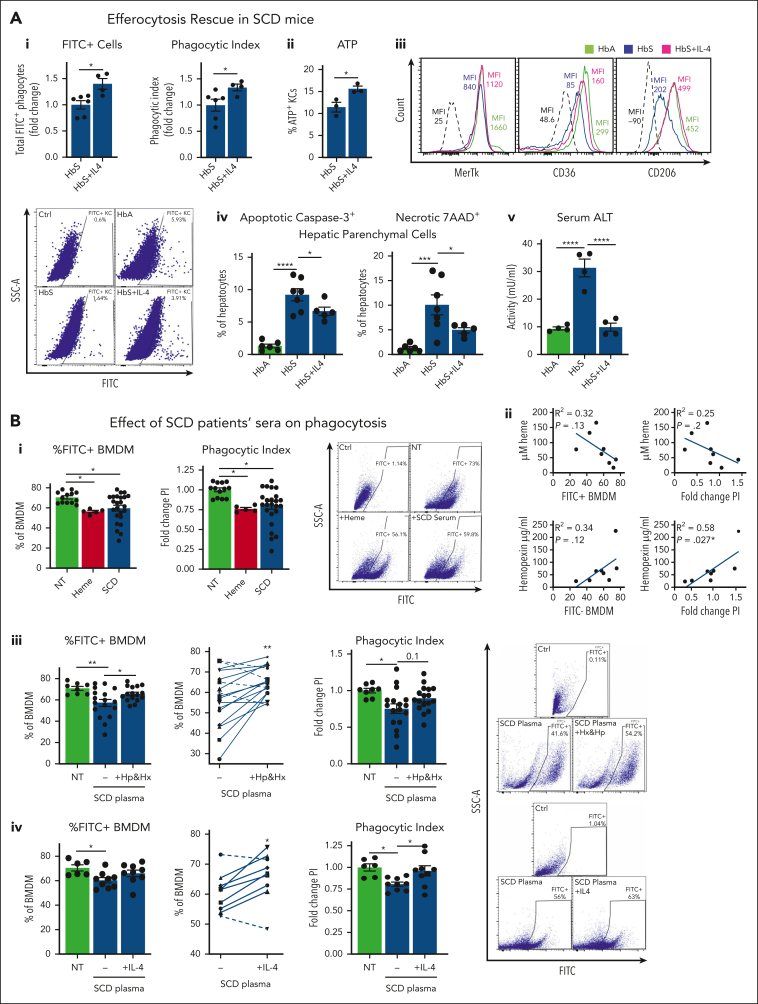
Sickle cell disease (SCD) is hallmarked by an underlying chronic inflammatory condition, which is contributed by heme-activated proinflammatory macrophages. Although previous studies addressed heme ability to stimulate macrophage inflammatory skewing through Toll-like receptor4 (TLR4)/reactive oxygen species signaling, how heme alters cell functional properties remains unexplored. Macrophage-mediated immune cell recruitment and apoptotic cell (AC) clearance are relevant in the context of SCD, in which tissue damage, cell apoptosis, and inflammation occur owing to vaso-occlusive episodes, hypoxia, and ischemic injury. Here we show that heme strongly alters macrophage functional response to AC damage by exacerbating immune cell recruitment and impairing cell efferocytic capacity. In SCD, heme-driven excessive leukocyte influx and defective efferocytosis contribute to exacerbated tissue damage and sustained inflammation. Mechanistically, these events depend on heme-mediated activation of TLR4 signaling and suppression of the transcription factor proliferator-activated receptor γ (PPARγ) and its coactivator peroxisome proliferator-activated receptor γ coactivator 1α (PGC1α). These changes reduce efferocytic receptor expression and promote mitochondrial remodeling, resulting in a coordinated functional and metabolic reprogramming of macrophages. Overall, this results in limited AC engulfment, impaired metabolic shift to mitochondrial fatty acid β-oxidation, and, ultimately, reduced secretion of the antiinflammatory cytokines interleukin-4 (IL-4) and IL-10, with consequent inhibition of continual efferocytosis, resolution of inflammation, and tissue repair. We further demonstrate that impaired phagocytic capacity is recapitulated by macrophage exposure to plasma of patients with SCD and improved by hemopexin-mediated heme scavenging, PPARγ agonists, or IL-4 exposure through functional and metabolic macrophage rewiring. Our data indicate that therapeutic improvement of heme-altered macrophage functional properties via heme scavenging or PGC1α/PPARγ modulation significantly ameliorates tissue damage associated with SCD pathophysiology.


Conflict of interest statement

Conflict-of-interest disclosure: The authors declare no competing financial interests. F.V. receives research funding from Silence Therapeutics, Vifor Pharma, and PharmaNutra (none of these are relevant to the current project).

Figures

None
Graphical abstract
Figure 1.
Figure 1.
Heme exacerbates immune cell recruitment upon apoptotic damage through inflammatory macrophages in sickle cell disease. (A) Percentage of total phagocytes (i), resident and recruited phagocytes (ii,iii), Ly6C+ recruited monocytes (iv), and 7AAD+ dead macrophages (vi); representative flow cytometry plot of CD11blow F4/80+ resident KCs and CD11b+ F4/80+/− recruited phagocytes (v) in the liver of untreated HbA and HbS mice and HbA, HbS, and Hx-treated HbS mice receiving 1 × 107 AC infusion. (B) Percentage of total phagocytes (i), resident and recruited phagocytes (ii,iii), and representative flow cytometry plot of phagocytes (iv) in the liver of untreated and heme-treated Wt mice receiving or not receiving 1 × 107 AC infusion. (C) Number of F4/80int/high monocytes/macrophages, Gr-1+ neutrophils and monocytes, F4/80 Gr-1 lymphocytes recruited to the peritoneum of Wt mice receiving BMDMs untreated (NT) or previously exposed for 15 hours to 5 μM heme bound to 5 μM albumin (Alb) or 5 μM Hx (i) and representative flow cytometry plot (ii). Data shown are average of 3 independent experiments. Values represent mean ± SEM. Statistical analysis was performed by comparing 3 or more groups with 1-way ANOVA followed by Bonferroni posttest. ∗P < .05; ∗∗P < .01; ∗∗∗P < .001; ∗∗∗∗P < .0001.
Figure 2.
Figure 2.
Heme suppresses efferocytosis receptors and drives defective efferocytosis in sickle cell disease. (A) Outline of in vivo efferocytosis experiment in HbS mice, receiving or not receiving hemopexin treatment, and Wt mice, treated with 80 μmol/kg heme. (B) Percentage and phagocytic index of engulfing FITC+ resident and recruited phagocytes in the liver of HbA, HbS, and Hx-treated HbS mice receiving 1 × 107 FITC-labeled AC infusion (i-iii). Representative flow cytometry plots of hepatic phagocytes (FITC+ efferocytes are shown in colors: resident in red; recruited in green) (i), and FITC+ hepatic resident and recruited efferocytes (ii,iii) are shown. Phagocytic index (PI) is calculated as (% FITC+ cells) × (FITC+ cell mean fluorescence intensity [MFI]) and expressed as PI fold change to HbA mice. Percentage of annexin V+ apoptotic and 7AAD+ necrotic hepatic parenchymal cells in HbA, HbS, and Hx-treated HbS mice (iv). Representative images of terminal deoxynucleotidyltransferase-mediated dUTP nick end labeling (TUNEL) staining for apoptotic areas and hematoxylin/eosin staining on liver sections from HbA, HbS, and Hx-treated HbS mice and relative quantification (v). (C) Percentage and phagocytic index of engulfing FITC+ resident (i) and recruited (ii) phagocytes in the liver of NT and heme-treated (80 μmol/kg heme) Wt mice receiving 1 × 107 FITC-labeled AC infusion. Representative flow cytometry plot of hepatic phagocytes (FITC+ efferocytes are shown in colors: resident in red, recruited in green) (iii) and FITC+ hepatic resident (i) and recruited (ii) efferocytes. Percentage of 7AAD+ necrotic hepatic parenchymal cells in Wt mice untreated or treated with heme-albumin (15 μmol/kg heme) or heme-hemopexin (15 μmol/kg heme-Hx) (iv) and untreated or heme-treated (80 μmol/kg heme) Wt and TLR4-knockout mice (v). Expression levels of efferocytic receptors (TIM4, CD169, MerTk, CD36, CD206) in hepatic resident macrophages of untreated or heme-treated (80 μmol/kg heme) Wt mice (vi) and, HbA and HbS mice (D), expressed in MFI as fold change to control mice. (E) FITC+ cell percentage and phagocytic index of BMDMs untreated or treated with 5 μM heme-albumin for 14 hours and then exposed to FITC-labeled apoptotic neutrophils (1 BMDM to 10 ACs ratio) for 2 hours. PI is calculated as (% FITC+ cells) × (FITC+ cell MFI) and expressed as PI fold change to untreated BMDMs. Representative flow cytometry plot of FITC+ efferocytic BMDMs is shown (i). Expression levels of efferocytic receptors (CD36, MerTk, CD206, MARCO, CD169) in BMDMs untreated or exposed to apoptotic cells (1 BMDM to 0.5 AC ratio) alone or together with 5 μM heme-albumin (heme) for 14 hours (ii). Data in panels A-D and Eii are representative of 2 independent experiments. Data in panel Ei are average of 3 independent experiments. Values represent mean ± SEM. Statistical analysis was performed by comparing 2 groups with 2-sided Welch t tests and 3 or more groups with a 1-way ANOVA followed by a Bonferroni posttest. ∗P < .05; ∗∗P < .01; ∗∗∗P < .001; ∗∗∗∗P < .0001.
Figure 2.
Figure 2.
Heme suppresses efferocytosis receptors and drives defective efferocytosis in sickle cell disease. (A) Outline of in vivo efferocytosis experiment in HbS mice, receiving or not receiving hemopexin treatment, and Wt mice, treated with 80 μmol/kg heme. (B) Percentage and phagocytic index of engulfing FITC+ resident and recruited phagocytes in the liver of HbA, HbS, and Hx-treated HbS mice receiving 1 × 107 FITC-labeled AC infusion (i-iii). Representative flow cytometry plots of hepatic phagocytes (FITC+ efferocytes are shown in colors: resident in red; recruited in green) (i), and FITC+ hepatic resident and recruited efferocytes (ii,iii) are shown. Phagocytic index (PI) is calculated as (% FITC+ cells) × (FITC+ cell mean fluorescence intensity [MFI]) and expressed as PI fold change to HbA mice. Percentage of annexin V+ apoptotic and 7AAD+ necrotic hepatic parenchymal cells in HbA, HbS, and Hx-treated HbS mice (iv). Representative images of terminal deoxynucleotidyltransferase-mediated dUTP nick end labeling (TUNEL) staining for apoptotic areas and hematoxylin/eosin staining on liver sections from HbA, HbS, and Hx-treated HbS mice and relative quantification (v). (C) Percentage and phagocytic index of engulfing FITC+ resident (i) and recruited (ii) phagocytes in the liver of NT and heme-treated (80 μmol/kg heme) Wt mice receiving 1 × 107 FITC-labeled AC infusion. Representative flow cytometry plot of hepatic phagocytes (FITC+ efferocytes are shown in colors: resident in red, recruited in green) (iii) and FITC+ hepatic resident (i) and recruited (ii) efferocytes. Percentage of 7AAD+ necrotic hepatic parenchymal cells in Wt mice untreated or treated with heme-albumin (15 μmol/kg heme) or heme-hemopexin (15 μmol/kg heme-Hx) (iv) and untreated or heme-treated (80 μmol/kg heme) Wt and TLR4-knockout mice (v). Expression levels of efferocytic receptors (TIM4, CD169, MerTk, CD36, CD206) in hepatic resident macrophages of untreated or heme-treated (80 μmol/kg heme) Wt mice (vi) and, HbA and HbS mice (D), expressed in MFI as fold change to control mice. (E) FITC+ cell percentage and phagocytic index of BMDMs untreated or treated with 5 μM heme-albumin for 14 hours and then exposed to FITC-labeled apoptotic neutrophils (1 BMDM to 10 ACs ratio) for 2 hours. PI is calculated as (% FITC+ cells) × (FITC+ cell MFI) and expressed as PI fold change to untreated BMDMs. Representative flow cytometry plot of FITC+ efferocytic BMDMs is shown (i). Expression levels of efferocytic receptors (CD36, MerTk, CD206, MARCO, CD169) in BMDMs untreated or exposed to apoptotic cells (1 BMDM to 0.5 AC ratio) alone or together with 5 μM heme-albumin (heme) for 14 hours (ii). Data in panels A-D and Eii are representative of 2 independent experiments. Data in panel Ei are average of 3 independent experiments. Values represent mean ± SEM. Statistical analysis was performed by comparing 2 groups with 2-sided Welch t tests and 3 or more groups with a 1-way ANOVA followed by a Bonferroni posttest. ∗P < .05; ∗∗P < .01; ∗∗∗P < .001; ∗∗∗∗P < .0001.
Figure 3.
Figure 3.
Efferocytosis-driven PPARγ induction and mitochondrial remodeling are impaired in SCD. (A) mRNA levels of PGC1α and PPARγ in BMDMs exposed to ACs (1 BMDM to 0.5 AC ratio) without or with 5 μM heme-albumin (heme), alone or in presence of 1 μΜ pioglitazone (Pio) or 50 ng/ml IL-4 for 14 hours (i). Protein expression levels of the efferocytic receptor CD36 in BMDMs untreated or treated with 5 μM heme-albumin (heme) in presence or absence of 1 μM Pio or 50 ng/mL IL-4, without (ii) or with (iii) AC coexposure (1 BMDM to 0.5 AC ratio) for 14 hours. mRNA levels are expressed in relative quantification (RQ) and protein levels in MFI as fold change to control BMDMs. FITC+ cell percentage and phagocytic index of BMDMs untreated or treated with 5 μM heme-albumin (heme) alone or combined with 5 μM Hx, 400 nM TAK-242 (TAK), 1 μΜ Pio, or 50 ng/mL IL-4 for 14 hours and then exposed to FITC-labeled apoptotic cells (1 BMDM to 10 ACs ratio) for 2 hours (iv). PI is calculated as (% FITC+ cells) × (FITC+ cell MFI) and expressed as PI fold change to untreated BMDMs. (B) Protein expression levels of PPARγ in KCs and recruited phagocytes of HbA and HbS mice, untreated or receiving 2.5 × 107 AC infusion, expressed in MFI as fold change to untreated HbA mice. Data in panels Ai,iii and B are average of 2 independent experiments. Data in panel Aii,iv are representative of 2 independent experiments. (C) Mitochondrial mass monitored by Mitotracker Green (MTG) staining (i,ii), Mt MP by TMRM staining, and mitochondrial calcium by Rhod2 staining (iii,iv) in resident and recruited phagocytes of HbA and HbS mice, untreated or receiving 2.5 × 107 AC infusion. Representative flow cytometry histograms of MTG staining of hepatic resident (i) and recruited (ii) phagocytes are shown. Mt MP and calcium are shown normalized to Mt mass and expressed as MFI percentage change over untreated HbA mice (v,vi). Mitochondrial ROS (Mt ROS) monitored by Mitosox staining (v) and mRNA levels of ACOX1 and MCAD (vi) in KCs of HbA and HbS mice, untreated or receiving 2.5 × 107 AC infusion. Mt ROS are shown normalized to Mt mass as MFI fold change over untreated HbA mice. mRNA levels are expressed in RQ. Data in panel C are average of 2 independent experiments. Values represent mean ± SEM. Statistical analysis was performed by comparing 3 or more groups with a 1-way ANOVA followed by a Bonferroni posttest. ∗P < .05; ∗∗P < .01; ∗∗∗P < .001; ∗∗∗∗P < .0001.
Figure 3.
Figure 3.
Efferocytosis-driven PPARγ induction and mitochondrial remodeling are impaired in SCD. (A) mRNA levels of PGC1α and PPARγ in BMDMs exposed to ACs (1 BMDM to 0.5 AC ratio) without or with 5 μM heme-albumin (heme), alone or in presence of 1 μΜ pioglitazone (Pio) or 50 ng/ml IL-4 for 14 hours (i). Protein expression levels of the efferocytic receptor CD36 in BMDMs untreated or treated with 5 μM heme-albumin (heme) in presence or absence of 1 μM Pio or 50 ng/mL IL-4, without (ii) or with (iii) AC coexposure (1 BMDM to 0.5 AC ratio) for 14 hours. mRNA levels are expressed in relative quantification (RQ) and protein levels in MFI as fold change to control BMDMs. FITC+ cell percentage and phagocytic index of BMDMs untreated or treated with 5 μM heme-albumin (heme) alone or combined with 5 μM Hx, 400 nM TAK-242 (TAK), 1 μΜ Pio, or 50 ng/mL IL-4 for 14 hours and then exposed to FITC-labeled apoptotic cells (1 BMDM to 10 ACs ratio) for 2 hours (iv). PI is calculated as (% FITC+ cells) × (FITC+ cell MFI) and expressed as PI fold change to untreated BMDMs. (B) Protein expression levels of PPARγ in KCs and recruited phagocytes of HbA and HbS mice, untreated or receiving 2.5 × 107 AC infusion, expressed in MFI as fold change to untreated HbA mice. Data in panels Ai,iii and B are average of 2 independent experiments. Data in panel Aii,iv are representative of 2 independent experiments. (C) Mitochondrial mass monitored by Mitotracker Green (MTG) staining (i,ii), Mt MP by TMRM staining, and mitochondrial calcium by Rhod2 staining (iii,iv) in resident and recruited phagocytes of HbA and HbS mice, untreated or receiving 2.5 × 107 AC infusion. Representative flow cytometry histograms of MTG staining of hepatic resident (i) and recruited (ii) phagocytes are shown. Mt MP and calcium are shown normalized to Mt mass and expressed as MFI percentage change over untreated HbA mice (v,vi). Mitochondrial ROS (Mt ROS) monitored by Mitosox staining (v) and mRNA levels of ACOX1 and MCAD (vi) in KCs of HbA and HbS mice, untreated or receiving 2.5 × 107 AC infusion. Mt ROS are shown normalized to Mt mass as MFI fold change over untreated HbA mice. mRNA levels are expressed in RQ. Data in panel C are average of 2 independent experiments. Values represent mean ± SEM. Statistical analysis was performed by comparing 3 or more groups with a 1-way ANOVA followed by a Bonferroni posttest. ∗P < .05; ∗∗P < .01; ∗∗∗P < .001; ∗∗∗∗P < .0001.
Figure 4.
Figure 4.
Heme alters mitochondrial mass and dynamics. (A) Mt mass (i), Mt MP (ii), and Mt ROS (iii) monitored by flow cytometry in resident and recruited phagocytes of untreated and heme-treated (80 μmol/kg heme) Wt mice. Mt MP and ROS are shown normalized to Mt mass and expressed as MFI percentage or fold change over untreated Wt mice. Representative flow cytometry histograms of MTG staining of resident and recruited phagocytes are shown (i). (B) Representative confocal microscopy images of MTG-stained BMDMs untreated or treated with 5 μM heme-albumin (heme), alone or combined with 1 μM Pio or 50 ng/mL IL-4 for 14 hours, and relative Mt area and number quantification (i). Mt mass (ii), Mt MP (iii), Mt calcium (iv), and Mt ROS (v) monitored by flow cytometry in BMDMs untreated or treated with 5 μM heme-albumin (heme), alone or combined with 1 μM Pio for 14 hours. Mt MP, calcium, and ROS are shown normalized to Mt mass and expressed as MFI percentage or fold change over untreated BMDMs. Representative flow cytometry histograms of MTG staining of BMDMs are shown (ii). (C) mRNA levels of UCP2, DRP1 (i), CPT1a, ACOX1, VLCAD, and MCAD (ii) in BMDMs exposed to ACs (1 BMDM to 0.5 AC ratio) without or with 5 μM heme-albumin (heme) alone or combined with 1 μM Pio or 50 ng/mL IL-4 for 14 hours. mRNA levels are expressed in RQ. Data are average of 2 independent experiments. Values represent mean ± SEM. Statistical analysis was performed by comparing 3 or more groups with a 1-way ANOVA followed by a Bonferroni posttest. ∗P < .05; ∗∗P < .01; ∗∗∗P < .001; ∗∗∗∗P < .0001.
Figure 5.
Figure 5.
Heme induces Warburg effect in macrophages and prevents efferocytosis-driven metabolic switch to FAO and ATP production. (A) OCR increase (i), percentage OCR (ii) and ATP (iii) change in BMDMs untreated or treated with 20 μM heme-albumin (heme) with/without 50 ng/mL IL-4 for 14 hours and then exposed to FITC-labeled ACs (1 BMDM to 10 ACs ratio) for 3 hours. Data are representative of 3 independent experiments. ATP production in KCs and percentage ATP+ KCs in HbA and HbS mice, untreated or receiving 2.5 × 107 AC infusion (iv). Data are average of 2 independent experiments. ATP production is expressed as MFI fold change over control HbA mice. Representative flow cytometry histograms of ATP staining in KCs are shown. Values represent mean ± SEM. Statistical analysis was performed by comparing 2 groups with 2-sided Welch t tests and 3 or more groups with a 1-way ANOVA followed by a Bonferroni posttest. (B,C) Metabolome analysis in KCs of HbS mice, panel B, and BMDMs, panel C. (B) Heatmaps after unsupervised hierarchical clustering of metabolites from isolated KCs of HbA and HbS mice, untreated (i) and receiving 2.5 × 107 AC infusion (iv). Metabolite set enrichment analysis of significantly altered core pathways in KCs of untreated HbA and HbS mice (ii) and HbA mice, untreated or receiving 2.5 × 107 AC infusion (iii). Data are representative of 2 independent experiments. (C) Heatmaps after unsupervised hierarchical clustering of metabolites from BMDMs untreated or exposed to 5 μM heme-albumin, alone (i) or in presence of ACs (ii). Metabolite set enrichment analysis of significantly altered core pathways in BMDMs exposed to ACs in absence or presence of 10 μM heme-albumin (iii) and with Pio (iv) (see relative heatmap and complete analysis in supplemental tables 6-13 and figures 19-29). In the heatmaps, significantly different compounds as determined by a t test are indicated. Data are representative of 3 independent experiments. In pathway enrichment analysis, significantly different pathways as determined by a t test and unadjusted raw or adjusted Holm P values are indicated. Data show a representative experiment. ∗P < .05; ∗∗P < .01; ∗∗∗P < .001; ∗∗∗∗P < .0001.
Figure 5.
Figure 5.
Heme induces Warburg effect in macrophages and prevents efferocytosis-driven metabolic switch to FAO and ATP production. (A) OCR increase (i), percentage OCR (ii) and ATP (iii) change in BMDMs untreated or treated with 20 μM heme-albumin (heme) with/without 50 ng/mL IL-4 for 14 hours and then exposed to FITC-labeled ACs (1 BMDM to 10 ACs ratio) for 3 hours. Data are representative of 3 independent experiments. ATP production in KCs and percentage ATP+ KCs in HbA and HbS mice, untreated or receiving 2.5 × 107 AC infusion (iv). Data are average of 2 independent experiments. ATP production is expressed as MFI fold change over control HbA mice. Representative flow cytometry histograms of ATP staining in KCs are shown. Values represent mean ± SEM. Statistical analysis was performed by comparing 2 groups with 2-sided Welch t tests and 3 or more groups with a 1-way ANOVA followed by a Bonferroni posttest. (B,C) Metabolome analysis in KCs of HbS mice, panel B, and BMDMs, panel C. (B) Heatmaps after unsupervised hierarchical clustering of metabolites from isolated KCs of HbA and HbS mice, untreated (i) and receiving 2.5 × 107 AC infusion (iv). Metabolite set enrichment analysis of significantly altered core pathways in KCs of untreated HbA and HbS mice (ii) and HbA mice, untreated or receiving 2.5 × 107 AC infusion (iii). Data are representative of 2 independent experiments. (C) Heatmaps after unsupervised hierarchical clustering of metabolites from BMDMs untreated or exposed to 5 μM heme-albumin, alone (i) or in presence of ACs (ii). Metabolite set enrichment analysis of significantly altered core pathways in BMDMs exposed to ACs in absence or presence of 10 μM heme-albumin (iii) and with Pio (iv) (see relative heatmap and complete analysis in supplemental tables 6-13 and figures 19-29). In the heatmaps, significantly different compounds as determined by a t test are indicated. Data are representative of 3 independent experiments. In pathway enrichment analysis, significantly different pathways as determined by a t test and unadjusted raw or adjusted Holm P values are indicated. Data show a representative experiment. ∗P < .05; ∗∗P < .01; ∗∗∗P < .001; ∗∗∗∗P < .0001.
Figure 6.
Figure 6.
Macrophage metabolic rewiring counteracts inflammation and improves tissue damage resolution by restoring heme-suppressed AC clearance. (A) Levels of TNFα, IL-6, interferon gamma (IFN-γ), IL-4, and IL-10 monitored by flow cytometry in BMDMs exposed or not to ACs (1 BMDM to 0.5 AC ratio) in presence of 5 μM heme-albumin (heme) without or with 1 μM Pio or 50 ng/mL IL-4 for 6 hours (i). Levels of TNFα, IFN-γ, IL-4, and IL-10 monitored by flow cytometry in KCs of HbA mice and HbS mice untreated or receiving IL-4 or Pio treatment (ii). Protein levels are expressed in MFI as fold change to control BMDMs. (B) Outline of in vivo experiment on hepatotoxicity induced by thioacetamide (TAA) in Wt mice. Parameters were monitored at days 1 and 4 after TAA treatment (i). Percentage of efferocytic ASPGR+ resident and recruited phagocytes (day 1) in the liver of Wt mice untreated or treated with TAA alone (100 mg/kg TAA) or combined with heme (70 μmol/kg heme) or heme/Pio (10 mg/kg per day Pio) (ii). Expression level of efferocytic receptors (TIM4, MerTk, CD36, CD206, MARCO, CD169) in KCs of Wt mice treated with TAA alone or combined with heme or heme/Pio (iii). Percentage of annexin V+ and caspase-3+ apoptotic CD45 hepatic parenchymal cells (iv) and representative images of hematoxylin/eosin staining on liver sections of Wt mice treated with TAA alone or combined with heme or heme/Pio (v). Damaged apoptotic/necrotic areas are highlighted in the pictures by the yellow dashed line. AST activity and antinuclear antibody activity in sera of Wt mice treated with TAA alone or combined with heme or heme/Pio (vi,vii). Protein expression levels are expressed in MFI as fold change to TAA-treated mice. Data show a representative of 2 independent experiments. Values represent mean ± SEM. Statistical analysis was performed by comparing 3 or more groups with a 1-way ANOVA followed by a Bonferroni posttest. ∗P < .05; ∗∗P < .01; ∗∗∗P < .001; ∗∗∗∗P < .0001.
Figure 7.
Figure 7.
Plasma heme overload in patients with SCD is a driver of defective phagocytosis. (A) Percentage and phagocytic index and representative flow cytometry dot plot of engulfing FITC+ phagocytes (i); percentage ATP+ KCs (ii); representative flow cytometry histograms of CD36, MerTk, and CD206 expression in KCs (iii); percentage of caspase-3+ apoptotic and 7AAD+ necrotic CD45⁻ hepatic parenchymal cells (iv); and serum ALT activity (v) in untreated and IL-4–treated HbS mice receiving 1 × 107 FITC-labeled AC infusion. Data show a representative of 2 independent experiments. (B) FITC+ cell percentage, phagocytic index, and representative flow cytometry plot of BMDMs untreated or treated with 5 μM heme-albumin (heme) and 10% plasma from patients with SCD for 14 hours and then exposed to Escherichia coli bioparticles (pHrodo) for 2 hours (i). Correlation between FITC+ phagocytic cell percentage or phagocytic index and heme or Hx levels in plasma of the correspondent patient with SCD (ii). FITC+ cell percentage, phagocytic index, and representative flow cytometry plot of BMDMs untreated or treated with plasma from patients with SCD in presence or absence of 10 μM Hx plus 10 μM Hp (n = 17) (iii) or 50 ng/mL IL-4 (n = 9) (iv) for 15 hours, followed by exposure to pHrodo E. coli bioparticles for 2 hours. PI is calculated as (% FITC+ cells) × (FITC+ cell MFI) and expressed as PI fold change to untreated BMDMs. FITC+ phagocytic cell percentage changes caused by Hb/heme scavenging or IL-4 treatment are shown for plasma from each patients with SCD. Solid lines correspond to increased phagocytosis (13 patients [iii]; 7 patients [iv] and dashed lines correspond to decreased phagocytosis (4 patients [iii]; 2 patients [iv]) in presence of Hb/heme scavengers or IL-4. Data are average of 3 independent experiments. Values represent mean ± SEM (n = 2/3). Statistical analysis was performed by comparing 2 groups with 2-sided Welch t tests and 3 or more groups with a 1-way ANOVA followed by a Bonferroni posttest. ∗P < .05; ∗∗P < .01.

Comment in

Similar articles

Cited by

References

    1. Vinchi F, Vance SZ. Reshaping erythrophagocytosis and iron recycling by reticuloendothelial macrophages. Hemasphere. 2021;5(2) - PMC - PubMed
    1. Alam MZ, Devalaraja S, Haldar M. The heme connection: linking erythrocytes and macrophage biology. Front Immunol. 2017;8:33. - PMC - PubMed
    1. Soares MP, Hamza I. Macrophages and iron metabolism. Immunity. 2016;44(3):492–504. - PMC - PubMed
    1. Hvidberg V, Maniecki MB, Jacobsen C, Hojrup P, Moller HJ, Moestrup SK. Identification of the receptor scavenging hemopexin-heme complexes. Blood. 2005;106(7):2572–2579. - PubMed
    1. Smith A, McCulloh RJ. Hemopexin and haptoglobin: allies against heme toxicity from hemoglobin not contenders. Front Physiol. 2015;6:187. - PMC - PubMed

Publication types

MeSH terms