. 2023 Apr 18;4(4):100980.
doi: 10.1016/j.xcrm.2023.100980. Epub 2023 Mar 22.

Generalizable biomarker prediction from cancer pathology slides with self-supervised deep learning: A retrospective multi-centric study

Affiliations

Generalizable biomarker prediction from cancer pathology slides with self-supervised deep learning: A retrospective multi-centric study

Jan Moritz Niehues et al. Cell Rep Med. .

Abstract

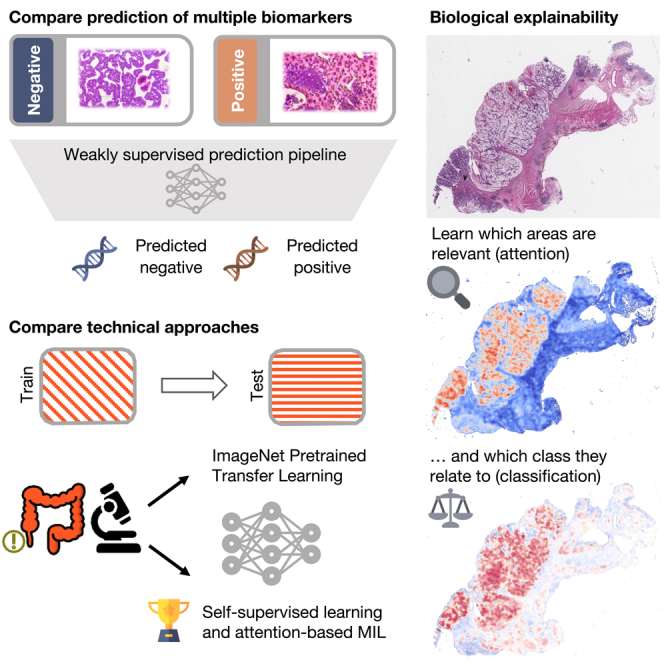
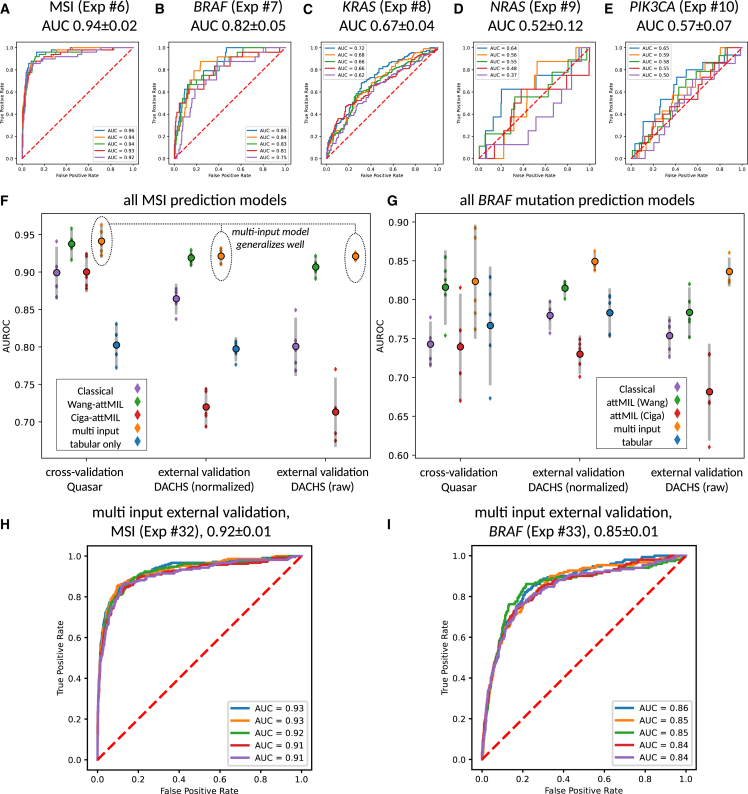
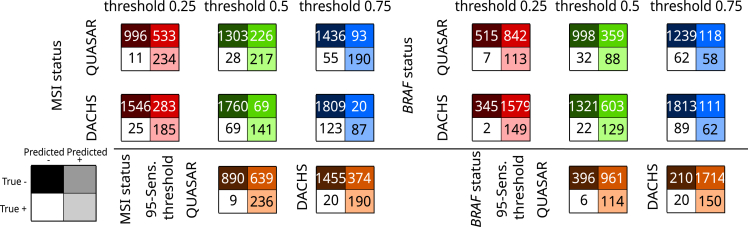
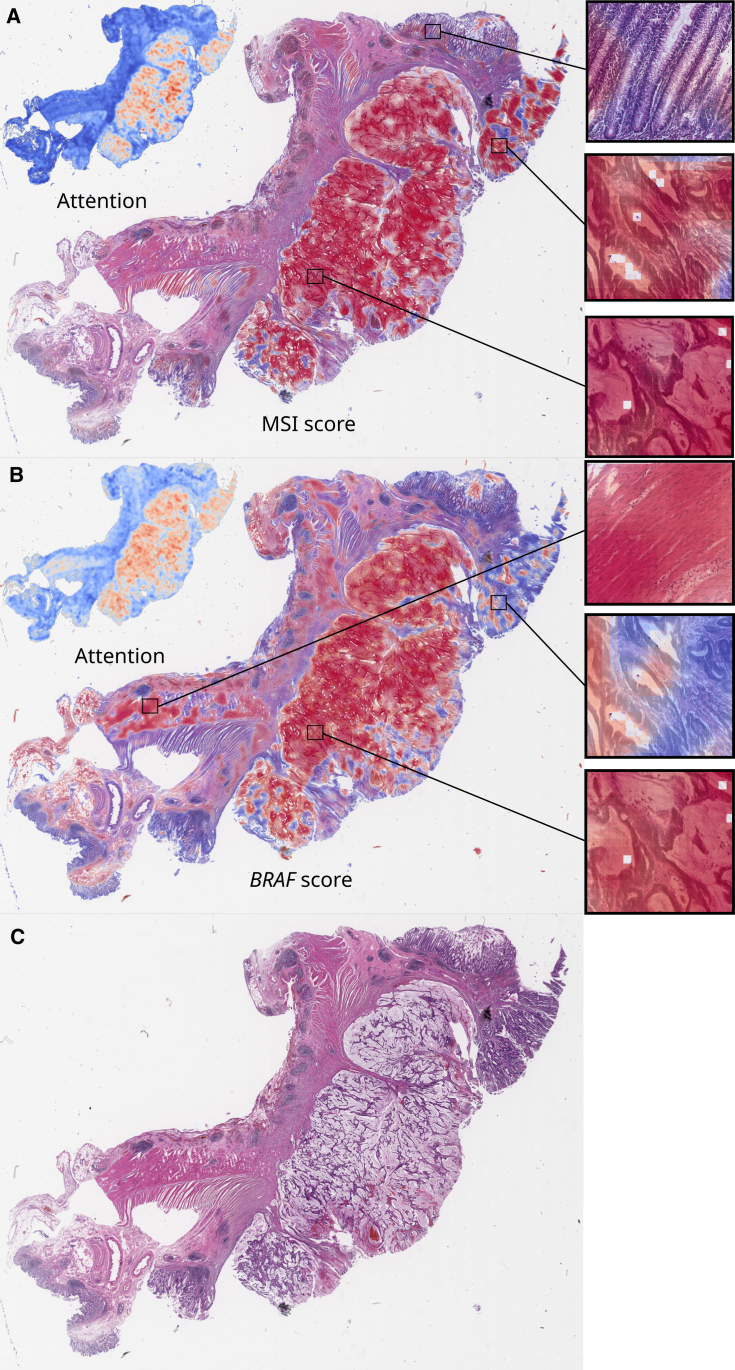
Deep learning (DL) can predict microsatellite instability (MSI) from routine histopathology slides of colorectal cancer (CRC). However, it is unclear whether DL can also predict other biomarkers with high performance and whether DL predictions generalize to external patient populations. Here, we acquire CRC tissue samples from two large multi-centric studies. We systematically compare six different state-of-the-art DL architectures to predict biomarkers from pathology slides, including MSI and mutations in BRAF, KRAS, NRAS, and PIK3CA. Using a large external validation cohort to provide a realistic evaluation setting, we show that models using self-supervised, attention-based multiple-instance learning consistently outperform previous approaches while offering explainable visualizations of the indicative regions and morphologies. While the prediction of MSI and BRAF mutations reaches a clinical-grade performance, mutation prediction of PIK3CA, KRAS, and NRAS was clinically insufficient.

Keywords: artificial intelligence; attention heatmaps; attention-based multiple-instance learning; biomarker; colorectal cancer; computational pathology; multi-input models; oncogenic mutation; self-supervised learning.


Conflict of interest statement

Declaration of interests For transparency, we provide the following information: J.N.K. declares consulting services for Owkin, France; Panakeia, UK; and DoMore Diagnostics, Norway. P.Q. and N.P.W. declare research funding from Roche and PQ consulting and speaker services for Roche. P.Q. is a National Institute of Health Research senior investigator.

Figures

None
Graphical abstract
Figure 1
Figure 1
Schematic workflow of this study (A) Schematic summary of attMIL and the multi-input DL architecture: a WSI is tessellated into smaller tiles, that are subsequently pre-processed and passed through the encoder to give image feature vectors. In the multi-input case, each image feature vector is concatenated by a vector representing the patient’s clinical data. The set of image feature vectors per WSI is then used as input to the attMIL model. In a first embedding block, the attMIL model reduces the dimension of each tile’s initial feature vector to 256 (from 2,048 [+4 if clinical data are used in the input] when using the Wang encoder). Then, the attention score per tile is calculated. Using the attention score, the attention-weighted sum over all embedded feature vectors can be evaluated to give a 256-dimensional vector representing the entire WSI (green). Finally, this vector is passed through a classification block to obtain a biomarker prediction for the input WSI. (B) Targets and cohorts used in internal and external validation. For internal validation, we tested for MSI, BRAF, PIK3CA, KRAS, and NRAS status. Externally only for MSI and BRAF status. (C) List of all six DL approaches that were compared in this study. E, encoder network; P, embedding block that embeds feature vectors into a lower dimensional space; A, attention layers; Π, attention weighting; Σ, sum; C, classification block.
Figure 2
Figure 2
Biomarker prediction performance of deep-learning models (A–E) Cross-validated AUROCs for all biomarkers obtained using the Wang-attMIL model. (F and G) Internal cross-validated performance of all models on QUASAR and external validation on DACHS (with and without Macenko color normalization). The bar charts show the distribution of five technical replicates and error bars indicate 95% confidence intervalls. In internal cross-validation, replicates are separate cross-validation runs. In external validation, replicates are deployments of the individual cross-validation models. Central markers give the average AUROC score in each setup. (H and I) The error bars indicate 95% confidence intervals AUROCs obtained by models trained in each of the five folds for MSI and BRAF status prediction, applied to the external validation set QUASAR.
Figure 3
Figure 3
Test statistics for a potential screening tool using the Wang-attMIL image-only models Test performances at thresholds of 0.25, 0.5, and 0.75 (top) and at a threshold that yielded 95% in-domain sensitivity (95-Sens. threshold) averaged across the five models per biomarker. In-domain performances are measured by the summed model predictions over respective test sets. External performances on DACHS are obtained by averaging scores for biomarker prediction over all five Wang-attMIL models per biomarker. Clinical statistics for correctly classified and misclassified patients in QUASAR and DACHS at a threshold value of 0.5 are given in Tables S7 and S8.
Figure 4
Figure 4
Spatial patterns of attention and classification of MSI and BRAF prediction models (A and B) MSI score (A) and BRAF score (B) with corresponding attention maps for a typical MSI- and BRAF-positive patient from the DACHS cohort. (C) Plain slide view. Scores were obtained with the best in-domain models trained on QUASAR (Wang-attMIL model). The displayed attention distribution is the normalized attention â=aaminamaxamin, where a is the attention score and amin and amax are the minimum and maximum scores on the WSI. This attention map highlights “relevant” tumor regions, irrespective of whether they were predicted to be MSI or MSS. The classification scores of the model show the “MSI-ness” and “BRAF-ness” for each tile. In both cases, the model correctly predicted MSI and BRAF status on the patient level.
Figure 5
Figure 5
Biomarker predictability in patient subgroups and explainability (A) Internal validation ROCs for BRAF mutation prediction in the subgroup of MSI patients. (B) Internal validation ROCs for BRAF status prediction in the subgroup of MSS patients. (C) Internal validation ROCs for MSI/MSS status prediction in the subgroup of BRAF-mutated patients. (D) Internal validation ROCs for MSI/MSS status prediction in the subgroup of BRAF wild-type patients. (E and F) Top scoring tiles and Grad-CAM saliency maps for MSI (E) and MSS (F) status for the best in-domain Wang+attMIL model deployed on the DACHS cohort. (G and H) Top scoring tiles for BRAF-mutated (G) and BRAF wild-type (H) status for the best in-domain Wang+attMIL model deployed on the DACHS cohort. For better interpretability, six out-of-focus tiles are not shown in this panel. In (E)–(G), top tiles are the highest, top 5%, and top 10% scoring tiles in terms of the product of the tile’s attention and the tile’s classification score (left to right) for the patients with the highest overall classification score for the target mutation (top to bottom). High-resolution images can be found at Zenodo: https://doi.org/10.5281/zenodo.7454743. Correlation of prediction scores for MSI and BRAF status for the best image-only model can be found in Figure S6.

References

    1. Esteva A., Kuprel B., Novoa R.A., Ko J., Swetter S.M., Blau H.M., Thrun S. Dermatologist-level classification of skin cancer with deep neural networks. Nature. 2017;542:115–118. - PMC - PubMed
    1. Heinz C.N., Echle A., Foersch S., Bychkov A., Kather J.N. The future of artificial intelligence in digital pathology - results of a survey across stakeholder groups. Histopathology. 2022;80:1121–1127. - PubMed
    1. Echle A., Rindtorff N.T., Brinker T.J., Luedde T., Pearson A.T., Kather J.N. Deep learning in cancer pathology: a new generation of clinical biomarkers. Br. J. Cancer. 2021;124:686–696. doi: 10.1038/s41416-020-01122-x. - DOI - PMC - PubMed
    1. Cifci D., Foersch S., Kather J.N. Artificial intelligence to identify genetic alterations in conventional histopathology. J. Pathol. 2022;257:430–444. doi: 10.1002/path.5898. - DOI - PubMed
    1. Chen R.J., Lu M.Y., Williamson D.F.K., Chen T.Y., Lipkova J., Noor Z., Shaban M., Shady M., Williams M., Joo B., Mahmood F. Pan-cancer integrative histology-genomic analysis via multimodal deep learning. Cancer Cell. 2022;40:865–878.e6. - PMC - PubMed

Publication types

MeSH terms

Substances