. 2023 Mar 30;186(7):1382-1397.e21.
doi: 10.1016/j.cell.2023.02.022. Epub 2023 Mar 22.

A gut-secreted peptide suppresses arousability from sleep

Affiliations

A gut-secreted peptide suppresses arousability from sleep

Iris Titos et al. Cell. .

Erratum in

Abstract

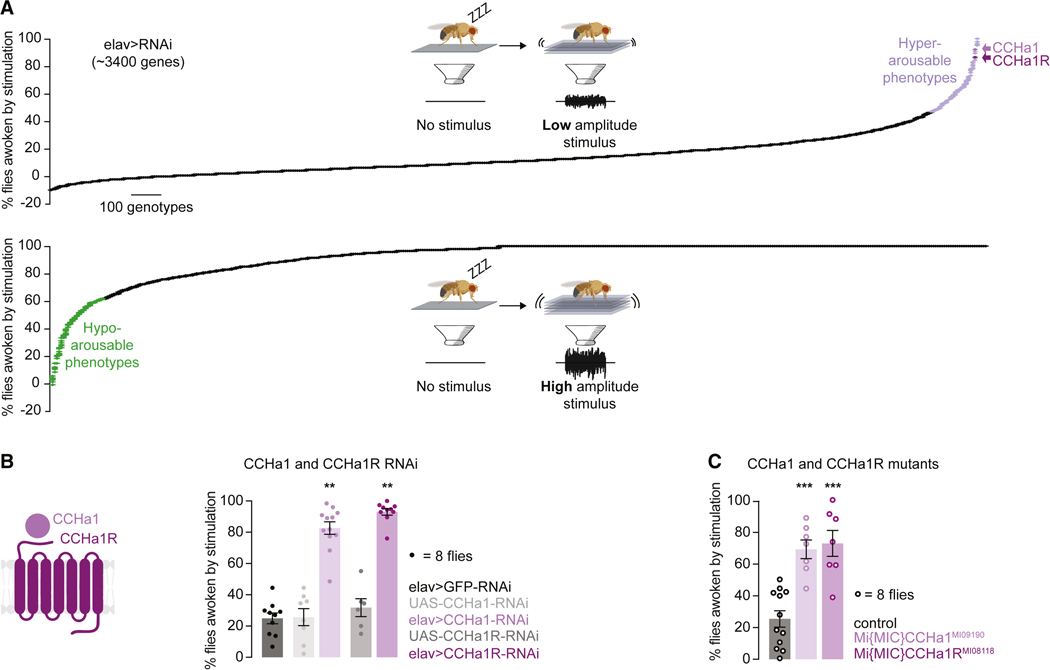
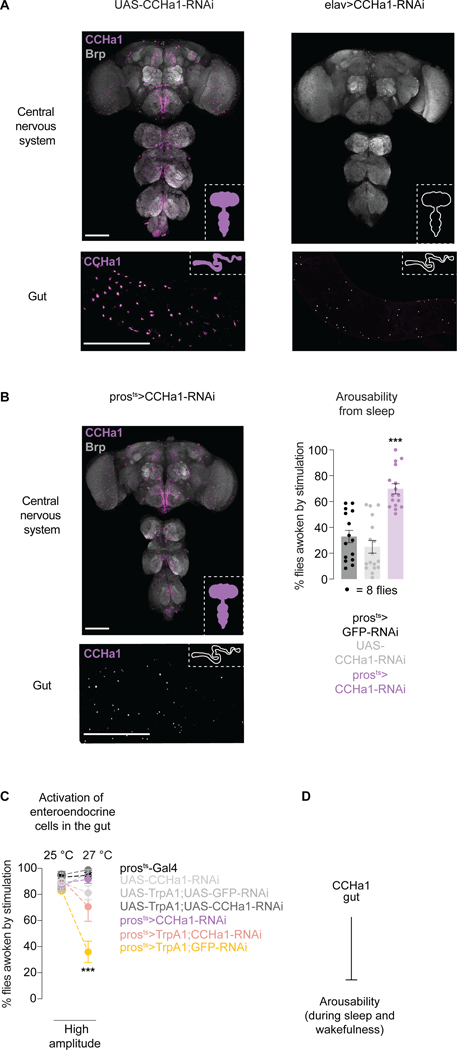
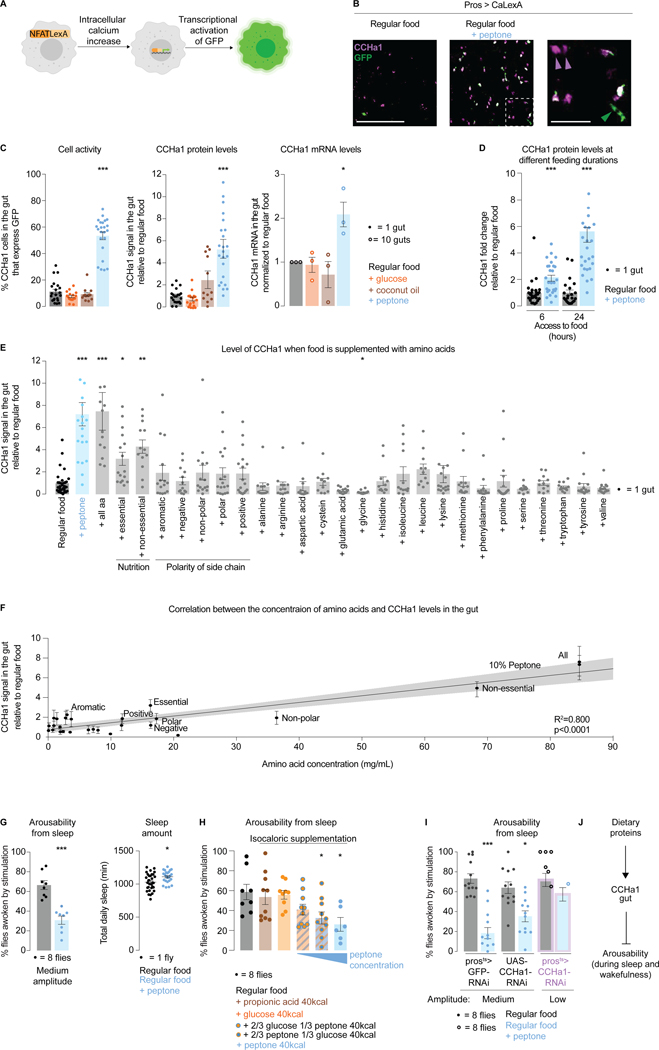
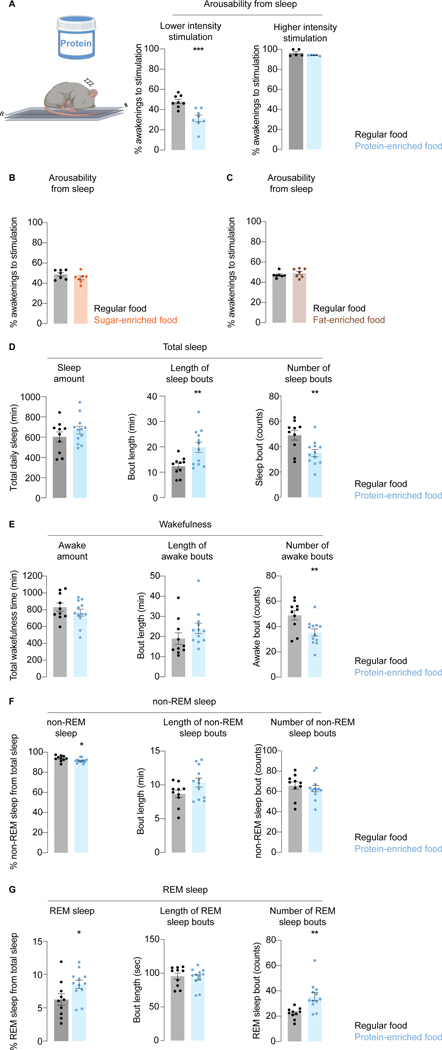
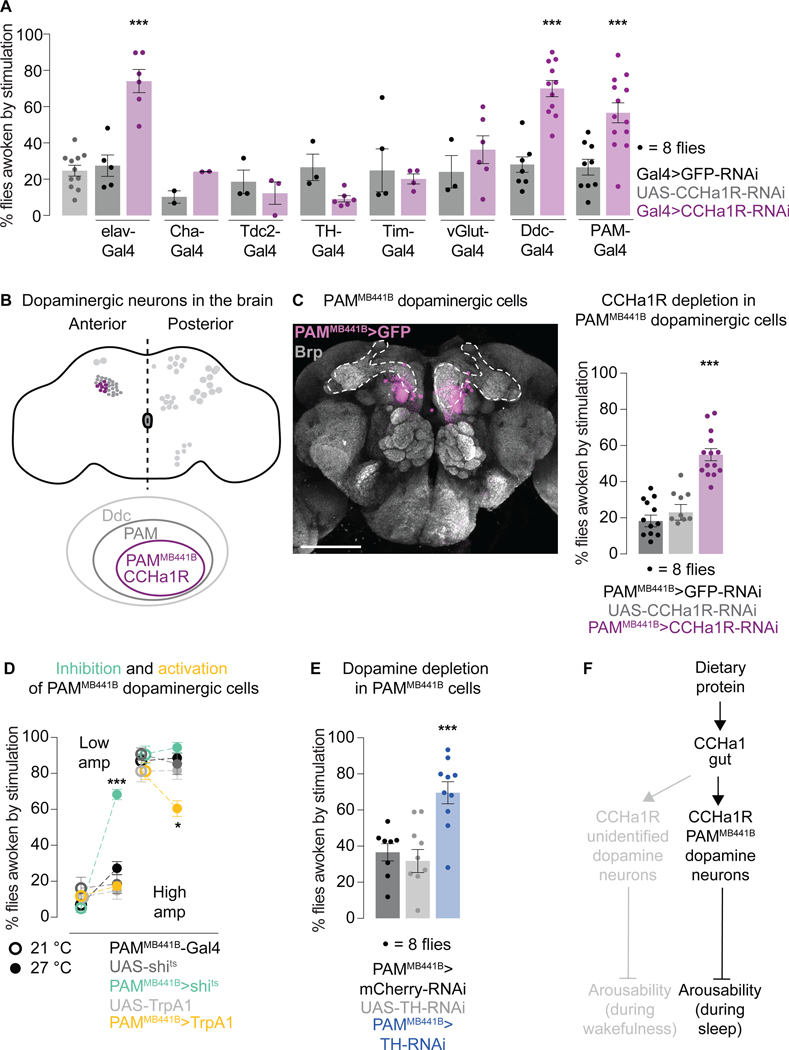
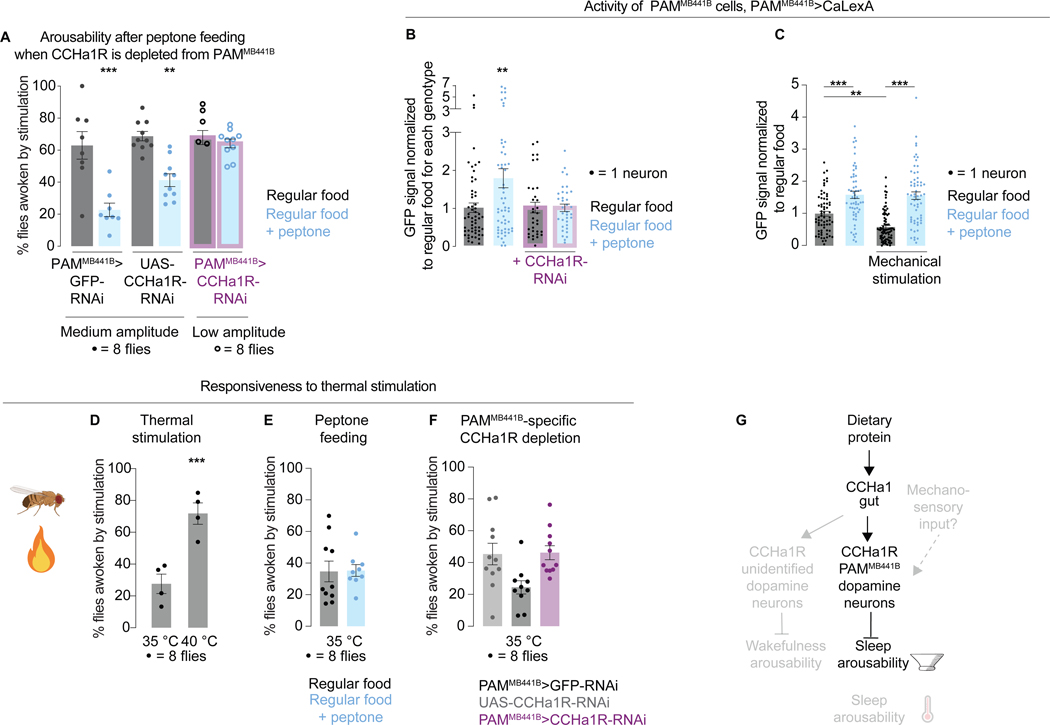
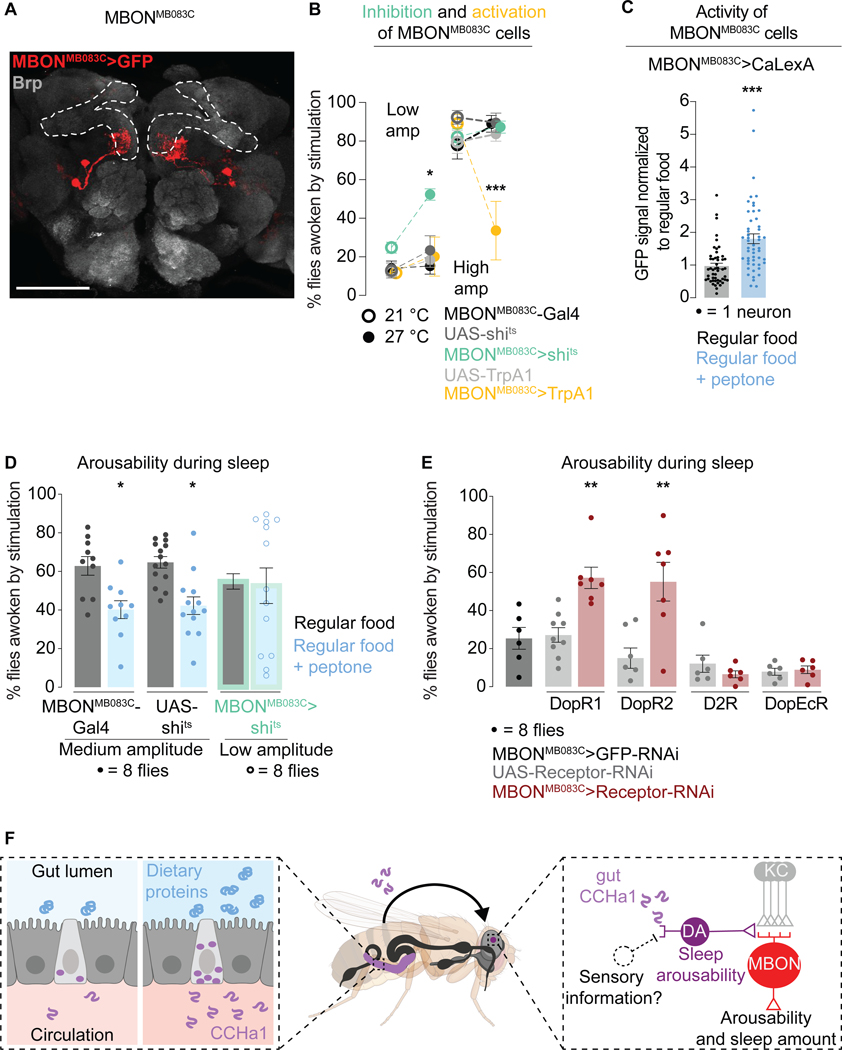
Suppressing sensory arousal is critical for sleep, with deeper sleep requiring stronger sensory suppression. The mechanisms that enable sleeping animals to largely ignore their surroundings are not well understood. We show that the responsiveness of sleeping flies and mice to mechanical vibrations is better suppressed when the diet is protein rich. In flies, we describe a signaling pathway through which information about ingested proteins is conveyed from the gut to the brain to help suppress arousability. Higher protein concentration in the gut leads to increased activity of enteroendocrine cells that release the peptide CCHa1. CCHa1 signals to a small group of dopamine neurons in the brain to modulate their activity; the dopaminergic activity regulates the behavioral responsiveness of animals to vibrations. The CCHa1 pathway and dietary proteins do not influence responsiveness to all sensory inputs, showing that during sleep, different information streams can be gated through independent mechanisms.


Conflict of interest statement

Declaration of interests The authors declare no conflict of interest.

Figures

Figure 1.
Figure 1.. CCHa1 and its receptor suppress arousability from sleep.
(A) Schematized screen for genes that regulate arousability from sleep, using weak (top) and strong (bottom) mechanical vibrations. Hyper- and hypo-arousable phenotypes exceeding two standard deviations from the mean are highlighted (data in Tables S1 and S2). Data were normalized for spontaneous arousals from sleep, and negative values are seen when spontaneous arousals are more frequent than arousals after stimulation. (B) Percent of flies awoken by weak mechanical vibrations when RNAis against CCHa1 or its receptor are expressed using elav-Gal4. (C) Mutants for CCHa1 or its receptor. In B and C grays represent parental controls. Error bars, mean and S.E.M. Genotypes, sample sizes and statistical analyses, Table S3. See also Figure S1. In all figures * p<0.05, ** p<0.01, *** p<0.001.
Figure 2.
Figure 2.. CCHa1 peptide signals from the gut to suppress arousability.
(A) Antibody staining against CCHa1 in the nervous system and the posterior midgut, in control animals (UAS-CCHa1-RNAi) and animals in which CCHa1 is depleted using elav-Gal4 (elav>CCHa1-RNAi). (B) CCHa1 staining, and arousability from sleep, when CCHa1 is conditionally depleted using pros-Gal4 (prosts>CCHa1-RNAi). In A and B, scale bars: 100 μm. (C) Arousability from sleep when enteroendocrine cells are activated (yellow), or when they are activated and simultaneously depleted of CCHa1 (pink). UAS-GFP was included to control for UAS number. (D) Schematic. Error bars, mean and S.E.M. Genotypes, sample sizes and statistical analyses, Table S3. See also Figure S2.
Figure 3.
Figure 3.. CCHa1-expressing enteroendocrine cells are activated by dietary proteins and promote deeper sleep.
(A) Schematized CaLexA tool. (B) A representative image showing the effect of protein supplementation on the levels of CaLexA-dependent GFP, and CCHa1, in enteroendocrine cells. Area outlined in the second panel in magnified in the third panel. White asterisks: activated CCHa1-producing cells. Magenta arrows: non-activated cells that produce CCHa1. Green arrows: activated cells that do not produce CCHa1. Scale bars: 100 μm and 25μm (zoom-in). (C) Quantification of enteroendocrine cell activity, and their levels of CCHa1 protein and mRNA. (D) CCHa1 protein levels after 6 or 24 hours of peptone supplementation. (E) CCHa1 levels in the gut when food is supplemented with individual or combined amino acids (at their respective concentrations in peptone). (F) CCHa1 levels relative to supplemented amino acid concentration. (G) Effect of dietary proteins on arousability from sleep, and total sleep amount. (H) Effect of equicaloric supplementation with different macronutrients on arousability from sleep. (I) Arousability from sleep on regular food (gray) vs peptone-supplemented food (blue), in controls (prosts>GFP-RNAi and UAS-CCHa1-RNAi) and in flies with gut-depleted CCHa1 (prosts>CCHa1-RNAi, purple outline). (J) Schematic. For (C , D, and E), normalized to regular food (STAR Methods). Error bars, mean and S.E.M. Genotypes, sample sizes and statistical analyses, Table S3. See also Figure S3.
Figure 4.
Figure 4.. Dietary proteins suppress arosuability from sleep in mice.
(A) Arousability from sleep in response to weak and strong vibrations in mice fed regular or protein-enriched food (equicaloric). (B,C) Arousability from sleep in response to weak vibrations in mice fed regular food, vs sugar-enriched (B) or fat-enriched (C) food (equicaloric). (D-G) Effect of dietary protein enrichment on various sleep parameters. Error bars, mean and S.E.M. Sample sizes and statistical analyses, Table S3. See also Figure S4.
Figure 5.
Figure 5.. CCHa1 regulates arousability through dopaminergic neurons in the brain.
(A) Arousabilty from sleep when the CCHa1 receptor is depleted with various Gal4 drivers. (B) Schematized dopaminergic neurons in the fly brain, and narrowing down of the population to which CCHa1 signals. (C) PAMMB441B-Gal4 expression in the brain is visualized with membrane-targeted GFP. Presynaptic protein Brp marks the neuropil, allowing visualization of the mushroom body (dashed outline). Scale bar: 100 μm. Arousabilty from sleep when the CCHa1 receptor is depleted from PAMMB441B neurons (PAMMB441B>CCHa1-RNAi). (D) Arousability from sleep when PAMMB441B neurons are inhibited (green) or activated (yellow). (E) Arousability from sleep when tyrosine hydroxylase (TH) is depleted from PAMMB441B neurons (PAMMB441B>TH-RNAi). (F) Schematic summary. Error bars, mean and S.E.M. Genotypes, sample sizes and statistical analyses, Table S3. See also Figure S5.
Figure 6.
Figure 6.. Dopaminergic activity is influenced by dietary proteins and CCHa1. Different sensory modalities can be gated independently.
(A) (I) Arousability from sleep on regular food (gray) vs peptone-supplemented food (blue), in controls (PAMMB441B>GFP-RNAi and UAS-CCHa1R-RNAi) and in flies with the CCHa1 receptor depleted from PAMMB441B neurons (PAMMB441B >CCHa1-RNAi, purple outline). (B) Activity of PAMMB441B neurons on regular vs protein-supplemented food. Purple outline, flies in which the CCHa1 receptor is depleted from PAMMB441B neurons. (C) Activity of PAMMB441B neurons on regular vs protein-supplemented food, with or without exposure to mechanical vibrations. (D) Arousability from sleep in response to heat. (E) Arousability by heat on regular vs peptone-supplemented food. (F) Arousability by heat in controls vs animals with the CCHa1 receptor depleted from PAMMB441B neurons. (G) Schematic. Error bars, mean and S.E.M. Genotypes, sample sizes, and statistical analyses, Table S3. See also Figure S6.
Figure 7.
Figure 7.. Mushroom body output neurons regulate arousability.
(A) The output neurons from the γ3 mushroom body compartment, visualized by MBONMB083C-Gal4-driven GFP. Brp labels synaptic terminals, allowing the mushroom body visualization (outlined). Scale bar: 100 μm. (B) Arousability from sleep when MBONMB083C are inhibited (green) or activated (yellow). (C) Activity of MBONMB083C neurons on regular vs peptone-supplemented food. (D) Arousability from sleep on regular vs protein-supplemented food. Green outline, flies in which MBONMB083C neurons are silenced. (E) Arousability from sleep when different dopamine receptors are depleted from MBONMB083C neurons. (F) Model. Error bars, mean and S.E.M. Genotypes, sample sizes, and statistical analyses, Table S3. See also Figure S7.

Comment in

References

    1. Keene AC, and Duboue ER (2018). The origins and evolution of sleep. J. Exp. Biol. 221 10.1242/jeb.159533. - DOI - PMC - PubMed
    1. Van Someren EJ, Cirelli C, Dijk DJ, Van Cauter E, Schwartz S, and Chee MW (2015). Disrupted Sleep: From Molecules to Cognition. J Neurosci 35, 13889–13895. 10.1523/JNEUROSCI.2592-15.2015. - DOI - PMC - PubMed
    1. Kline C. (2013). Sleep Quality. In Encyclopedia of Behavioral Medicine (Springer New York; ), pp. 1811–1813. 10.1007/978-1-4419-1005-9_849. - DOI
    1. Nelson KL, Davis JE, and Corbett CF (2022). Sleep quality: An evolutionary concept analysis. Nurs. Forum 57, 144–151. 10.1111/nuf.12659. - DOI - PubMed
    1. Roth T, Zammit G, Lankford A, Mayleben D, Stern T, Pitman V, Clark D, and Werth JL (2010). Nonrestorative sleep as a distinct component of insomnia. Sleep 33, 449–458. 10.1093/sleep/33.4.449. - DOI - PMC - PubMed

Publication types

LinkOut - more resources