. 2023 Apr 11;56(4):847-863.e8.
doi: 10.1016/j.immuni.2023.03.001. Epub 2023 Mar 22.

A transcriptionally distinct subset of influenza-specific effector memory B cells predicts long-lived antibody responses to vaccination in humans

Affiliations

A transcriptionally distinct subset of influenza-specific effector memory B cells predicts long-lived antibody responses to vaccination in humans

Anoma Nellore et al. Immunity. .

Abstract

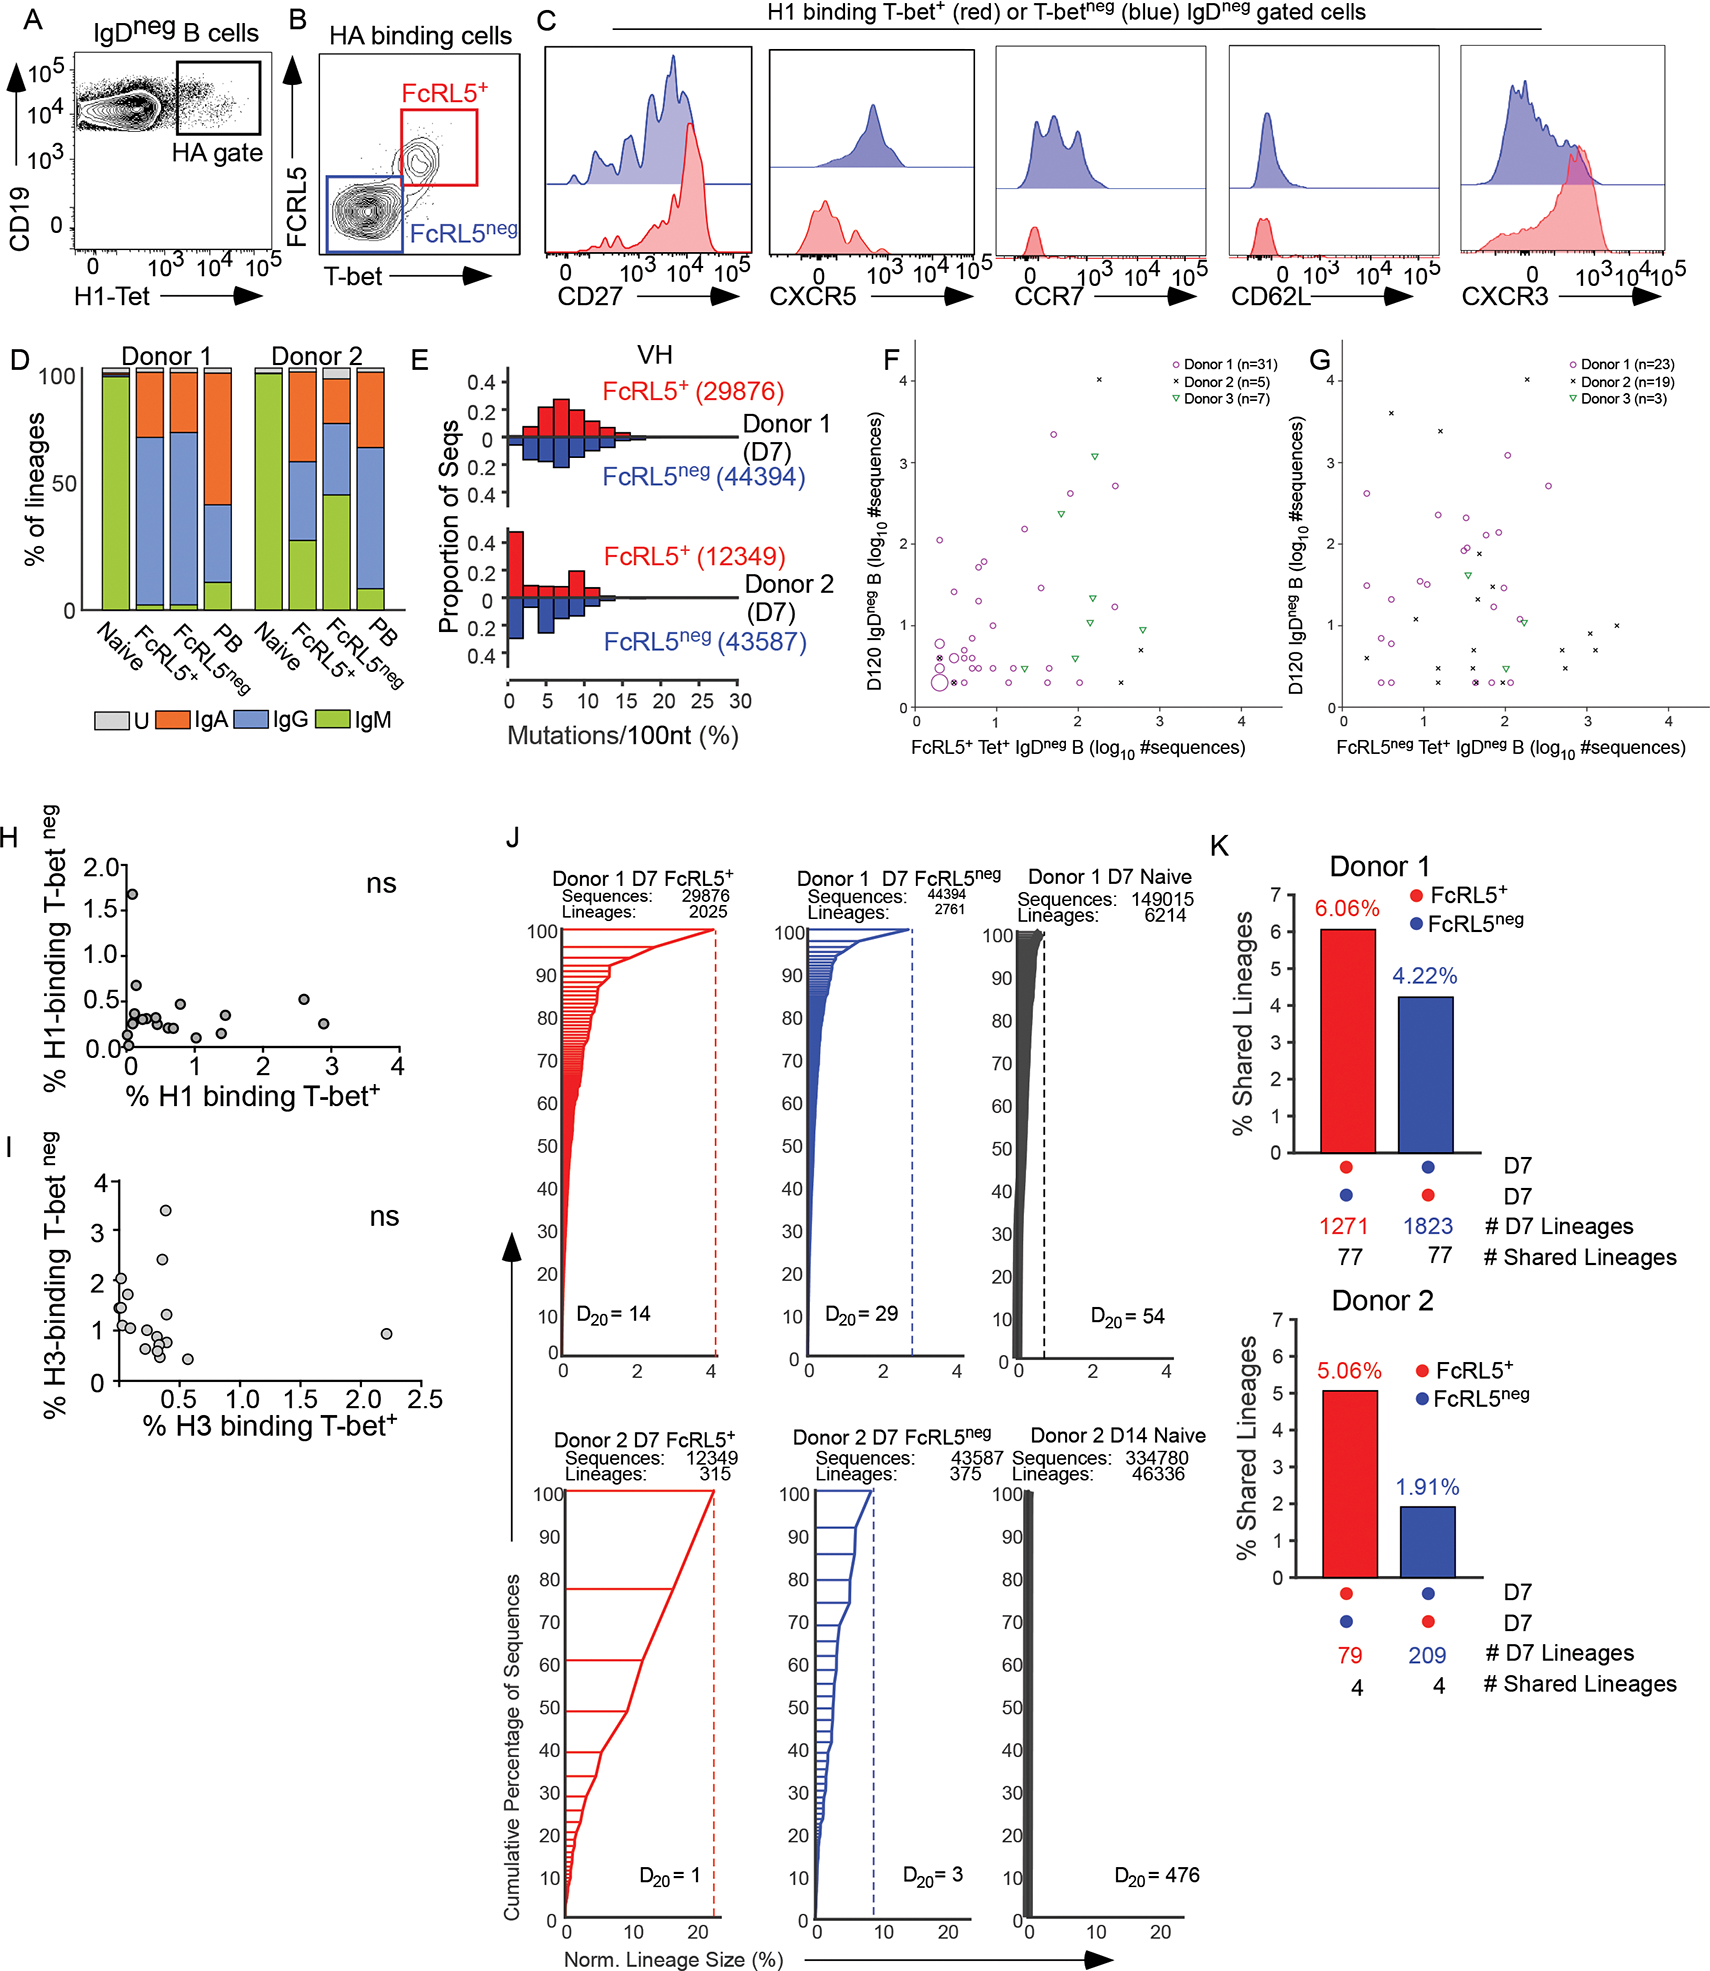
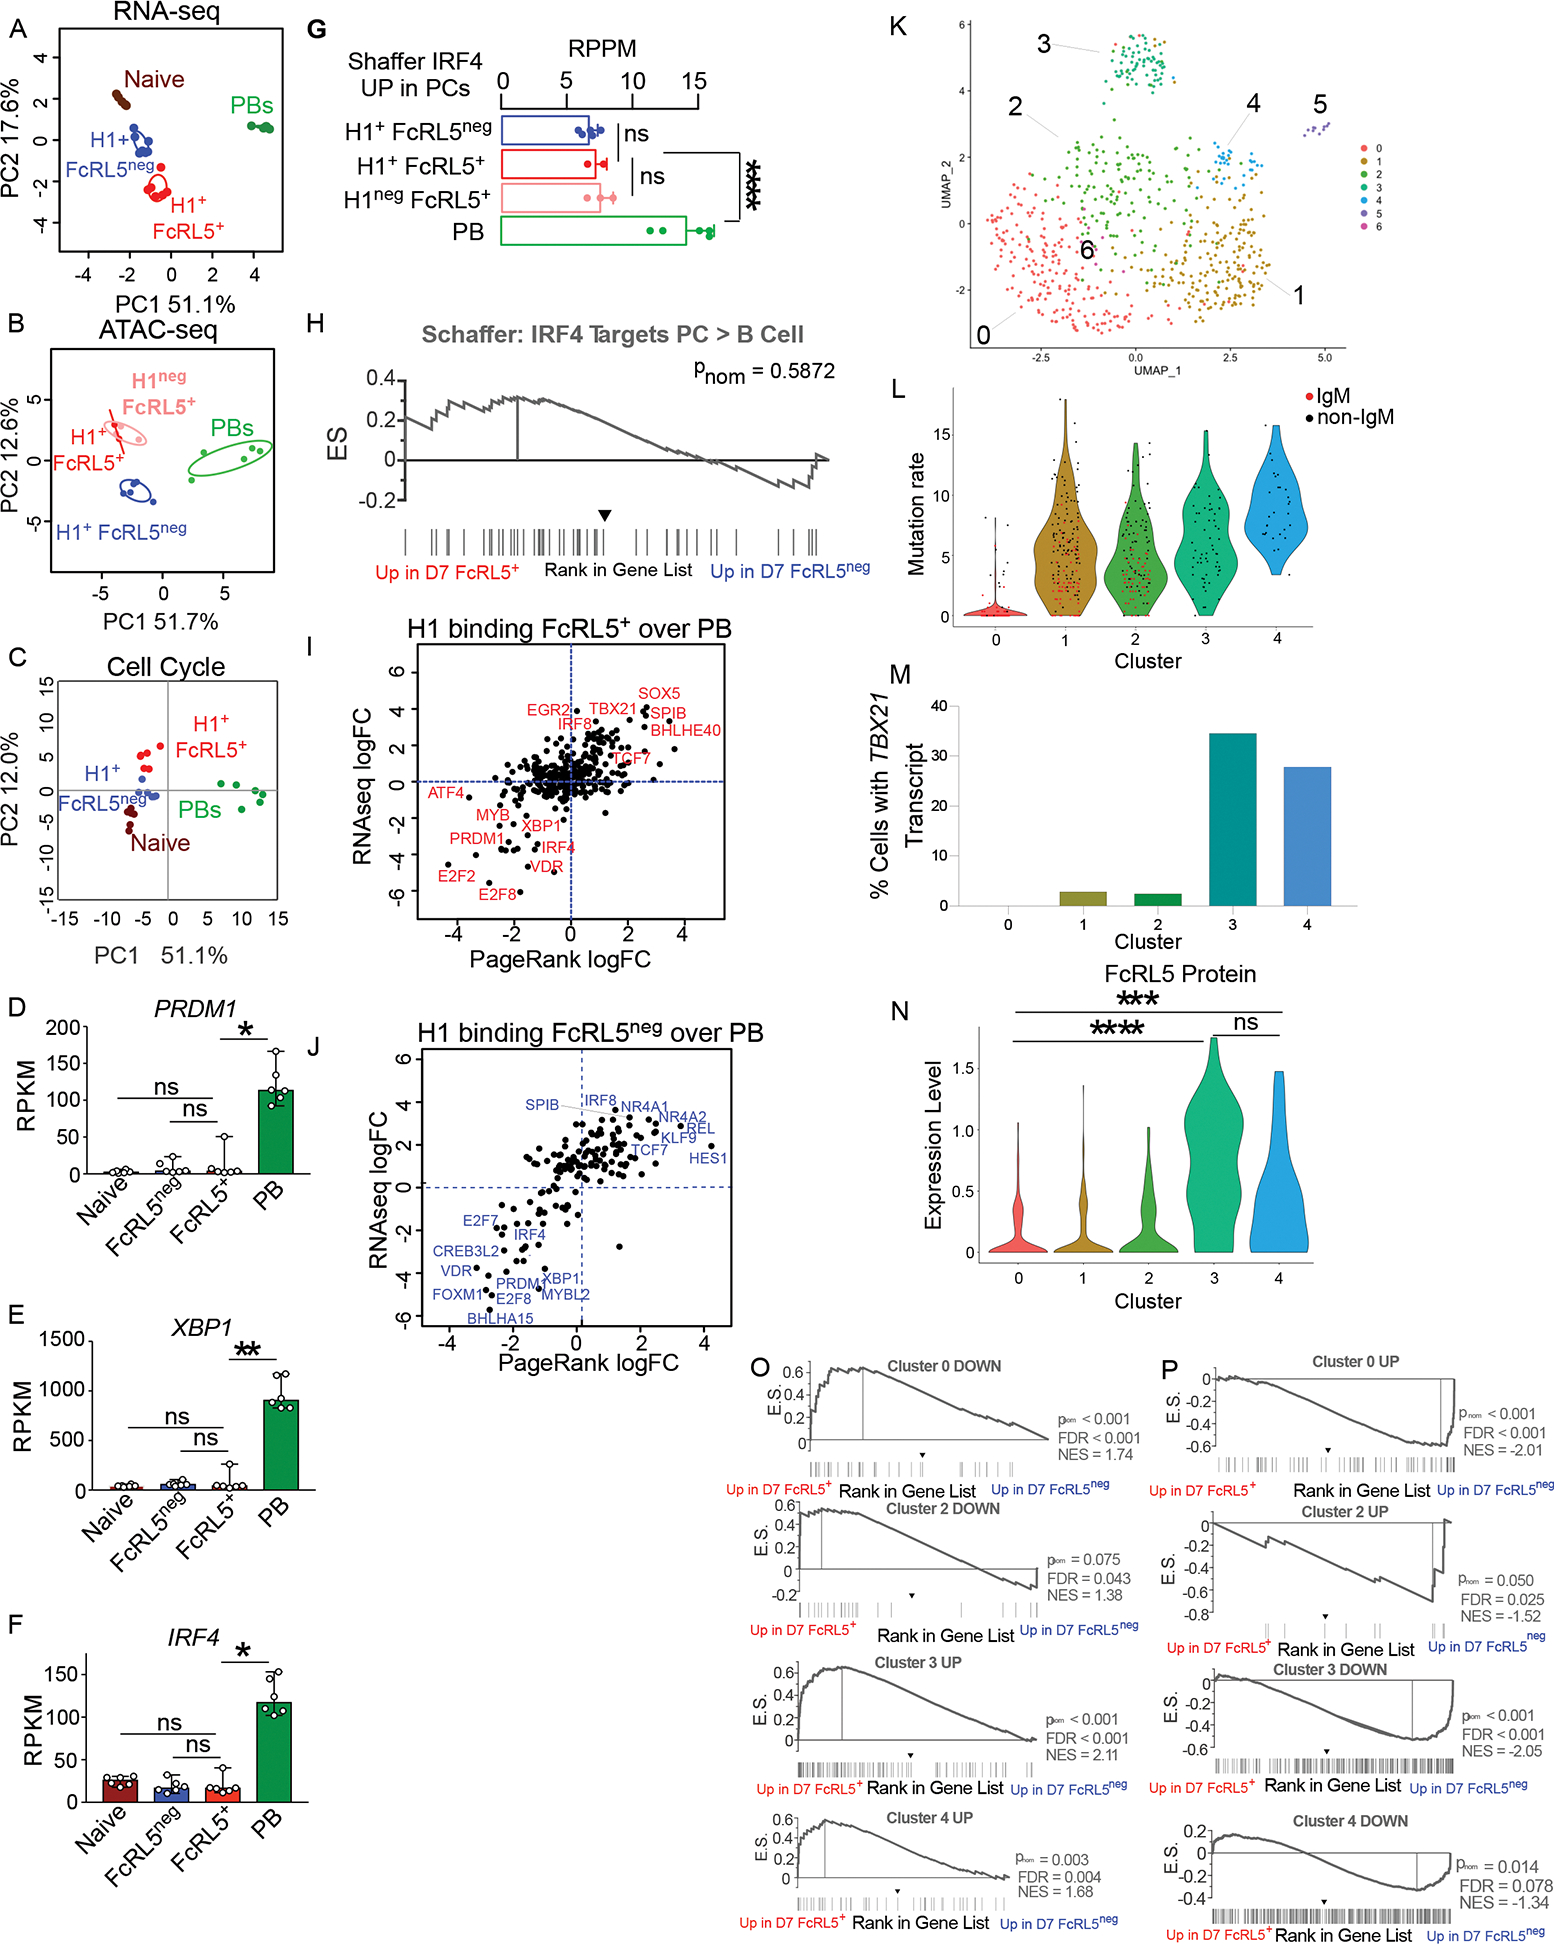
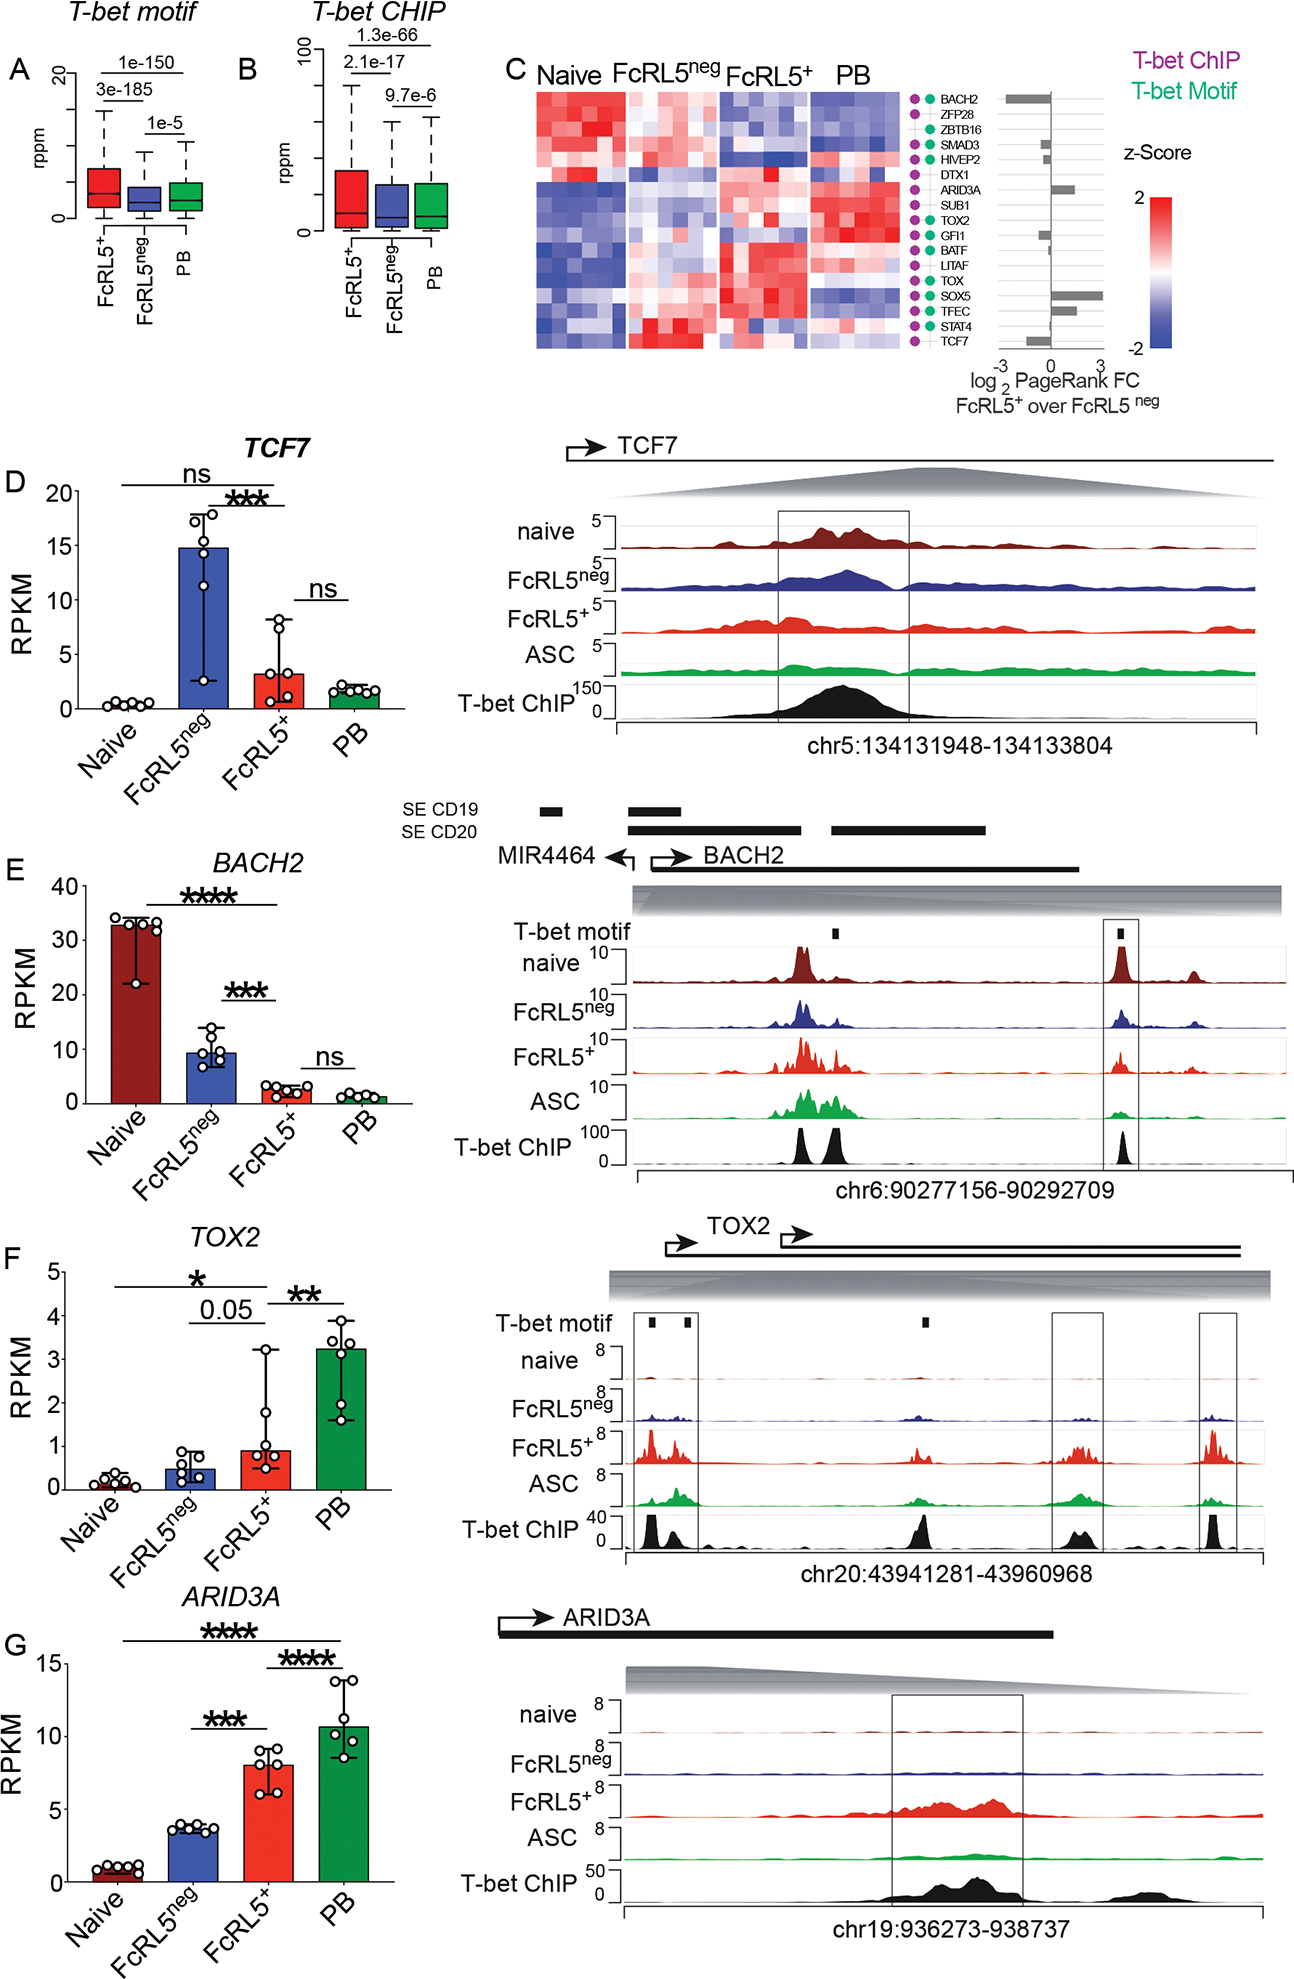
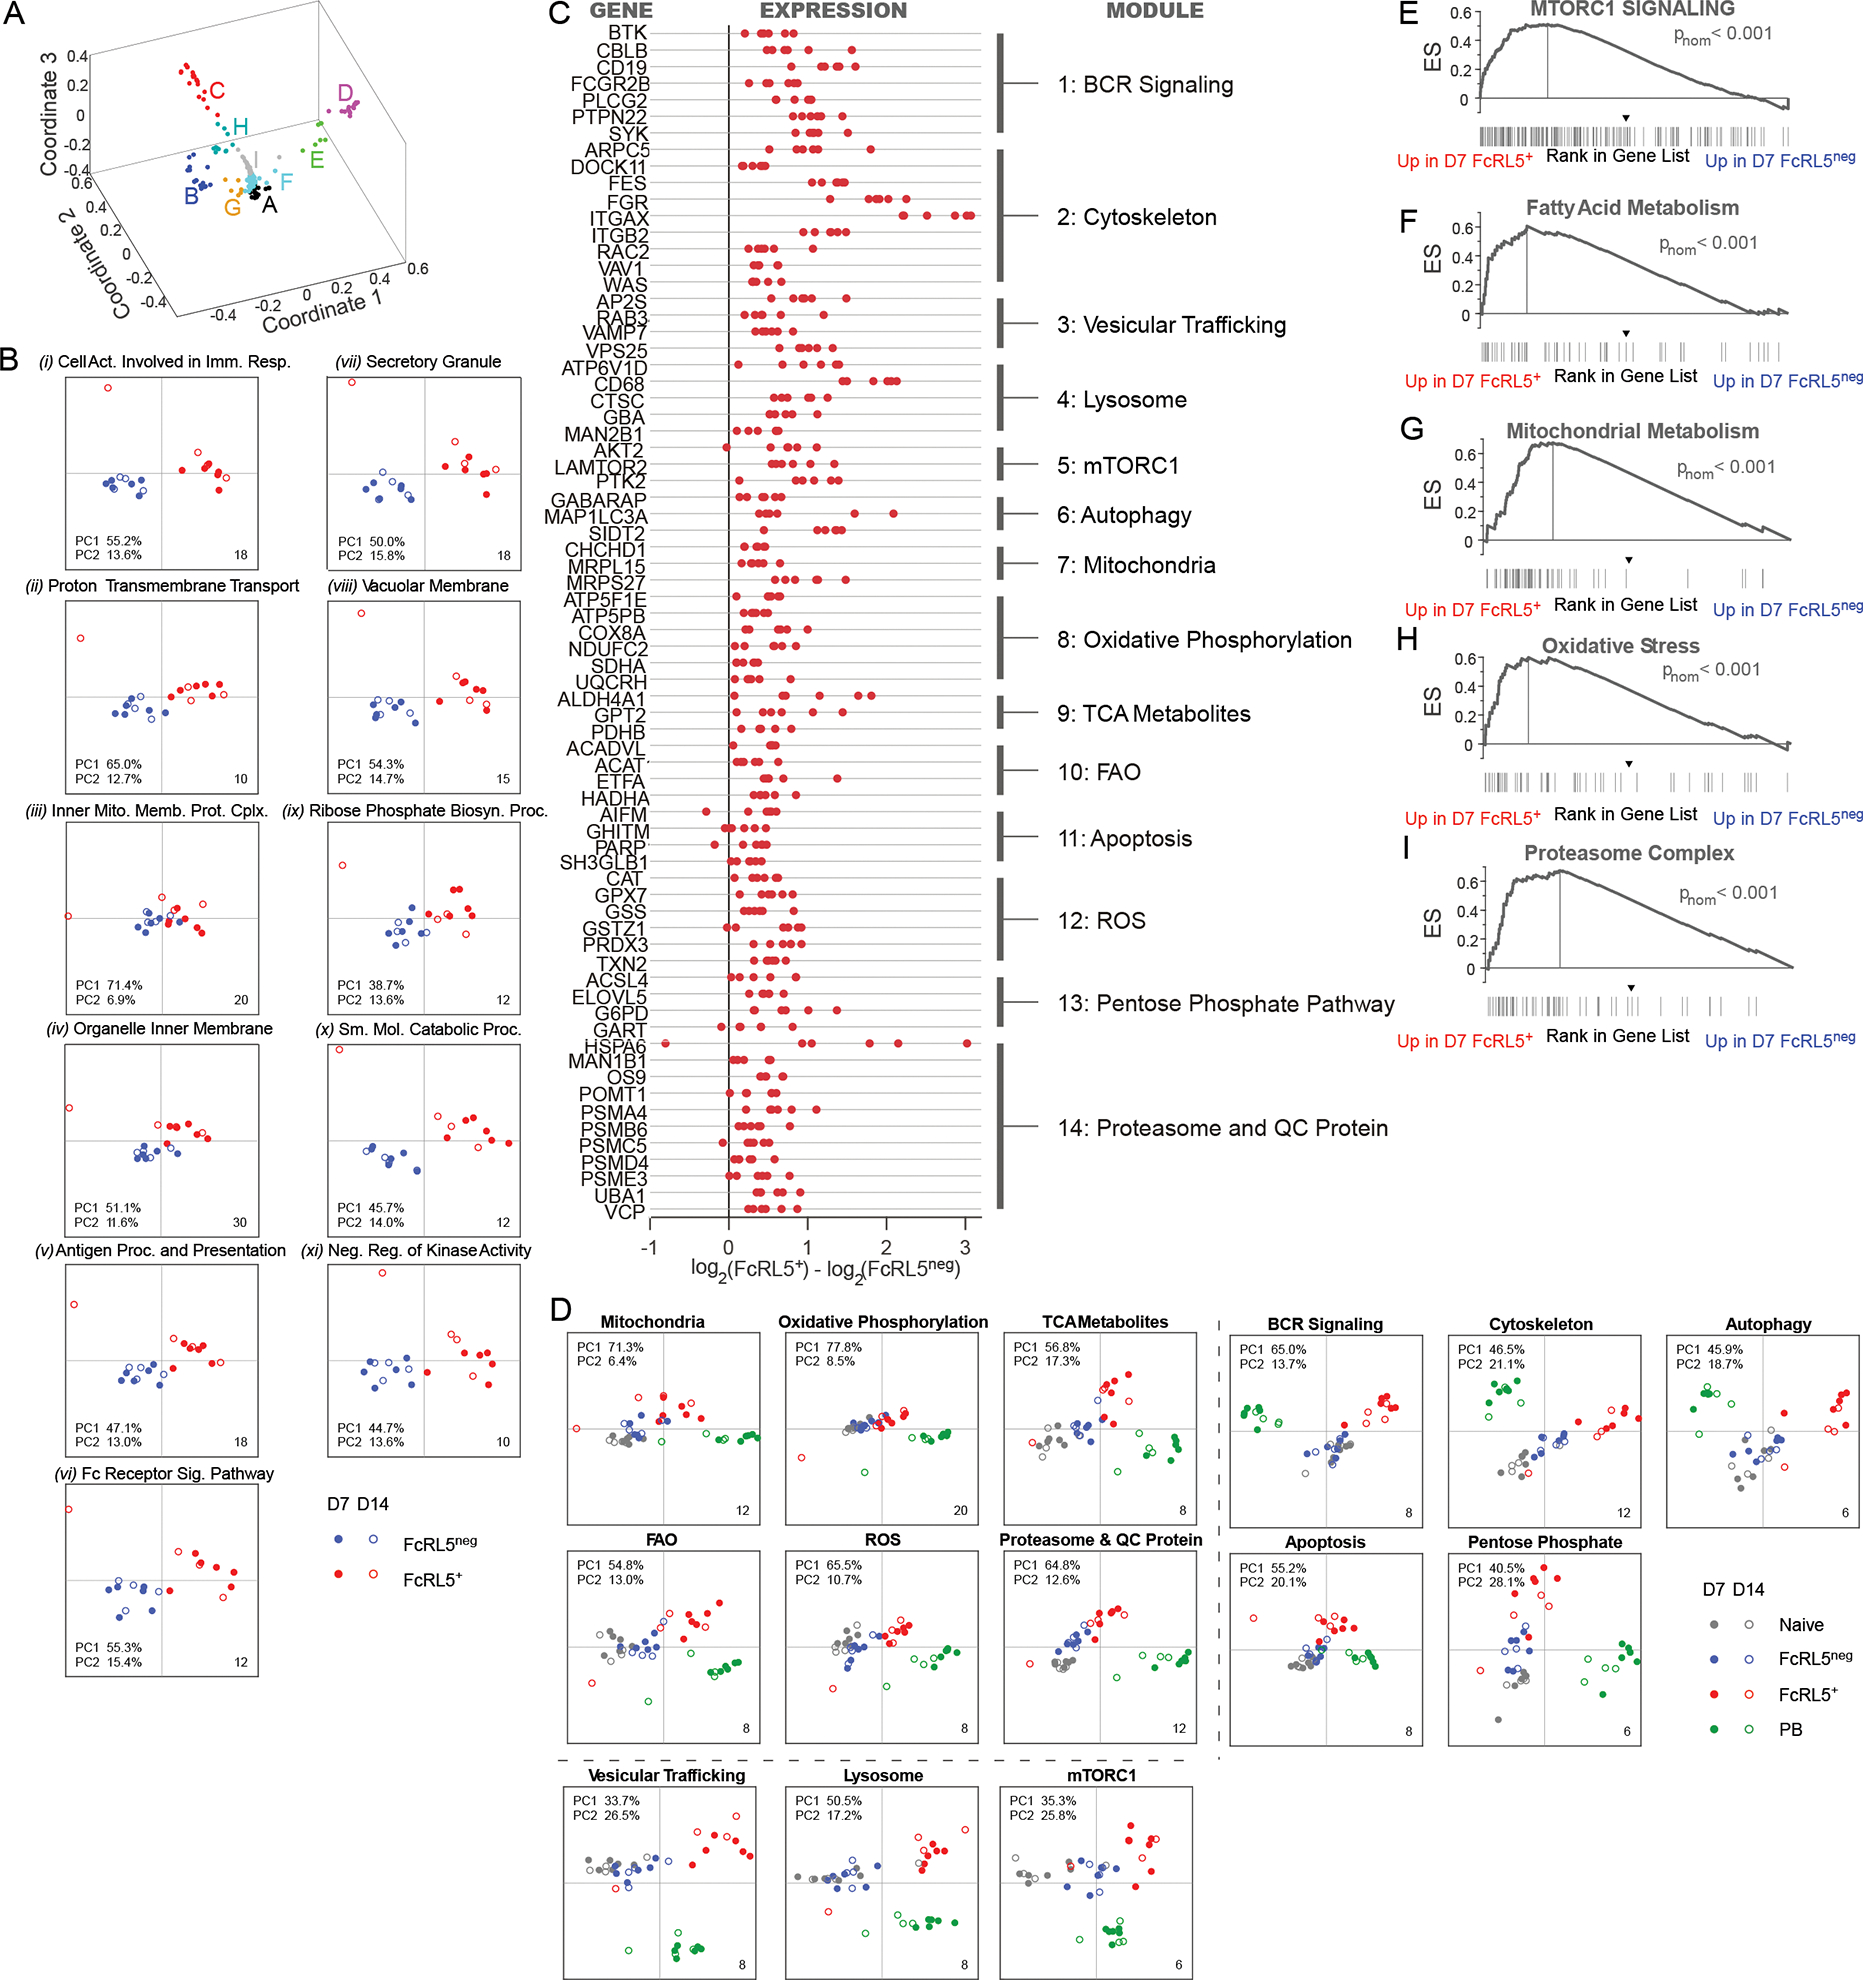
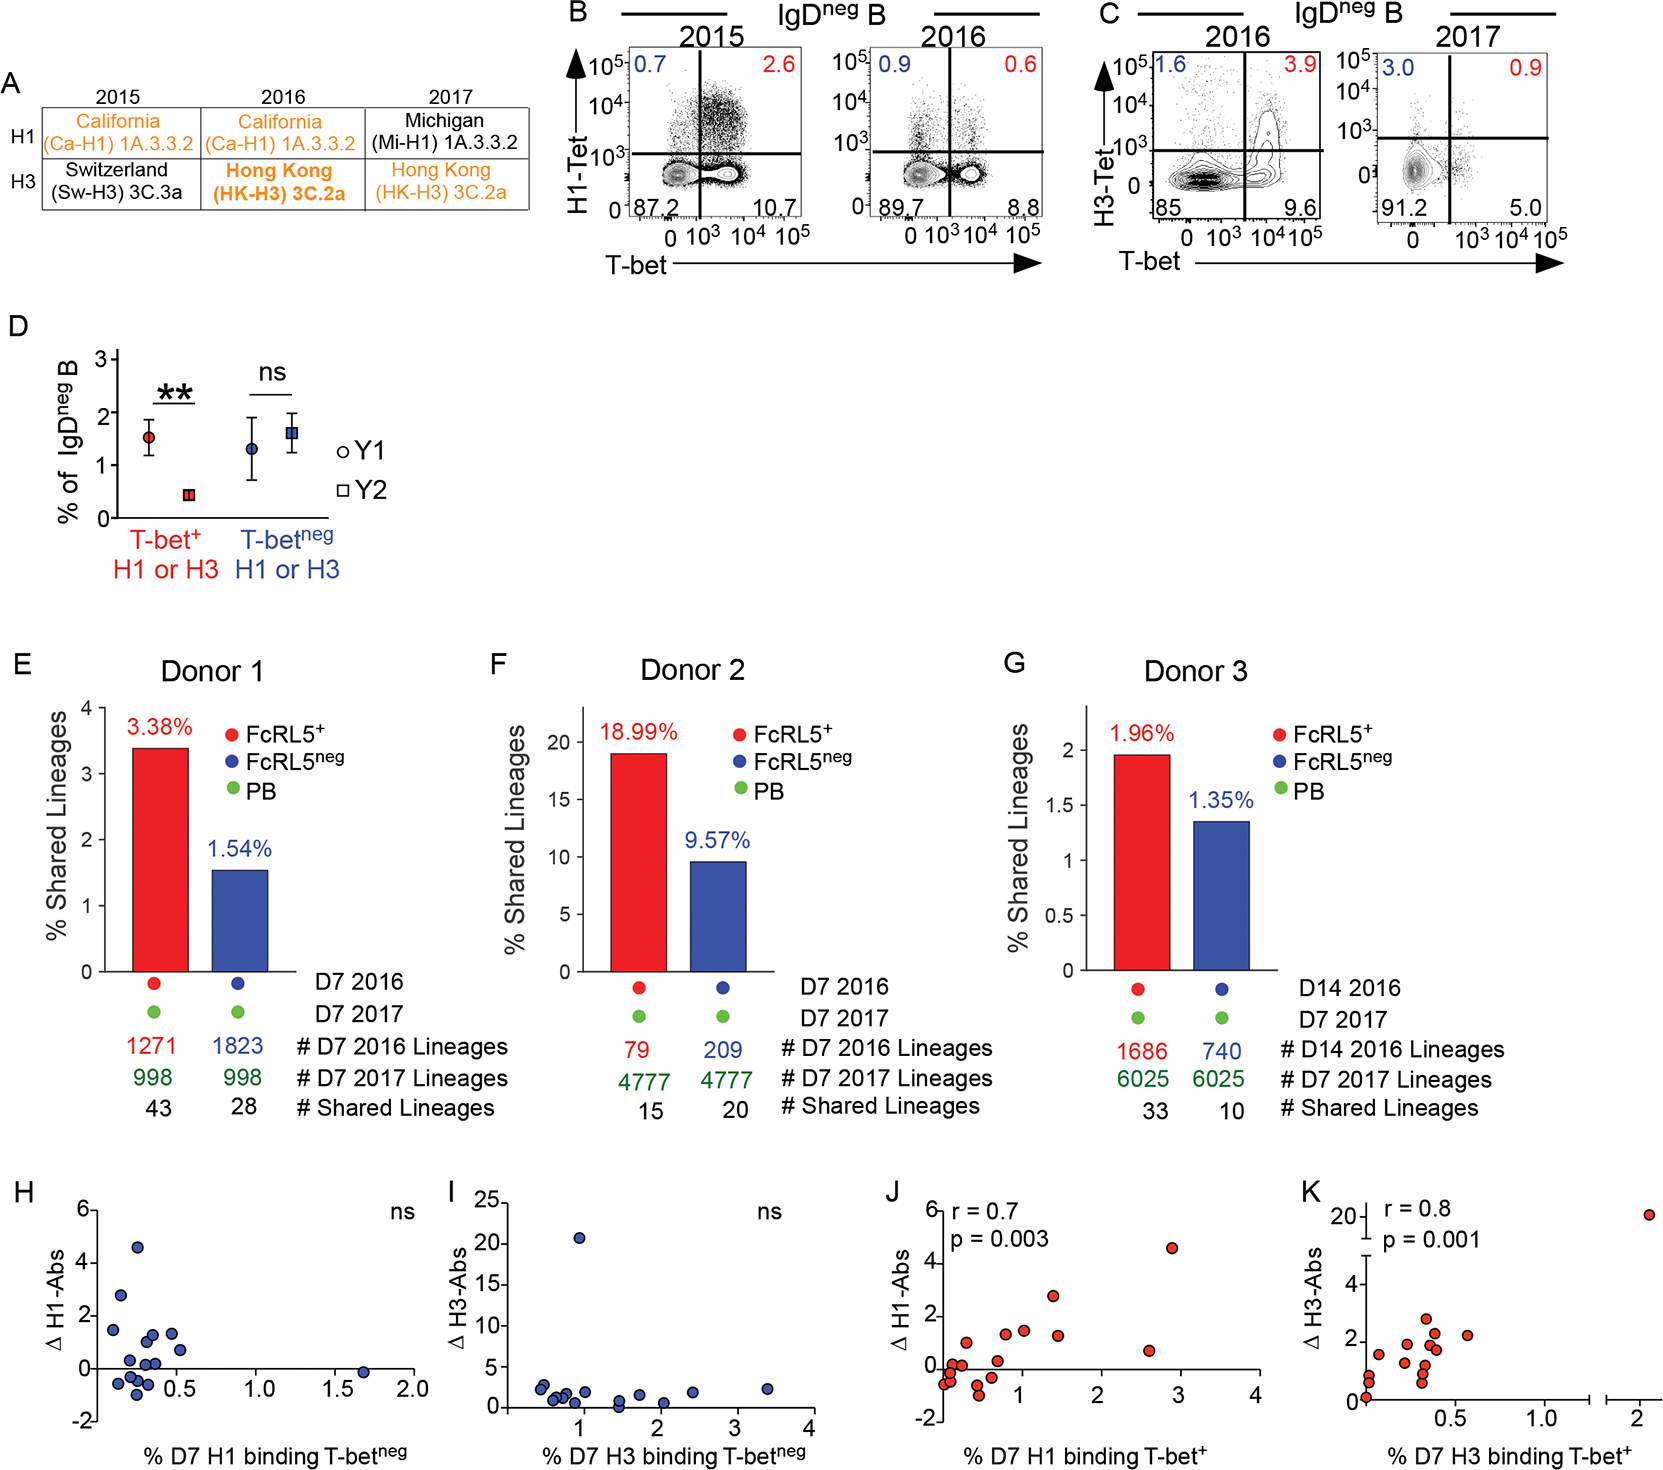
Seasonal influenza vaccination elicits hemagglutinin (HA)-specific memory B (Bmem) cells, and although multiple Bmem cell populations have been characterized, considerable heterogeneity exists. We found that HA-specific human Bmem cells differed in the expression of surface marker FcRL5 and transcriptional factor T-bet. FcRL5+T-bet+ Bmem cells were transcriptionally similar to effector-like memory cells, while T-betnegFcRL5neg Bmem cells exhibited stem-like central memory properties. FcRL5+ Bmem cells did not express plasma-cell-commitment factors but did express transcriptional, epigenetic, metabolic, and functional programs that poised these cells for antibody production. Accordingly, HA+ T-bet+ Bmem cells at day 7 post-vaccination expressed intracellular immunoglobulin, and tonsil-derived FcRL5+ Bmem cells differentiated more rapidly into antibody-secreting cells (ASCs) in vitro. The T-bet+ Bmem cell response positively correlated with long-lived humoral immunity, and clonotypes from T-bet+ Bmem cells were represented in the secondary ASC response to repeat vaccination, suggesting that this effector-like population predicts influenza vaccine durability and recall potential.

Keywords: T-bet; durable immunity; influenza vaccination; memory B cells; plasmablasts.


Conflict of interest statement

Declaration of interests The authors declare no competing interests.

Figures

Figure 1.
Figure 1.. Seasonal influenza vaccination elicits distinct HA-specific Bmem cell subsets.
(A-C) FACS plots showing HA-tetramer binding versus CD19 expression (A) and FcRL5 versus T-bet expression (B) by HA-specific IgDneg B cells from blood of a D7 post-IIV HD. Histograms (C) showing cell surface marker expression by the H1-specific IgDneg T-bet+ (red) and T-betneg (blue) B cells. (D-E) IGH VH BCR repertoire analysis of sort-purified circulating H3-specific FcRL5+ and FcRL5neg IgDneg B cells, IgD+ naïve B cells, and IgDnegCD38hi PBs from 2 HD on D7 post-IIV. Isotype distribution (D) in each D7 subset (U = “unidentified”). Distribution of VH sequence mutation frequencies (E) in H3-specific IgDneg FcRL5+ and FcRL5neg cells. Number of sequences in each population indicated. (F-G) Shared lineages between D120 total IgDneg B cells (y-axis) and HA-specific FcRL5+ (F) or FcRL5neg (G) IgDneg B cells (x-axis) from 3 HDs on D7 or D14 post-IIV. Axes indicate size of shared lineages (symbols) defined as ≥2 sequences in each lineage in each population. Numbers of shared lineages (n) for each donor indicated. Larger symbols represent multiple shared lineages of the same sizes. (H-I) Frequencies of T-bet+ and T-betneg cells within H1-specific (H) or H3-specific (I) IgDneg B cell subsets measured in each individual (n=19) on D7 post-IIV. ns = not significant. (J) VH BCR lineages in sort-purified naïve and D7 H3-specific FcRL5+ or FcRL5neg IgDneg B cells with lineages ordered by size (y-axis) and % of total number of sequences (x-axis). Data reported as Diversity index 20 (D20) values, total number of sequences per subset, and lineages per subset. (K) Lineage sharing between D7 FcRL5+ and FcRL5neg subsets reported as percentage of shared non-singleton lineages. The numbers of shared and total non-singleton lineages per donor and subset also reported. Additional BCR repertoire data reported in Table S1, Fig 1F–J and Fig. S1N. See Fig. S1 for gating strategy and additional phenotypic characterization of B cell subsets.
Figure 2.
Figure 2.. H1-specific FcRL5+ and FcRL5neg Bmem cells are transcriptionally and epigenetically distinct.
(A-J) RNA-seq and ATAC-seq analyses performed on D7 post-IIV B lineage subsets from 5–6 HDs. (A-B) PCA of RNA-seq (A) and ATAC-seq (B) data sets from D7 B lineage subsets. (C) PCA of cell cycle genes expressed by D7 B cell subsets. (D-F) PRDM1 (D), XBP1 (E) and IRF4 (F) mRNA expression by D7 B cell subsets. (G-H) Accessibility and expression of published IRF4-regulated ASC genes by D7 B lineage subsets. Chromatin accessibility surrounding IRF4 ASC regulon genes (G) is reported as the mean peak accessibility for all peaks mapping to IRF4 ASC regulon genes. GSEA (H) comparing the RNA-seq ranked gene list from D7 H1-specific IgDneg FcRL5+ vs FcRL5neg B cells to the IRF4 ASC regulon gene set. (I-J) PR identified TFs predicted to regulate gene networks in D7 PBs and IgDneg H1-specific Bmem cell subsets. Data reported as logFC in PR score and logFC in mRNA expression of each TF with D7 FcRL5+ Bmem cells over PB (I) or D7 FcRL5neg Bmem cells over PBs (J). Selected TFs indicated. (K-P) Single cell RNA-seq, BCR-seq and CITE-seq analyses of sort-purified HA-specific IgDneg B cells from 2 HD between D7-D21 post-IIV. (K) UMAP showing transcriptional clusters (C0-C6) from single cell RNA-seq data. (L) BCR-seq analysis of single cells in Clusters C0-C4. Data reported as VH gene mutation frequency. Unswitched (IgM+, red dots) and switched (black dots) cells are shown. (M) TBX21 expression reported as % of cells in each cluster with at least one TBX21 transcript. (N) CITE-seq analysis of FcRL5 protein in HA-specific IgDneg in Clusters C0-C4. Expression in single cells normalized using scTransform and shown as violin plots. (O-P) GSEA comparing the ranked gene list from D7 H1-specific IgDneg FcRL5+ vs FcRL5neg B cells to the upregulated or downregulated DEGs in each single cell cluster. Data shown include single cell DEG sets enriched in D7 H1-specific IgDneg FcRL5+ (O) or FcRL5neg (P) B cells. pnom values indicated. Data sets for RNA-seq, ATAC-seq, PR analysis, GSEA gene sets, and sc-seq datasets are provided in Tables S2–S4. Fig. S2 has additional RNA expression analysis from D7 (S2A-B) and D14 (S2C-I) B lineage subsets. Statistical analyses performed using one-way ANOVA (D-F, N). *p< 0.05, **, p<0.01, *** p<0.001, **** p <0.0001 ns= non-significant.
Figure 3.
Figure 3.. Division of H1-specific B cells into FcRL5+ effector-like and FcRL5neg stem-like Bmem cells.
(A) Volcano plot showing DEG upregulated in D7 H1-specific IgDneg FcRL5+ (red) and FcRL5neg (blue) Bmem cells. (B) GSEA comparing the ranked gene list from D7 H1-specific IgDneg FcRL5+ and FcRL5neg B cells to DEG that are either upregulated (KAECH) or down-regulated (GOLDRATH) in effector vs memory CD8+ T cells. (C) TFs identified by PR as regulators of the D7 H1-specific IgDneg FcRL5+ and D7 H1-specific IgDneg FcRL5neg gene networks. (D-E) Shared BCR VH lineages between H1-specific IgDneg Bmem cells isolated from the same donor at sequential timepoints. Data reported as percentage of shared lineages between different Bmem cell populations over time. The numbers of non-singleton lineages identified in each subset at each timepoint and the numbers of shared lineages for each pairwise comparison indicated. (F) TFs identified by PR as regulators of D14 H1-specific IgDneg FcRL5+ and D14 H1-specific IgDneg FcRL5neg gene networks. Data sets for BCR repertoire, RNA-seq, PR, and GSEA genesets provided in Tables S1–S3.
Figure 4.
Figure 4.. The transcriptome and epigenome of FcRL5+ Bmem cells display T-bet associated changes.
(A-B) Box plots showing chromatin accessibility surrounding (within 50 bp) defined T-bet motifs (A) and previously identified T-bet ChIP-seq peaks (B) in memory FcRL5+, FcRL5neg and PB populations. (C) Expression of transcriptional regulators (n=17) that were identified as DEG between FcRL5+ and FcRL5neg Bmem cells and were also assigned to at least one DAR that contained a T-bet binding motif (green dots) and/or ChIP-seq T-bet binding site (purple dot). Data shown as a heat map displaying per-regulator gene z-scores of log expression in the indicated subsets. PR scores for each regulator shown as absolute value log2 FC of FcRL5+ over FcRL5neg cells. (D-G) RNA-seq expression and genome ATAC-seq plots for TCF7 (D), BACH2 (E), TOX2 (F) and ARID3A (G). Genome ATAC-seq plots aligned with ChIP-seq T-bet binding sites and with ATAC-seq from resting naïve B cells. Boxes indicate loci with significant DAR. Vertical black bars indicate HOMER-predicted consensus T-bet binding motifs. Super-enhancers in BACH2 locus identified in CD19+ and CD20+ human B cells shown as horizontal black bars. Shaded gray triangles indicate location of DAR-containing regions within each locus. Statistical analyses were performed using one-way ANOVA (D-G). *p< 0.05, **, p<0.01, *** p<0.001, **** p <0.0001 ns= non-significant. Data sets for RNA-seq, ATAC-seq, transcriptional regulators and PR analyses are provided in Tables S2–S3.
Figure 5.
Figure 5.. Metabolic gene expression differs between FcRL5+ effector and FcRL5neg stem-like Bmem cells.
(A-C) Identification of signaling and metabolic gene modules in FcRL5+ Bmem cells. Clustering (A) of leading-edge genes from 185 GO gene lists (mSigDB v.7) that were enriched (FDR q < 0.01) for expression in D7 FcRL5+ relative to D7 FcRL5neg Bmem cells. Nine clusters (A-I) with overlapping leading edge gene sets were identified. Eleven prototypic GO gene lists (lists i-xi) representing the 9 GO gene set clusters were selected and the leading-edge genes from gene lists were functionally annotated and used for PCA (B) comparing D7 and D14 H1-specific IgDneg FcRL5+ and FcRL5neg Bmem cells. The leading-edge genes were grouped into 14 signaling and metabolic modules (C) with representative genes from each module shown as the difference in log2 FC in expression by D7 H1-specific IgDneg FcRL5+ and FcRL5neg Bmem cells. Red dots indicate individual samples with FDR q<0.05. (D) PCA using the 14 module gene sets comparing naïve B, D7 PB and D7 or D14 H1-specific IgDneg FcRL5+ and H1+ IgDneg FcRL5neg Bmem cells. (E-I) GSEA comparing the RNA-seq ranked gene list from D7 H1-specific IgDneg FcRL5+ and FcRL5neg B cells to curated gene lists for mTORC1 signaling (E), fatty acid metabolism (F), mitochondrial metabolism (G), oxidative stress (H) and proteasome complex (I). GSEA pnom-values indicated. Table S2 and Fig. S3 include clustering and module data, leading-edge genes from prototypic GO-gene lists, and gene lists for the signaling and metabolism modules and GSEA genesets.
Figure 6.
Figure 6.. FcRL5+ Bmem cells are metabolically poised to secrete Ab.
(A-D) Metabolic flow assays using tonsil-derived matched (n=6–8 donors) FcRL5+ and FcRL5neg IgDnegCD27+ Bmem cells. ROS activity (A) measured with 2, 7–dichlorohydrofluorescein diacetate (H2DCF). Mitochondrial mass (B) measured with Mitotracker Green. Membrane lipid composition (C) measured with BODIPY510. mTORC1 activation (D) measured with anti-phospho-S6 (pS6) kinase Ab. Data reported as geometric mean fluorescence (gMFI) and shown as paired analysis between FcRL5+ and FcRL5neg cells purified from the same donor. (E-I) Proliferation and differentiation of purified donor-matched naïve (brown), FcRL5+ (red) or FcrL5neg (blue), IgDnegCD27+CD38lo/med tonsil Bmem cells. CTV labeled cells were stimulated with R848, IL-21, IL-2 and IFN-γ and assessed on D2. Cell survival (E) and frequency of cells per cell division (F) on D2 were determined by flow cytometry and reported as the mean ± SD (n = 5 donors). ASCs in D2 cultures enumerated by flow cytometry (G) with frequencies of total CD27hiCD38hi ASCs (H) and percentage of ASCs in each cell division (I) reported. (J-K) GSEA comparing the ranked gene list from D7 H1-specific IgDneg FcRL5+ and FcRL5neg Bmem cells to genes induced by the mTORC1-dependent B cell activation UPR (J) or the mTORC1-dependent PC inductive UPR (K). (L) Flow cytometry showing H1 tetramer-binding by D7 T-bet+ and T-betneg IgDneg gated B cells. (M) Extracellular expression of IgG and IgA by D7 IgDneg HA-specific FcRL5neg and FcRL5+ Bmem cells after sequential staining with Abs to FcRL5, IgD, CD19 and HA tetramers (H1 and H3) followed by anti-IgG and anti-IgA Abs. (N) RNA-seq analysis of IgH transcripts (IgHG1, IgHG2, IgHG3, IgHG4, IgHA1, IgHA2) from sort-purified D7 IgDneg HA-specific FcRL5neg and FcRL5+ Bmem cells. (O-R) Image Stream analysis of sort-purified D7 post-IIV CD19+IgDneg cells measuring expression of CD38, plasma membrane Ig (detected with H1-APC tetramer), intracellular T-bet, and intracellular Ig (detected with H1-PE tetramer). Representative images (O) of individual CD38hi PBs (n=211 cells), H1 tetramer-binding T-bet+ (n=195 cells) and T-betneg (n=62 cells) cells. Intensity of intracellular (IC) H1 tetramer staining (P) and extracellular (EC) H1 tetramer staining (Q) and the ratio of EC/IC H1 tetramer staining (R) in each T-betneg, T-bet+ and CD38hi cell was determined. Ratio in (R) shown as median for the individual cells within each subset and error bars indicating the 95% confidence interval. Fig. S4 shows additional analyses of tonsil B cell subsets, gated or purified as in (Fig. S4A–C) and examined in metabolism assays (Fig. S4D–G) or after in vitro stimulation for 2–3 days (Fig. S4H–N). Table S2 and Fig. S5A provide mTORC1-controlled UPR gene set data. Table S5 and Fig. S5C–D report BCR affinity measurements. Fig. S5B shows HA-binding expression over 8 weeks post-IIV and Fig. S5E shows expression of transmembrane and secretory Ig exon transcripts. Statistical analyses were performed using Wilcoxon matched-pairs signed rank tests (A-D, N), one-way ANOVA with Kruskal-Wallis Multiple Comparisons Testing (P,Q) and one-way ANOVA with Tukey’s multiple comparison testing (E, H, R). *p< 0.05, **, p<0.01, *** p<0.001, **** p <0.0001 ns= non-significant.
Figure 7.
Figure 7.. HA-specific IgDneg T-bet+ eBmem cells contribute to secondary ASC responses and predict enduring humoral immunity.
(A) Composition of H1 and H3 Ags in 2015–2017 IIV. (B-D) Enumeration of D7 H1- or H3-specific IgDneg T-bet+ and T-betneg B cells in HD sequentially immunized with IIV between 2015 and 2016 (n=6) or between 2016 and 2017 (n=5). FACS analysis showing H1-CA09+ Bmem cells over 2 years (2015–2016) from a HD immunized with the same CA09-H1 Ag each year (B) or showing HK14-H3 Bmem cells over 2 years (2016–2017) from a HD vaccinated with the same HK14-H3 Ag each year (C). Frequencies (D), represented as mean with standard error, of the H1-specific or H3-specific T-bet+ or T-betneg B cells for 11 HD vaccinated over 2 years with IIV containing matched H1 or H3 Ags. ** p = 0.002 Wilcoxon matched-pairs signed rank tests. (E-G) VH BCR repertoire analysis performed on H3-specific IgDneg FcRL5+ and FcRL5neg Bmem cells isolated from HDs (n=3) on D7 (E-F) or D14 (G) post-IIV and PBs isolated from the same donors one year later on D7 following re-vaccination. Data reported as percentage of shared non-singleton lineages between year 1 Bmem cells and year 2 PBs. The number of shared lineages between the PBs and Bmem cell subsets and the number of non-singleton lineages identified by population and timepoint are indicated. (H-K) Correlation analysis of D7 IgDneg HA-specific Bmem cell responses (frequencies in blood, x axis) and vaccine-specific Ab responses (FC in titers between D0 and D120, Y axis) after IIV in HD (n=19). Comparisons include FC in H1-specific IgG titers vs % D7 H1-specific T-betneg Bmem cells (H); FC in H3-specific IgG titers and % D7 H3-specific T-betneg Bmem cells (I); FC in H1-specific IgG titers and % D7 H1-specific T-bet+ Bmem cells (J); and FC in H3-specific IgG titers and % D7 H3-specific T-bet+ Bmem cells (K). Spearman correlation (r) and significance (p) are provided. ns = no significant correlation. See Table S1 for additional correlation analyses.

References

    1. Andrews SF, Huang Y, Kaur K, Popova LI, Ho IY, Pauli NT, Henry Dunand CJ, Taylor WM, Lim S, Huang M, et al. (2015). Immune history profoundly affects broadly protective B cell responses to influenza. Sci Transl Med 7, 316ra192. 10.1126/scitranslmed.aad0522. - DOI - PMC - PubMed
    1. Turner JS, Zhou JQ, Han J, Schmitz AJ, Rizk AA, Alsoussi WB, Lei T, Amor M, McIntire KM, Meade P, et al. (2020). Human germinal centres engage memory and naive B cells after influenza vaccination. Nature 586, 127–132. 10.1038/s41586-020-2711-0. - DOI - PMC - PubMed
    1. Lee FE, Halliley JL, Walsh EE, Moscatiello AP, Kmush BL, Falsey AR, Randall TD, Kaminiski DA, Miller RK, and Sanz I (2011). Circulating human antibody-secreting cells during vaccinations and respiratory viral infections are characterized by high specificity and lack of bystander effect. J Immunol 186, 5514–5521. 10.4049/jimmunol.1002932. - DOI - PMC - PubMed
    1. Laidlaw BJ, and Cyster JG (2020). Transcriptional regulation of memory B cell differentiation. Nat Rev Immunol. 10.1038/s41577-020-00446-2. - DOI - PMC - PubMed
    1. Yao C, Lou G, Sun HW, Zhu Z, Sun Y, Chen Z, Chauss D, Moseman EA, Cheng J, D’Antonio MA, et al. (2021). BACH2 enforces the transcriptional and epigenetic programs of stem-like CD8(+) T cells. Nat Immunol. 10.1038/s41590-021-00868-7. - DOI - PMC - PubMed

Publication types

LinkOut - more resources