. 2023 Aug;72(8):1472-1485.
doi: 10.1136/gutjnl-2022-328048. Epub 2023 Mar 23.

Faecal metabolome and its determinants in inflammatory bowel disease

Affiliations

Faecal metabolome and its determinants in inflammatory bowel disease

Arnau Vich Vila et al. Gut. 2023 Aug.

Abstract

Objective: Inflammatory bowel disease (IBD) is a multifactorial immune-mediated inflammatory disease of the intestine, comprising Crohn's disease and ulcerative colitis. By characterising metabolites in faeces, combined with faecal metagenomics, host genetics and clinical characteristics, we aimed to unravel metabolic alterations in IBD.

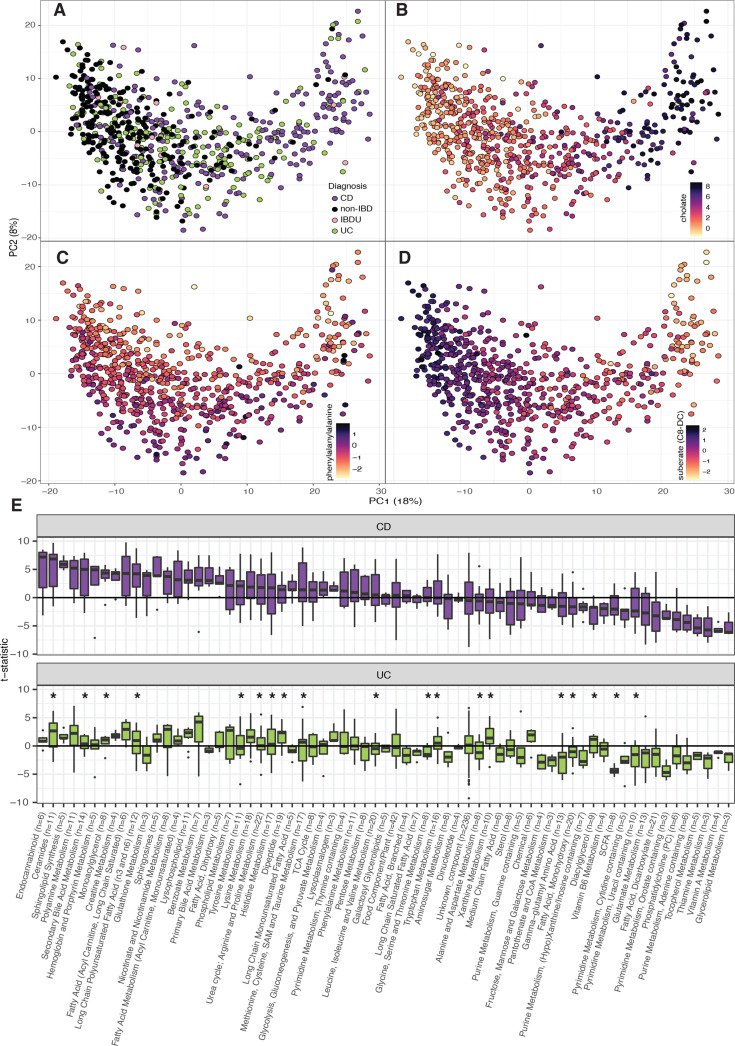
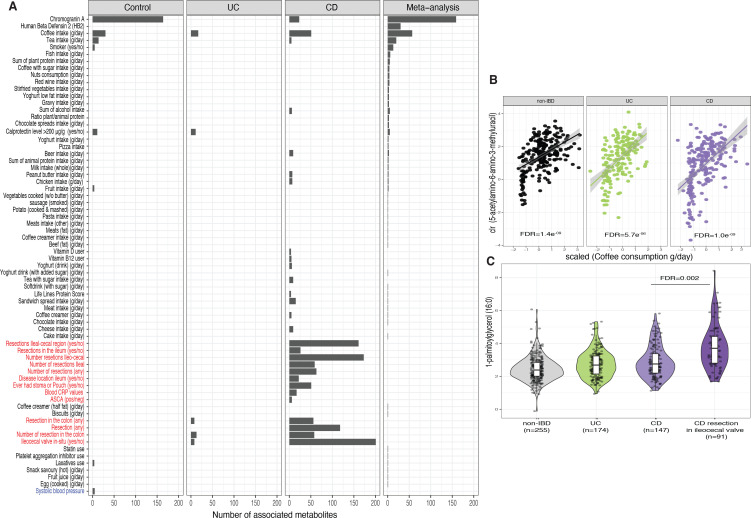
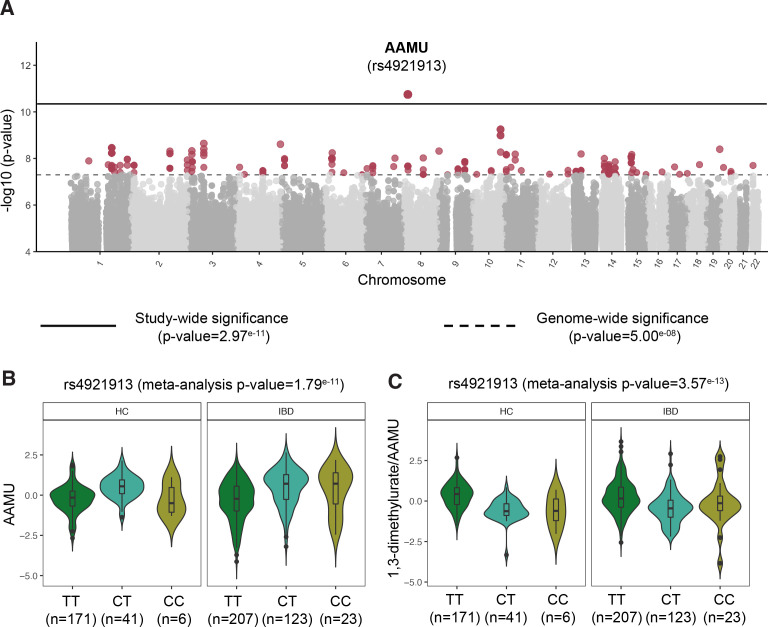
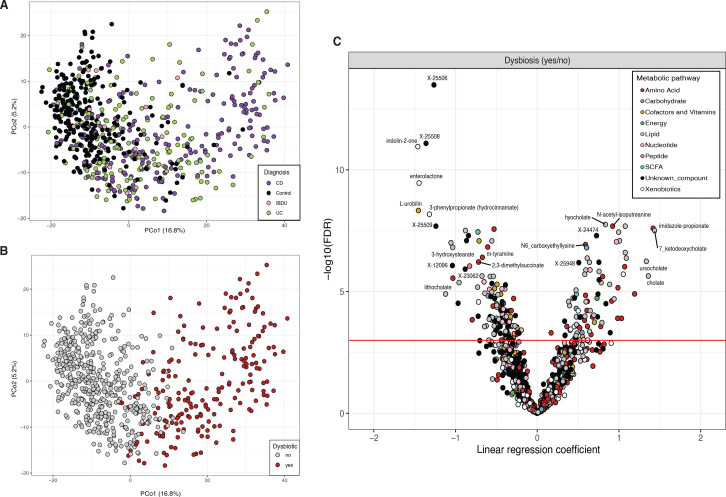
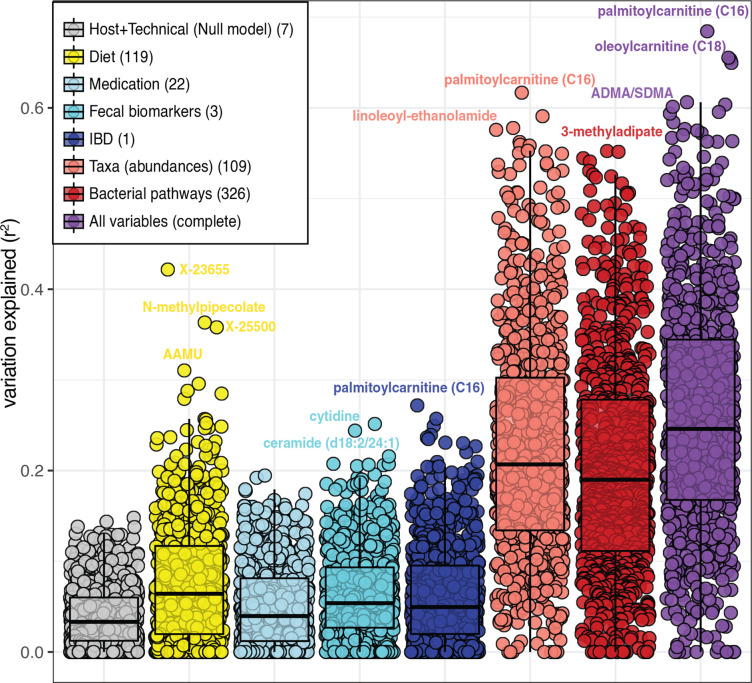
Design: We measured 1684 different faecal metabolites and 8 short-chain and branched-chain fatty acids in stool samples of 424 patients with IBD and 255 non-IBD controls. Regression analyses were used to compare concentrations of metabolites between cases and controls and determine the relationship between metabolites and each participant's lifestyle, clinical characteristics and gut microbiota composition. Moreover, genome-wide association analysis was conducted on faecal metabolite levels.

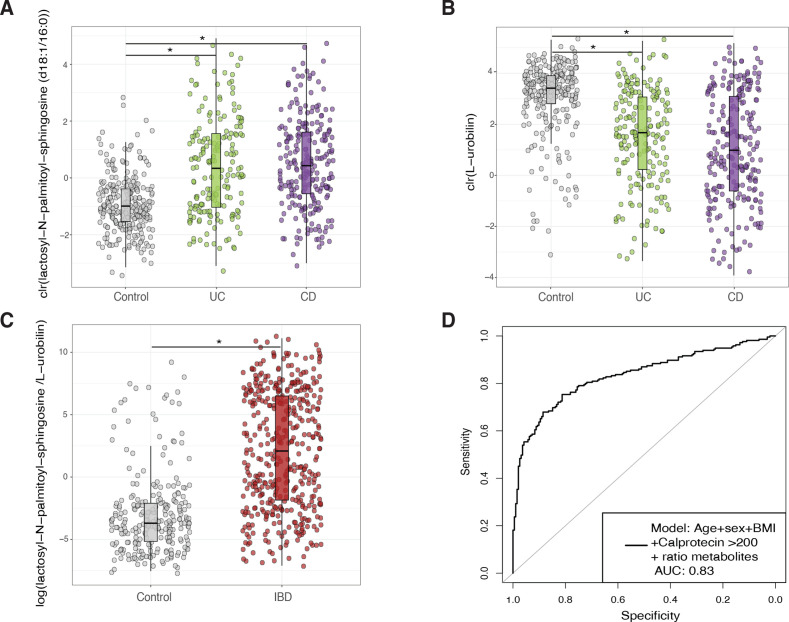
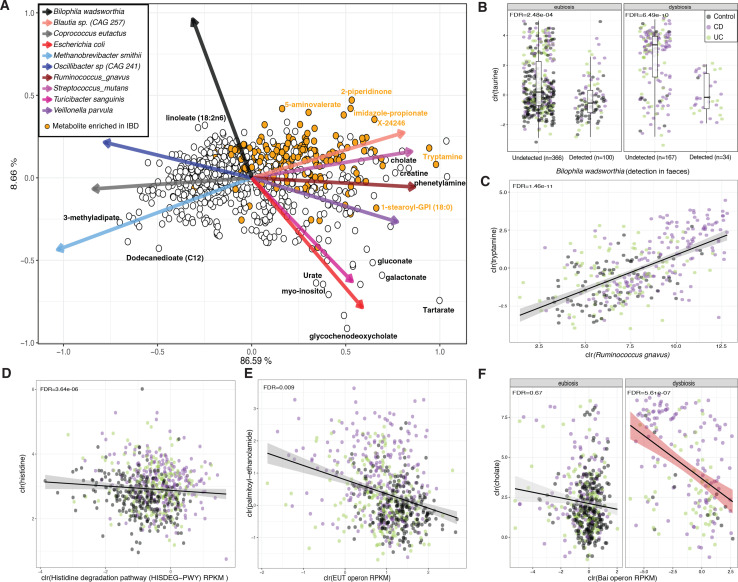
Results: We identified over 300 molecules that were differentially abundant in the faeces of patients with IBD. The ratio between a sphingolipid and L-urobilin could discriminate between IBD and non-IBD samples (AUC=0.85). We found changes in the bile acid pool in patients with dysbiotic microbial communities and a strong association between faecal metabolome and gut microbiota. For example, the abundance of Ruminococcus gnavus was positively associated with tryptamine levels. In addition, we found 158 associations between metabolites and dietary patterns, and polymorphisms near NAT2 strongly associated with coffee metabolism.

Conclusion: In this large-scale analysis, we identified alterations in the metabolome of patients with IBD that are independent of commonly overlooked confounders such as diet and surgical history. Considering the influence of the microbiome on faecal metabolites, our results pave the way for future interventions targeting intestinal inflammation.

Keywords: CROHN'S DISEASE; IBD; INTESTINAL MICROBIOLOGY; STOOL MARKERS.


Conflict of interest statement

Competing interests: This study was funded by Takeda Development Center Americas. RKW acted as a consultant for Takeda and received unrestricted research grants from Takeda and Johnson and Johnson pharmaceuticals and speaker fees from AbbVie, MSD, Olympus and AstraZeneca. GA-A, CG, JS, JP and AAG are or were employees of Takeda Pharmaceuticals at the time this study was conducted.No disclosures: All other authors have nothing to disclose.

Figures

Figure 1
Figure 1
Faecal metabolite alterations in patients with Crohn’s disease and ulcerative colitis. (A–D). Principal coordinate analyses depicting the clustering of 255 non-IBD (black), 238 CD (purple), 174 UC (green) and 12 IBDU (pink) samples according to their metabolomic composition. The first principal component is mainly driven by the levels of cholic acid and suberate (B, D) and the second component by the concentrations of phenylalanylalanine (panel C). Light–dark colour gradient represents low–high metabolite values. Metabolite concentrations are expressed as centred log-ratio (clr) of the AUC raw values. (E). Metabolite differences between cases and controls grouped into metabolomic pathways. For clarity, only categories with three or more metabolites are shown (number of metabolites per categories are indicated on the x-axis). The y-axis represents the t-statistic value from the linear regression model (see online supplemental methods). Asterisks indicate significant differences between CD and UC (FDR<0.05, online supplemental tables 7–9). AUC, area under the curve; CD, Crohn’s disease; FDR, false discovery rate; IBD, inflammatory bowel disease; IBDU, inflammatory bowel disease unclassified; UC, ulcerative colitis.
Figure 2
Figure 2
Biomarker discovery for the diagnosis of IBD. (A, B) Show the abundance of the metabolites with the highest potential to discriminate between samples from non-IBD (grey) and IBD (UC in green and CD in purple). (C). Boxplots depict the value of a potential biomarker for IBD. The y-axis is the log-transformed value of the ratio constructed from the levels of lactosyl-N-palmitoyl-sphingosine (d18:1/16:0) and L-urobilin. Boxplot in grey depicts values in non-IBD controls. Boxplot in red depicts values in patients with IBD. (D). Receiver operating characteristic curve (ROC curve) of the prediction model based on patient characteristics (age, sex and BMI), the levels of faecal calprotectin (expressed as a binary trait (yes/no) if levels of this marker were >200 µg/g of faeces) and the ratio between metabolites. The prediction value, expressed as the area under the curve (AUC), reached a value of 0.83 in the test dataset. Metabolite values are clr-transformed. Boxplot shows the median and interquartile range (25th and 75th). Whiskers show the 1.5*IQR range. Asterisks indicate significant differences between groups (FDR<0.05). BMI, body mass index; CD, Crohn’s disease; FDR, false discovery rate; UC, ulcerative colitis.
Figure 3
Figure 3
Potential determinants of faecal metabolite levels. (A) Bar plot showing the number of significant associations between phenotypes and metabolites in each of the cohorts and in the meta-analysis (online supplemental table 11). Only phenotypes with more than three associations are shown. Red labels indicate phenotypes exclusively available for cases and blue labels for controls. (B). Correlation plot showing the relation between AAMU (expressed as clr-transformed AUC values) and coffee consumption (x-axis) per cohort. Coffee consumption is represented as the estimated consumption per day (grams/day) adjusted by overall individual calorie intake (see online supplemental methods). (C). Boxplots showing the levels of 1-palmitoylglycerol (16:0). Boxplot shows the median and IQR (25th and 75th). Whiskers show the 1.5*IQR range. Data distribution is represented by background violin-plot. Lines in the correlation plot show linear regression and shadows indicate the 95% CI. AAMU, 5-acetylamino-6-amino-3-methyluracil; AUC, area under the curve.
Figure 4
Figure 4
Genome-wide association between genetic polymorphisms and faecal metabolites. (A) Manhattan plot shows the strong association between a single nucleotide polymorphism located near the NAT2 gene and AAMU, a metabolite derived from caffeine. Solid horizontal line signifies the significance threshold corrected by multiple hypothesis testing. Dashed line indicates the classic genome-wide significance threshold. Metabolites passing this threshold (in red) are considered suggestive associations (online supplemental table 15). (B) Boxplot depicting the levels of AAMU in non-IBD controls and IBD, stratified by SNP rs4921913 genotype. (C) Boxplot showing the relation between SNP rs4921913 and the ratio of 1,3-dimethylurate to AAMU. This association was previously described in the TwinsUK cohort. Metabolite values are presented as the residuals of the model regressing the covariates age, sex, BMI and technical confounders. Boxplot shows the median and IQR (25th and 75th). Whiskers show the 1.5*IQR range. Data distribution is represented by background violin-plot. AAMU, 5-acetylamino-6-amino-3-methyluracil; BMI, body mass index; IBD, inflammatory bowel disease.
Figure 5
Figure 5
Metabolic signature of patients with intestinal dysbiosis. (A) Principal coordinate analysis on microbiome composition per sample (dots). Colours indicate disease phenotypes: CD (purple), UC (green), IBD-undetermined (pink), non-IBD (black). (B) Red dots depict samples considered to be dysbiotic based on the median distance to non-IBD samples. (C) Volcano plot showing the p value (y-axis) and regression coefficients (x-axis, positive values indicate enrichment in dysbiosis) of the association analyses between dysbiotic and non-dysbiotic IBD samples (online supplemental table 5). Dot colour indicates pathway annotations provided by Metabolon (online supplemental table 2). CD, Crohn’s disease; IBD, inflammatory bowel disease; UC, ulcerative colitis.
Figure 6
Figure 6
Metabolite co-occurrence with faecal microbes. (A) Biplot representing conditional probabilities of co-occurrence between metabolites (dots) and microbes (arrows). Distances between dots and arrow tips represent the probability of co-occurrence of each metabolite and microbe (online supplemental table 21). Orange dots highlight metabolites enriched in samples from patients with IBD in the linear regression analysis (online supplemental table 7). Arrow direction indicates the probability of microbes co-occurring with the levels of metabolites To enhance interpretability, names of only a few metabolites are shown and only the top-10 species explaining the largest amount of variation are visualised. (B) Taurine levels stratified by the presence or absence of Bilophila wadsworthia in faecal metagenomes. (C) Correlation between levels of tryptamine and abundance of Ruminococcus gnavus. Only samples in which the bacterium had a non-zero relative abundance are shown (n=339). (D–F) The relation between histidine and MetaCyc Histidine degradation pathway (D), between oleoyl-ethanolamide and the eut operon (E) and between cholic acid and the bai operon (F) are shown as examples of the correlation between microbiota metabolic potential and metabolite levels. Metabolite, bacteria and pathway values are clr-transformed. Boxplot shows the median and IQR (25th and 75th). Whiskers show the 1.5*IQR range.Correlation plot lines show linear regression. Shadows indicate the 95% CI. IBD, inflammatory bowel disease.
Figure 7
Figure 7
Metabolite prediction. Microbial abundances (light red) and bacterial pathways (dark red) show the largest potential to predict the levels of metabolites. Boxplots show the ability to predict metabolites levels of eight different models using seven types of data. Dots represent metabolites, and values in the y-axis represent the percentage of variation explained from cross-validated penalised regression methods using different sets of predictors (see online supplemental methods). The number of features in each model are indicated in parentheses in the legend (online supplemental table 20).

Comment in

References

    1. Kaplan GG, Ng SC. Understanding and preventing the global increase of inflammatory bowel disease. Gastroenterology 2017;152:313–21. 10.1053/j.gastro.2016.10.020 - DOI - PubMed
    1. Kostic AD, Xavier RJ, Gevers D. The microbiome in inflammatory bowel disease: current status and the future ahead. Gastroenterology 2014;146:1489–99. 10.1053/j.gastro.2014.02.009 - DOI - PMC - PubMed
    1. Lloyd-Price J, Arze C, Ananthakrishnan AN, et al. Multi-omics of the gut microbial ecosystem in inflammatory bowel diseases. Nature 2019;569:655–62. 10.1038/s41586-019-1237-9 - DOI - PMC - PubMed
    1. Lavelle A, Sokol H. Gut microbiota-derived metabolites as key actors in inflammatory bowel disease. Nat Rev Gastroenterol Hepatol 2020;17:223–37. 10.1038/s41575-019-0258-z - DOI - PubMed
    1. Franzosa EA, Sirota-Madi A, Avila-Pacheco J, et al. Author correction: gut microbiome structure and metabolic activity in inflammatory bowel disease. Nat Microbiol 2019;4:898. 10.1038/s41564-019-0442-5 - DOI - PubMed

Publication types

Substances