. 2023 Mar 23;14(1):1602.
doi: 10.1038/s41467-023-37021-x.

Mena regulates nesprin-2 to control actin-nuclear lamina associations, trans-nuclear membrane signalling and gene expression

Affiliations

Mena regulates nesprin-2 to control actin-nuclear lamina associations, trans-nuclear membrane signalling and gene expression

Frederic Li Mow Chee et al. Nat Commun. .

Abstract

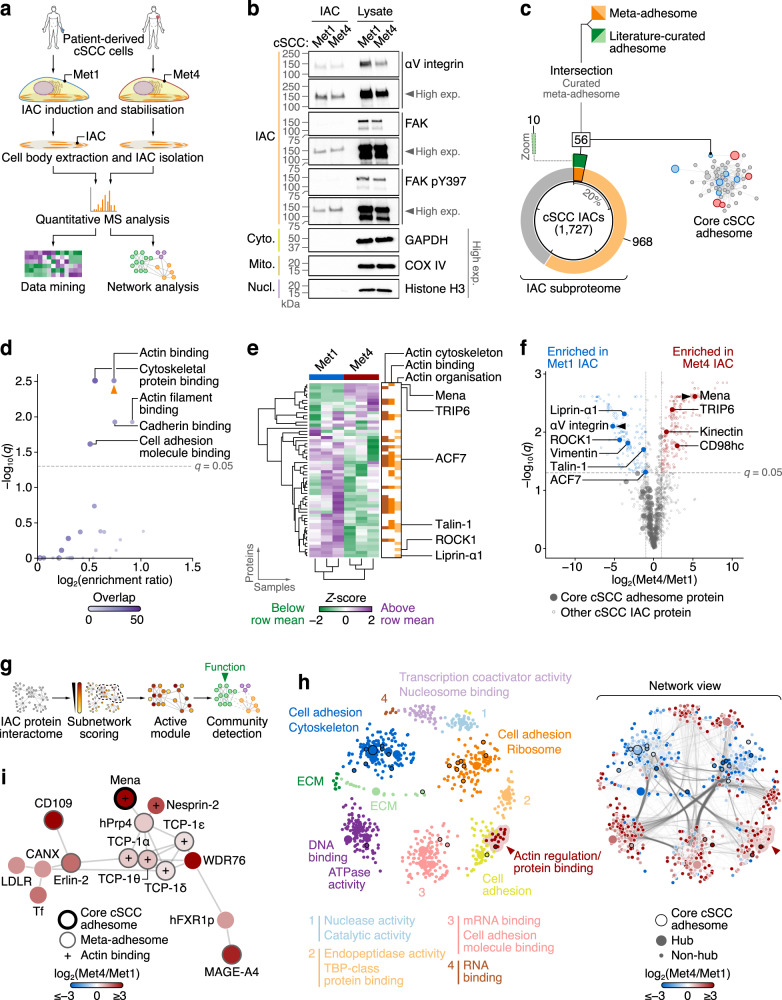
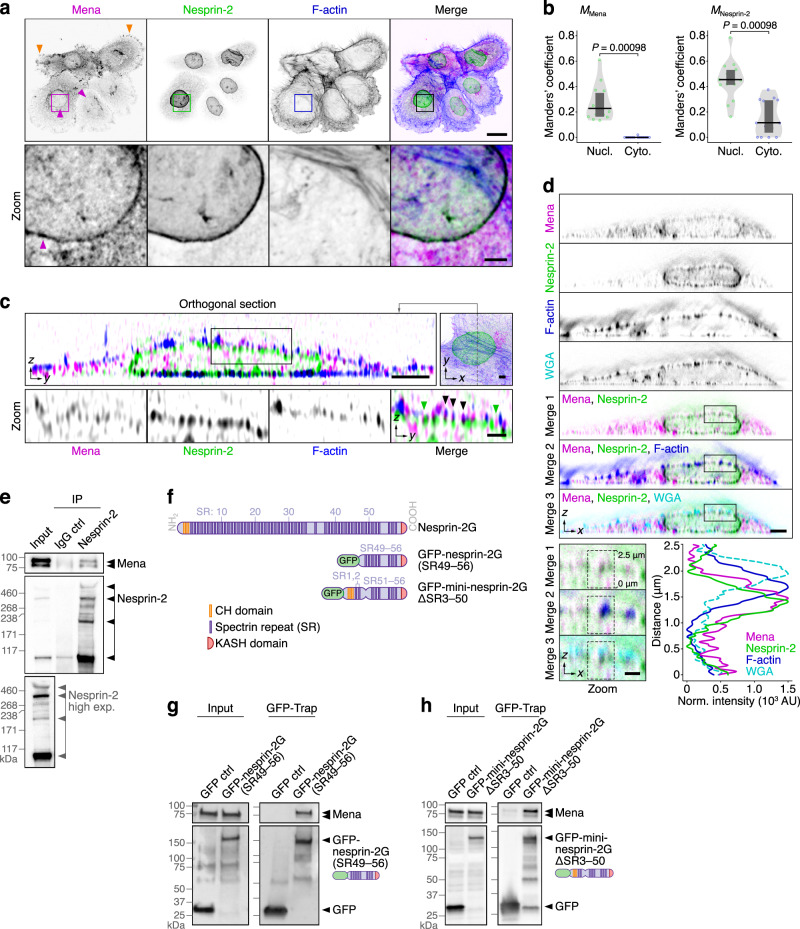
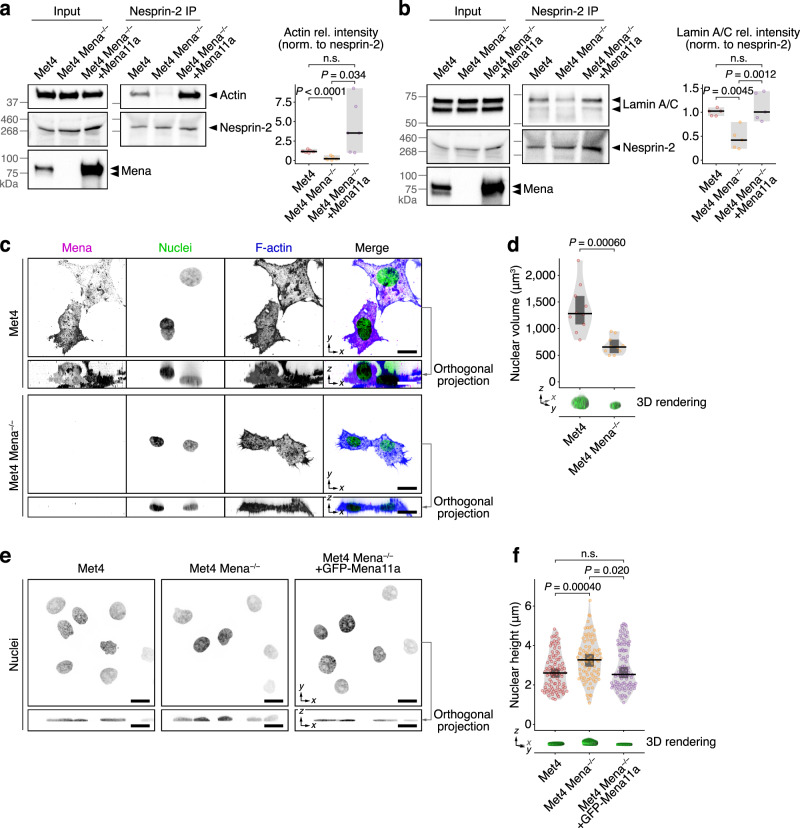
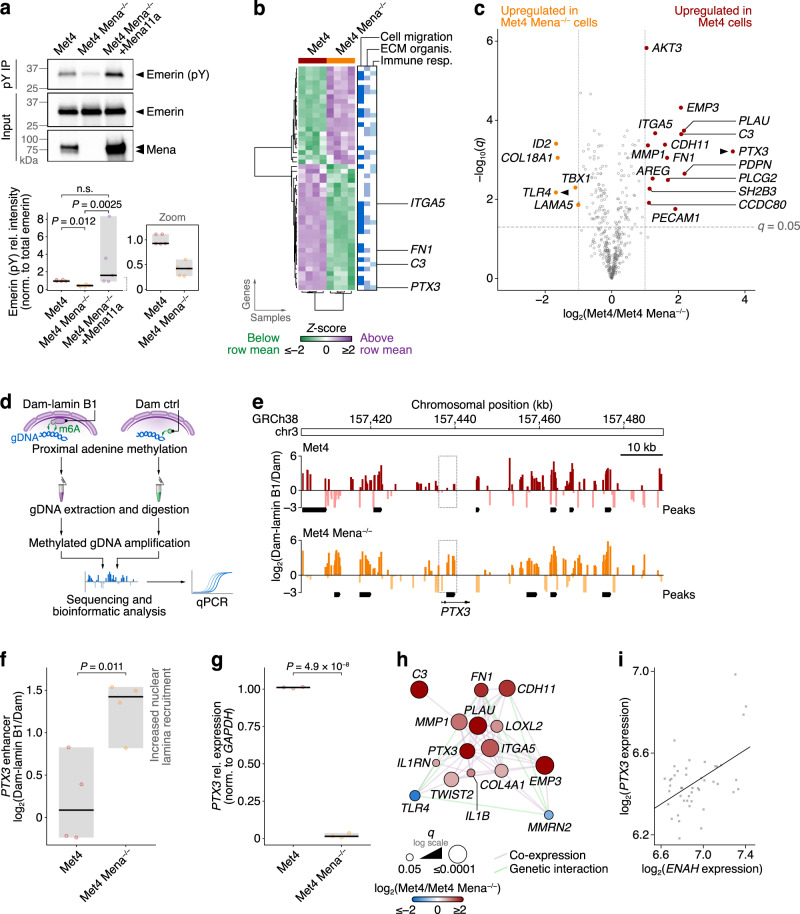
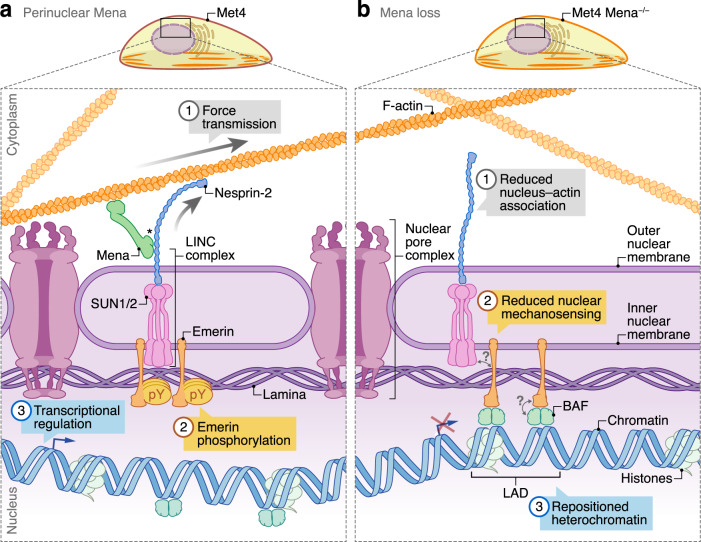
Interactions between cells and the extracellular matrix, mediated by integrin adhesion complexes, play key roles in fundamental cellular processes, including the sensing and transduction of mechanical cues. Here, we investigate systems-level changes in the integrin adhesome in patient-derived cutaneous squamous cell carcinoma cells and identify the actin regulatory protein Mena as a key node in the adhesion complex network. Mena is connected within a subnetwork of actin-binding proteins to the LINC complex component nesprin-2, with which it interacts and co-localises at the nuclear envelope. Moreover, Mena potentiates the interactions of nesprin-2 with the actin cytoskeleton and the nuclear lamina. CRISPR-mediated Mena depletion causes altered nuclear morphology, reduces tyrosine phosphorylation of the nuclear membrane protein emerin and downregulates expression of the immunomodulatory gene PTX3 via the recruitment of its enhancer to the nuclear periphery. We uncover an unexpected role for Mena at the nuclear membrane, where it controls nuclear architecture, chromatin repositioning and gene expression. Our findings identify an adhesion protein that regulates gene transcription via direct signalling across the nuclear envelope.


Conflict of interest statement

The authors declare no competing interests.

Figures

Fig. 1
Fig. 1. Characterisation of a patient-derived cSCC adhesome.
a Workflow for isolation and proteomic analysis of IACs. b Enrichment of focal adhesion proteins in cSCC IACs compared to cytoplasmic (cyto.), mitochondrial (mito.) and nuclear (nucl.) non-adhesion proteins as determined by western blotting. Images are representative of three independent experiments. Exp., exposure. c Proportion of the 1727 IAC proteins identified by proteomics annotated in the meta-adhesome (orange segments) or the literature-curated adhesome (green segments). IAC proteins in both the meta-adhesome and the literature-curated adhesome (intersection set; 56 proteins; dark segments) represent a core cSCC adhesome (see Supplementary Fig. 1c for corresponding network). Inset segment (dotted box) shows zoom of literature-curated adhesome-only segment for clarity. d Gene Ontology over-representation analysis of molecular functions in the core cSCC adhesome. Orange arrowhead, representative functional category determined using affinity propagation. e Hierarchical cluster analysis of the core cSCC adhesome. Proteins associated with actin components (actin cytoskeleton), functions (actin binding) or processes (actin organisation) are indicated (orange bars). Actin-associated proteins significantly differentially abundant between Met1 and Met4 IACs are labelled (q < 0.05, two-sided t-test with Benjamini–Hochberg correction; n = 3 independent biological replicates). f Volcano plot of cSCC IAC proteins. Core adhesome proteins significantly differentially abundant between Met1 and Met4 IACs and enriched by at least two-fold are labelled; the most enriched in Met1 and Met4 IACs, respectively, are indicated with black arrowheads. g Workflow for graph-based analysis of the cSCC IAC subproteome. h Maximal-scoring active module of the cSCC IAC protein interactome. The network was partitioned using the Louvain modularity maximisation method. Proteins (nodes) are coloured according to assigned cluster (left panel). Network view (right panel) shows corresponding protein interactions (edge densities) in the partitioned network; nodes are coloured according to protein enrichment in Met1 or Met4 IACs. Black node borders indicate core adhesome proteins. The actin regulation cluster detailed in (i) is indicated with a red arrowhead. i Subnetwork analysis of the actin regulation cluster identified by active module partitioning in (h). Artwork in (a) was adapted from Byron, A., Griffith, B.G.C., Herrero, A. et al. Characterisation of a nucleo-adhesome. Nat Commun 13, 3053 (2022). 10.1038/s41467-022-30556-5.
Fig. 2
Fig. 2. Mena co-localises with nesprin-2 at the nuclear membrane and forms a biochemical complex.
a Confocal imaging of Met4 cSCC cells. Orange arrowheads indicate Mena staining at focal adhesions; magenta arrowheads indicate Mena localisation at the nuclear membrane. Images are representative of three independent experiments. Scale bar, 20 µm; zoom (inset) scale bar, 3 µm. b Subcellular co-occurrence analysis of Mena and nesprin-2 signals determined from confocal images. MMena, co-occurrence fraction of Mena with nesprin-2 at the nuclear membrane (nucl.) or cytoplasm (cyto.). MNesprin-2, co-occurrence fraction of nesprin-2 with Mena at the nuclear membrane or cytoplasm. Black bar, median; dark grey box, 95% confidence interval; light grey silhouette, probability density. Statistical analysis, two-sided Wilcoxon signed rank test (n = 14 images from n = 3 independent experiments). c SIM imaging of Met4 cells. Position of orthogonal section (yz) shown in top-right image (xy; grey dashed line). Green arrowheads indicate co-localisation of Mena and nesprin-2 at the nuclear membrane; black arrowheads indicate co-localisation of Mena, nesprin-2 and F-actin at the nuclear membrane. Images are representative of three independent experiments. Scale bar, 3 µm; zoom (inset) scale bar, 1 µm. d STED imaging of Met4 cells. Signals in a region beneath the apical plasma membrane (dashed black boxes; bottom-left panels) were quantified (bottom-right panel). Images are representative of two independent experiments. Scale bar, 3 µm; zoom (inset) scale bar, 1 µm. WGA, wheat germ agglutinin. For (a), (c) and (d), F-actin was detected using phalloidin. Inverted lookup tables were applied. e Immunoprecipitation (IP) analysis of nesprin-2 protein complexes in Met4 cells. Anti-Mena- and anti-nesprin-2-reactive species detected by western blotting are indicated with arrowheads. High exposure of nesprin-2 blot of Met4 lysate (input) is also shown. Western blots are representative of three independent experiments. f Representation of nesprin-2 domains and the nesprin-2 constructs used for pulldown experiments. Constructs are based on the nesprin-2 giant isoform (nesprin-2G). g, h Pulldown analyses of protein complexes associated with exogenous GFP-tagged nesprin-2G(SR49–56) (g) and mini-nesprin-2GΔSR3–50 (h) in Met4 cells. Western blots are representative of three independent experiments. Ctrl control.
Fig. 3
Fig. 3. Mena is required for nesprin-2 links to actin and lamin A/C and regulates nuclear morphology.
a, b IP analyses of nesprin-2 protein complexes in Met4 cells, Mena-depleted Met4 cells (Met4 Mena−/−) and Met4 Mena−/− cells with Mena11a re-expressed (Met4 Mena−/− +Mena11a). Actin (a) and lamin A/C (b) were detected by western blotting; respective densitometric intensities were normalised (norm.) to nesprin-2 and expressed relative (rel.) to Met4 cells (right panels). Black bar, median; light grey box, range. Statistical analysis, Welch’s one-way ANOVA with two-stage Benjamini–Krieger–Yekutieli correction (n = 6 independent experiments) for (a), one-way ANOVA with Tukey’s correction (n = 5 independent experiments) for (b). c Spinning-disk confocal imaging of Met4 cells and Met4 Mena−/− cells in 3D collagen matrix. Orthogonal projections (xz) were extracted from 3D brightest-point projections. Nuclei were detected using DAPI; F-actin was detected using phalloidin. Inverted lookup tables were applied. Images are representative of two independent experiments. Scale bar, 20 μm. d Quantification of nuclear volume of cells in 3D matrix (see c). 3D volume renderings of exemplar nuclei detected using DAPI are displayed. Black bar, median; dark grey box, 95% confidence interval; light grey silhouette, probability density. Statistical analysis, two-sided Welch’s t-test (n = 10 cells from n = 2 independent experiments). e Spinning-disk confocal imaging of Met4 cells, Met4 Mena−/− cells and Met4 Mena−/− +GFP-Mena11a cells on 2D fibronectin matrix. Orthogonal projections were extracted from 3D brightest-point projections. Nuclei were detected using DAPI. Inverted lookup tables were applied. Images are representative of four independent experiments. Scale bar, 20 μm. f Quantification of nuclear height of cells on 2D matrix (see e). 3D volume renderings of exemplar nuclei detected using DAPI are displayed. Black bar, median; dark grey box, 95% confidence interval; light grey silhouette, probability density. Statistical analysis, Kruskal–Wallis test with Dunn’s correction (n = 92, 87 and 94 cells for Met4, Met4 Mena−/− and Met4 Mena−/− +GFP-Mena11a cells, respectively, from n = 4 independent experiments). n.s. not significant.
Fig. 4
Fig. 4. Mena loss suppresses emerin phosphorylation and regulates PTX3 expression.
a Emerin tyrosine phosphorylation in Met4, Met4 Mena−/− and Met4 Mena−/− +Mena11a cells detected by phosphotyrosine (pY) IP and western blotting for emerin. Normalised densitometric intensities were expressed relative to Met4 cells (bottom panel). Black bar, median; light grey box, range. Inset (bottom-right panel) shows zoom of Met4 and Met4 Mena−/− cell quantification for clarity. Statistical analysis, Kruskal–Wallis test with two-stage Benjamini–Krieger–Yekutieli correction (n = 5 independent experiments). b Hierarchical cluster analysis of cancer progression genes significantly differentially regulated between Met4 and Met4 Mena−/− cells (q < 0.05, two-sided t-test with Benjamini–Hochberg correction; n = 4 independent biological replicates). Genes associated with cell migration, ECM organisation or the immune response are indicated (blue bars). c Volcano plot of cancer progression genes. Genes significantly differentially regulated between Met4 and Met4 Mena−/− cells by at least two-fold are labelled. Black arrowheads, the most differentially regulated gene in Met4 and Met4 Mena−/− cells, respectively. d Workflow for quantification of recruitment of specific regions of chromatin to the nuclear lamina by DamID. Green arrows, adenine methylation (m6A) in GATC motifs proximal to Dam. e Lamin B1 DamID sequencing (DamID-seq) tracks generated from Met4 and Met4 Mena−/− cells. The highest-scoring putative enhancer region associated with PTX3 (GeneHancer identifier GH03J157436) is indicated with a dotted box. Black bars, DamID-seq peaks (FDR < 5%; n = 2 independent experiments). Scale bar, 10 kb. f Nuclear lamina association of PTX3 quantified by lamin B1 DamID-qPCR. Black bar, median; light grey box, range. Statistical analysis, two-sided Student’s t-test (n = 4 independent experiments). g Quantification of PTX3 expression by RT-qPCR. GAPDH-normalised gene expression was expressed relative to Met4 cells. Black bar, median; light grey box, range. Statistical analysis, two-sided Student’s t-test (n = 3 independent experiments). h Subnetwork analysis of PTX3-associated genes from the gene expression analysis in (c). i Correlation of ENAH and PTX3 expression in patient-derived cSCC cell lines (GEO series accession identifier GSE98767). Pearson correlation coefficient = 0.487; two-sided P = 6.87 × 10−4 (n = 45 samples from n = 3 independent replicates). Artwork in (d) was adapted from Byron, A., Bernhardt, S., Ouine, B. et al. Integrative analysis of multi-platform reverse-phase protein array data for the pharmacodynamic assessment of response to targeted therapies. Scientific Reports 10, 21985 (2020). 10.1038/s41598-020-77335-0.
Fig. 5
Fig. 5. Model of the proposed role for Mena at the nuclear membrane.
a Mena interacts with nesprin-2 at the outer nuclear membrane via the C-terminal SRs of nesprin-2. This potentiates the interactions of nesprin-2 with F-actin and lamin A/C, permitting force transmission from the actin cytoskeleton to the nuclear lamina (1). Actomyosin-based force maintains emerin tyrosine phosphorylation. Emerin tyrosine phosphorylation has been reported to prevent its LAP2–emerin–MAN1 (LEM) domain from binding to the DNA-binding protein barrier-to-autointegration factor (BAF), limiting chromatin repositioning to the nuclear lamina (2). This proposed mechanism allows genomic loci to favour chromatin decondensation and expression of specific genes, including, in metastatic Met4 cSCC cells, those involved in cancer progression, such as genes associated with cell adhesion and migration (e.g. ITGA5, PLAU), ECM organisation (e.g. FN1, MMP1) and the immune response (e.g. PTX3, C3) (3). b Mena loss reduces the connectivity between F-actin and nesprin-2 (1), diminishing force transduction to the nuclear envelope via nesprin-2. Mena loss thus results in a reduction of emerin tyrosine phosphorylation (2), which has been reported to promote BAF binding to the emerin LEM domain, and enhances recruitment of heterochromatic lamina-associated domains (LADs) to the nuclear periphery (3). Chromatin repositioning is associated with transcriptional silencing of genes with regulatory elements in specific LADs (3), such as the immunomodulatory gene PTX3 in cSCC cells. *, the nesprin-2-interacting region of Mena has not been determined. The hetero-oligomeric SUN–nesprin assembly is simplified for visualisation purposes. Question marks indicate unresolved potential mechanistic associations. Artwork was adapted from Byron, A., Griffith, B.G.C., Herrero, A. et al. Characterisation of a nucleo-adhesome. Nat Commun 13, 3053 (2022). 10.1038/s41467-022-30556-5.

References

    1. Byron A, Morgan MR, Humphries MJ. Adhesion signalling complexes. Curr. Biol. 2010;20:R1063–R1067. doi: 10.1016/j.cub.2010.10.059. - DOI - PMC - PubMed
    1. Green HJ, Brown NH. Integrin intracellular machinery in action. Exp. Cell Res. 2019;378:226–231. doi: 10.1016/j.yexcr.2019.03.011. - DOI - PubMed
    1. Geiger B, Yamada KM. Molecular architecture and function of matrix adhesions. Cold Spring Harb. Perspect. Biol. 2011;3:a005033. doi: 10.1101/cshperspect.a005033. - DOI - PMC - PubMed
    1. Humphries JD, Chastney MR, Askari JA, Humphries MJ. Signal transduction via integrin adhesion complexes. Curr. Opin. Cell Biol. 2019;56:14–21. doi: 10.1016/j.ceb.2018.08.004. - DOI - PubMed
    1. Kechagia JZ, Ivaska J, Roca-Cusachs P. Integrins as biomechanical sensors of the microenvironment. Nat. Rev. Mol. Cell Biol. 2019;20:457–473. doi: 10.1038/s41580-019-0134-2. - DOI - PubMed

Publication types