. 2023 Mar 23;14(1):1611.
doi: 10.1038/s41467-023-36855-9.

Antigen discrimination by T cells relies on size-constrained microvillar contact

Affiliations

Antigen discrimination by T cells relies on size-constrained microvillar contact

Edward Jenkins et al. Nat Commun. .

Abstract

T cells use finger-like protrusions called 'microvilli' to interrogate their targets, but why they do so is unknown. To form contacts, T cells must overcome the highly charged, barrier-like layer of large molecules forming a target cell's glycocalyx. Here, T cells are observed to use microvilli to breach a model glycocalyx barrier, forming numerous small (<0.5 μm diameter) contacts each of which is stabilized by the small adhesive protein CD2 expressed by the T cell, and excludes large proteins including CD45, allowing sensitive, antigen dependent TCR signaling. In the absence of the glycocalyx or when microvillar contact-size is increased by enhancing CD2 expression, strong signaling occurs that is no longer antigen dependent. Our observations suggest that, modulated by the opposing effects of the target cell glycocalyx and small adhesive proteins, the use of microvilli equips T cells with the ability to effect discriminatory receptor signaling.


Conflict of interest statement

The authors declare no competing interests.

Figures
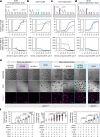
Fig. 1
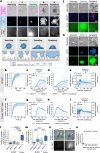
Fig. 1. SLB2s balance antigen sensitivity and specificity.
ad Calcium response curves for J8-GECI cells on the indicated SLBs presenting pMHCnull ± pMHC9V. A cartoon indicating the SLB compositions is shown (top panel), along with the fraction of cells exhibiting a Ca2+ signal (middle panel) and the time taken for 50% of the cells to signal (bottom panel). Each datapoint corresponds to a separate SLB. Data were fitted with a four-point dose-response curve, constrained to a minimum using responses to pMHCnull. a “First generation” SLB (‘SLB1’; black); n = 44 SLBs with ≥116 cells analyzed per SLB. b SLB1 + CD58 (cyan); n = 28 SLBs with ≥127 cells analyzed per SLB. c SLB1 + glycocalyx (magenta); n = 23 SLBs with ≥140 cells analyzed per SLB. d “Second generation” SLB (‘SLB2’; blue); n = 42 SLBs with ≥109 cells analyzed per SLB. e, f Spreading, synapse formation, and calcium release for J8-GECI cells interacting with non-adhesive (ΔICAM-1ΔCD58) to highly adhesive (ΔCD43ΔCD45) SLBs. All the SLBs presented pMHCnull, except for the right-most SLB2, which presented pMHCnull plus pMHC9V at ~100 molecules/μm2. J8-GECI cells were tracked for calcium signals for 10 min and immediately imaged afterward to allow IRM-based contact area measurement and synapse formation frequency. e Images of cells spreading (dark areas in IRM image) and forming synapses. Colored boxes denote the same SLB composition shown in (ad). Images are representative of J8-GECI cells on n = 4 independent SLBs for each SLB composition. f Left plot: fraction of cells that exhibit a calcium signal. Shown is the mean (±S.D.) of n = 4 independent SLBs with ≥158 cells analyzed per SLB. ΔCD43ΔCD45, ΔCD58, and SLB2s presenting pMHCnull correspond to the zero density values in (b), (c), and (d), respectively. f Middle plot (log scale): quantification of cell spreading; n = 115 (ΔICAM-1ΔCD58), 133 (ΔCD58), 174 (ΔICAM-1), 154 (SLB2 pMHC9V−), 132 (ΔCD43), 108 (ΔCD45), 118 (ΔCD43ΔCD45), and 122 SLB2 (SLB2 pMHC9V+) cells pooled from four independent SLBs for each SLB composition. The red line indicates median. f Right plot: quantification of synapse formation. Shown is the mean (±S.D.) fraction of cells forming synapses from n = 4 independent SLBs with ≥17 cells analyzed per SLB. In f, means were compared to an SLB2 presenting pMHCnull via one-way ANOVA with Tukey correction. Comparison between the ΔCD43ΔCD45 SLB and SLB2 (with pMHC9V) was also included. Only statistics for comparisons of interest are shown. Source data are provided in the Source data file.
Fig. 2
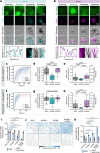
Fig. 2. Microvilli allow T cells to overcome a glycocalyx barrier.
a Cartoon depiction of experiments testing whether dynamic actin remodeling of microvilli is needed to establish close-contacts in the presence of a glycocalyx barrier. Jasplakinolide (Jasplak) enhances the nucleation and stabilization of actin filaments, resulting in ‘paralysis’ of the actin cytoskeleton and microvillar activity. Latrunculin B (Lat B) and cytochalasin D (Cyto D) prevent the formation of actin filaments by sequestering actin monomers and by blocking their recruitment to pre-existing filaments, respectively, resulting in filament breakdown and subsequent loss of membrane topography. Cells in the cartoon are shown interacting with an SLB2. b Confocal fluorescence images of fixed J8-GECI cells imaged at the midplane after treatment with DMSO or an actin-modifying drug. A digitally-magnified region (white box) is shown below. Images are representative of J8-GECI cells for n = 3 independent experiments. c Examples of contact formation in the presence of DMSO or the actin-modifying drugs, for J8-GECI cells interacting with an SLB2 presenting pMHCnull plus pMHC9V-lo, i.e., ~1 pMHC9V molecule/μm2. Close contacts are indicated by black holes in the SLB2 glycocalyx fluorescence (with point of initiation indicated by white arrows). See Supplementary Movie 3. Images are representative of drug-treated J8-GECI cells for n = 4 independent experiments. d Fraction of cells that formed detectable close contacts. Data are from the same experiment as in (c). Shown is the mean (±S.D.) of n = 4 independent SLBs with 13–113 cells imaged per SLB. e Time taken for cells to form a close contact versus first appearance of membrane fluorescence. Data are from the same experiment as in (c). Data were pooled from four independent SLBs with n = 93 (DMSO), 88 (Cyto D), 18 (Jasplak), and 64 (Lat B) total contact-forming cells analyzed. The red line indicates the median. In d and e, means were tested using one-way ANOVA with Dunnett correction using DMSO as the control group. f Fraction of DMSO- or actin-modifying drug-treated J8-GECI cells that exhibit calcium release on an SLB2 or SLB2Δglycocalyx (i.e., SLB1 + CD58) presenting pMHCnull plus pMHC9V-lo. Shown is the mean (±S.D.) of n = 4 independent SLBs with 138-785 cells analyzed per SLB. Two-way ANOVA with Šidák correction was used to compare means between glycocalyx-positive and -negative SLBs for each treatment. Source data are provided in the Source data file.
Fig. 3
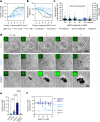
Fig. 3. The four stages of close-contact formation.
a Key stages of close-contact formation. Images show a J8-GECI cell interacting with an SLB2 presenting pMHCnull plus pMHC9V-hi (i.e., ~100 molecules of pMHC9V/μm2). The different stages were identified by simultaneously imaging close contacts (black holes in the SLB glycocalyx fluorescence), cell footprint (cell membrane area), and triggering state (calcium signal) of a cell. A cartoon of each stage is indicated below. See main text for stage descriptions. be Image-based analysis of J8-GECI cells on an SLB2 presenting pMHCnull ± pMHC9V-lo or pMHC9V-hi. The baseline response is given by non-signaling cells on pMHCnull. See Supplementary Movies 1, 4, and 5. b Cumulative distribution of the searching to scanning stage transition for J8-GECI cells on SLB2s. The analysis uses both signaling and non-signaling cells; n = 26 (pMHC9V-hi), 26 (pMHC9V-lo), and 34 (pMHCnull) cells. Plotted is the cumulative distribution function of the Kaplan–Meier estimator with the exponential Greenwood confidence interval. A pairwise log-rank test indicated that there were no significant differences. c Cell footprint versus time, plotted relative to the first appearance of a close contact (timepoint 0 s). Plotted is the mean (±S.D.); n = 18 (pMHC9V-hi, 5 SLBs), 17 (pMHC9V-lo, 5 SLBs), and 11 (pMHCnull, 6 SLBs) signaling cells, and 23 (pMHCnull, 6 SLBs) non-signaling cells. d Number of close contacts versus time. Plotted is the mean (±S.D.). The analysis uses the same cells as in (c). e Area and diameter of individual close contacts within the first 10 s after their formation. Plotted is the mean (±S.D.). The analysis uses the same cells as in (c). fi Same analysis as in (be) for primary CD8+ T cells. UCHT-1 Fab-HaloTag was used as an agonist. See Supplementary Movies 6 and 7. f Cumulative distribution of the searching to scanning stage transition for primary cells on SLB2s. The analysis uses data for both signaling and non-signaling cells [n = 19 (UCHT-1 Fab-HaloTag) and 28 (pMHCnull) cells]. g Cell footprint versus time, plotted relative to the first appearance of a close contact (timepoint 0 s). Plotted is the mean (±S.D.); n = 8 signaling cells (UCHT-1 Fab-HaloTag, 3 SLBs) and 14 non-signaling cells (pMHCnull, 6 SLBs). h Number of close contacts versus time. Plotted is the mean (±S.D.). The analysis uses the same cells as in (g). i Area and diameter of individual close contacts within the first 10 s after their formation. Plotted is the mean (±S.D.). The analysis uses the same cells as in (g). j, k J8-GECI cells interacting with SLB2s presenting pMHCnull plus pMHC9V-hi. j Detection of pMHC from a single close contact at calcium release. See Supplementary Movie 8. Images are representative of J8-GECI cells for n = 3 independent SLBs. k Accumulation of ZAP70 at close contacts prior to calcium release. See Supplementary Movie 9. Images are representative of J8-GECI cells for n = 3 independent SLBs. l Total area of close contacts versus total cell membrane area at calcium release. ‘UCHT-1’ refers to UCHT-1 Fab-HaloTag. m Number of close contacts at calcium release. In l, m, boxplots indicate the quartiles with a line at the median. Whiskers extend to points that lie within 1.5 IQRs of the lower and upper quartile. Conditions were compared using the Kruskal–Wallis H test, and, if p < 0.05, further compared using the pairwise Mann–Whitney U test. The p values are shown. The analysis uses the same cells as in (c) for J8-GECI cells and (g) for primary cells. n Detection of single bound pMHC9V at close contacts prior to (t = −4 s) and at calcium release (t = 0 s). Images show a J8-GECI cell interacting with an SLB2 presenting pMHCnull plus pMHC9V-lo. The arrow indicates a single pMHC9V molecule at a close contact. o Maximum number of pMHC9V bound per close contact per cell for signaling and non-signaling cells; n = 13 FOVs, with 8 calcium signaling cells. Source data are provided in the Source data file.
Fig. 4
Fig. 4. CD2 stabilizes close contacts, enhancing antigen detection.
a, b Image-based analysis of J8-GECI cells on an SLB2 presenting pMHCnull ± pMHC9V-lo. a CD58 accumulation occurs at close contacts formed by J8-GECI cells. The min/max normalized intensity line profile was taken along the direction of the white arrow and indicates CD58 accumulation at close contacts. The kymograph indicates persistence of CD58 accumulation spots/close contacts. See Supplementary Movie 12. Images are representative of J8-GECI cells on n = 3 independent SLBs. b Engaged ICAM-1 is excluded from close contacts formed by J8-GECI cells. The min/max normalized intensity line profile was taken along the direction of the white arrow and indicates ICAM-1 exclusion from close contacts. The kymograph indicates persistent exclusion of ICAM-1 from close contacts. See Supplementary Movie 14. Images are representative of J8-GECI cells on n = 3 independent SLBs. ce Close-contact analysis for J8-GECI cells interacting with an SLB2, SLB2ΔCD58, or SLB2ΔICAM-1 presenting pMHCnull; n = 34 (SLB2, the same SLBs as in Fig. 3b–e), 14 (ΔCD58, from 4 SLBs), and 8 (ΔICAM-1, from 4 SLBs) cells. See Supplementary Movies 5, 17, and 19. c Cumulative distribution of the searching to scanning stage transition for cells on the indicated SLBs. The analysis uses data for both signaling and non-signaling cells. Plotted is the cumulative distribution function of the Kaplan–Meier estimator with the exponential Greenwood confidence interval. Data were examined using a pairwise log-rank test, which indicated that there were no significant differences. d Mean glycocalyx exclusion (i.e. contact tightness) at close contacts during the scanning stage for each cell. e Mean close-contact area during the scanning stage for each cell. The analysis uses the same cells as in (d). In d and e, conditions were compared using the pairwise Mann–Whitney U test. The p values are shown. The boxplots indicate the quartiles with a line at the median. Whiskers extend to points that lie within 1.5 IQRs of the lower and upper quartile. fh Same analysis as in (ce) using human primary CD8+ T cells; n = 28 (SLB2, the same SLBs as in Fig. 3f–i), 8 (ΔCD58, from 3 SLBs), and 18 (ΔICAM-1, from 3 SLBs) cells. See Supplementary Movies 7, 18, and 20. In f, a pairwise log-rank test indicated that there were no significant differences. i Fraction of J8-GECI cells that signal. Shown is the mean ± S.D. of n = 4 SLBs per condition with ≥257 cells analyzed per SLB. SLB2 data (blue bars) and SLB2Δglycocalyx (gray bars) were compared with a one-way ANOVA with Dunnett correction using data for the 'intact' SLBs, i.e., SLB2s with and without glycocalyces, as the control groups. j Displacement tracks. Each dot/line represents a single J8-GECI cell tracked for up to 10 min, exploiting the currents generated by adding cells to the SLBs to probe the adhesiveness of the different SLBs. Data are from the same experiment as in (i). k The time taken for 50% of J8-GECI cells to adhere to the SLBs. SLB2 data (blue bars) and SLB2Δglycocalyx (gray bars) were compared separately with a one-way Kruskal–Wallis test with Dunn’s correction using data for the intact SLBs as the control groups. Data are from the same experiment as in (i). Source data are provided in the Source data file.
Fig. 5
Fig. 5. CD2 enhances T-cell sensitivity.
a CD45 exclusion at close contacts formed by J8-GECI-CD2WT cells. The images show a J8-GECI-CD2WT cell during the scanning stage on an SLB2 presenting pMHCnull; inset shows GECI fluorescence, indicating a lack of signaling. A min/max normalized intensity line profile was taken along the direction of the white arrow and indicates CD45 exclusion at close contacts. The kymograph shows contact stabilization and persistent CD45 exclusion from contacts. See Supplementary Movies 21–23. be Close contact feature analysis for both signaling and non-signaling J8-GECI-CD2WT and variant cells during the scanning stage on an SLB2 presenting pMHCnull; n = 9 (J8-GECI-CD2WT, from 2 SLBs), 11 (J8-GECI-CD2ΔCYT, from 2 SLBs), and 17 (J8-GECI-CD2KO, from 3 SLBs) cells. The boxplots indicate the quartiles with a line at the median. Whiskers extend to points that lie within 1.5 IQRs of the lower and upper quartile. Conditions were compared using the Kruskal–Wallis H test, and, if p < 0.05, further compared using the pairwise Mann–Whitney U test. The p values are shown. b Mean number of close contacts per cell. c Mean single close-contact area. The analysis uses the same cells as in (b). d Mean glycocalyx exclusion at close contacts. The analysis uses the same cells as in (b). e Mean exclusion from close contacts of CD45 on the J8-GECI cell surface. The analysis uses the same cells as in (b). f Calcium response curves for J8-GECI-CD2WT, J8-GECI-CD2ΔCYT, and J8-GECI-CD2KO cell lines interacting with SLB2s presenting pMHCnull ± pMHC9V at the indicated densities. Data were fitted using a four-point dose-response curve, constrained to a minimum based on responses to pMHCnull; n = 27 (J8-GECI-CD2WT), 25 (J8-GECI-CD2ΔCYT), and 25 (J8-GECI-CD2KO) SLBs per curve with ≥139 cells analyzed per SLB. The EC50 values for J8-GECI-CD2WT, J8-GECI-CD2ΔCYT, and J8-GECI-CD2KO cells were 0.7, 3.2, and 64.5 molecules pMHC9V/μm2, respectively. g Increased Lck recruitment to close contacts for cells expressing full-length CD2 versus CD2ΔCYT on an SLB2 presenting pMHCnull + pMHC9V-lo; n = 1080 (J8-GECI-CD2WT) and 983 (J8-GECI-CD2ΔCYT) contacts analyzed from 10 FOVs. Means were compared using a two-sided Student’s t-test. Source data are provided in the Source data file.
Fig. 6
Fig. 6. Antigen discrimination requires size-constrained close-contact formation.
a Calcium response curves for J8-GECI cells interacting with SLB2s presenting pMHCnull plus increasing densities of different-affinity pMHC. b Median time taken for cells to signal. From the same experiment as in (a). In a, b, each datapoint corresponds to a separate SLB; n = 14 SLBs with ≥148 cells analyzed per SLB. Data were fitted using a four-point dose-response curve, with the bottom of each curve in (a), and top of each curve in (b), constrained to responses on an SLB2 presenting pMHCnull. c Area (left y-axis) and diameter (right y-axis) of close contacts formed by J8-GECI cells interacting with an SLB2 presenting pMHCnull plus the indicated agonist pMHC at point of calcium release; n = 68 (9Vhi, from 18 cells), 148 (9Vlo, from 17 cells), 100 (3Ilo, from 16 cells), 9 (9Llo, from 5 cells), 42 (4Dlo, from 7 cells), and 58 (Null/gp100, from 11 cells) individual contacts. Data obtained for pMHCnull and pMHC9V-hi/lo SLBs are from the same experiment as in Fig. 3b–e. To measure the correlation between the affinity of low-density pMHC and the contact size, a linear least-squares regression was performed, and the p-value shown. The boxplots indicate the quartiles with a line at the median. Whiskers extend to points that lie within 1.5 IQRs of the lower and upper quartile. d TIRFM images of close-contact formation with/without calcium release for the indicated cell lines on SLB2s presenting pMHCnull. A white dashed circle is shown for the J8-GECI-CD2KO cell line to indicate the region of close-contact formation. e Fraction of cells that produce signals on an SLB2 presenting pMHCnull. Shown is the mean (± S.D.) of n = 3 SLBs with ≥309 cells analyzed per SLB. Means were compared using one-way ANOVA with Šídák correction. f Fraction of cells that signal on an SLB2 presenting pMHCnull plus ~10 molecules/μm2 of different-affinity pMHC. Data obtained for J8-GECI-CD2WThi cells are shown in dark blue with each point representing the mean ± S.D (n = 3 SLBs per agonist pMHC with 16-75 cells analyzed per SLB). The light blue line is taken from curves fitted in (a) for data obtained with the J8-GECI cells. The gray datapoint is taken from Fig. 5f for the J8-GECI-CD2KO cell line. Source data are provided in the Source data file.

References

    1. Polliack A, de Harven E. Surface features of normal and leukemic lymphocytes as seen by scanning electron microscopy. Clin. Immunol. Immunopath. 1975;3:412–430. doi: 10.1016/0090-1229(75)90029-X. - DOI - PubMed
    1. Cai E, et al. Visualizing dynamic microvillar search and stabilization during ligand detection by T cells. Science. 2017;356:eaal3118. doi: 10.1126/science.aal3118. - DOI - PMC - PubMed
    1. Fernandes RA, et al. A cell topography-based mechanism for ligand discrimination by the T cell receptor. Proc. Natl Acad. Sci. USA. 2019;116:14002–14010. doi: 10.1073/pnas.1817255116. - DOI - PMC - PubMed
    1. Vink H, Duling BR. Identification of distinct luminal domains for macromolecules, erythrocytes, and leukocytes within mammalian capillaries. Circ. Res. 1996;79:581–589. doi: 10.1161/01.RES.79.3.581. - DOI - PubMed
    1. Kuo JCH, Gandhi JG, Zia RN, Paszek MJ. Physical biology of the cancer cell glycocalyx. Nat. Phys. 2018;14:658–669. doi: 10.1038/s41567-018-0186-9. - DOI - PMC - PubMed

Publication types