. 2023 Mar 23;14(1):1610.
doi: 10.1038/s41467-023-37328-9.

STING agonist-loaded, CD47/PD-L1-targeting nanoparticles potentiate antitumor immunity and radiotherapy for glioblastoma

Affiliations

STING agonist-loaded, CD47/PD-L1-targeting nanoparticles potentiate antitumor immunity and radiotherapy for glioblastoma

Peng Zhang et al. Nat Commun. .

Abstract

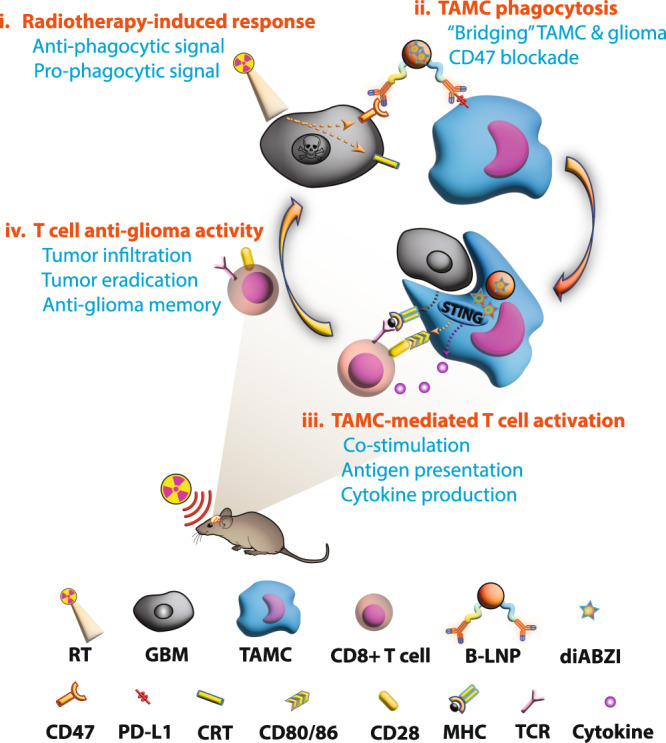
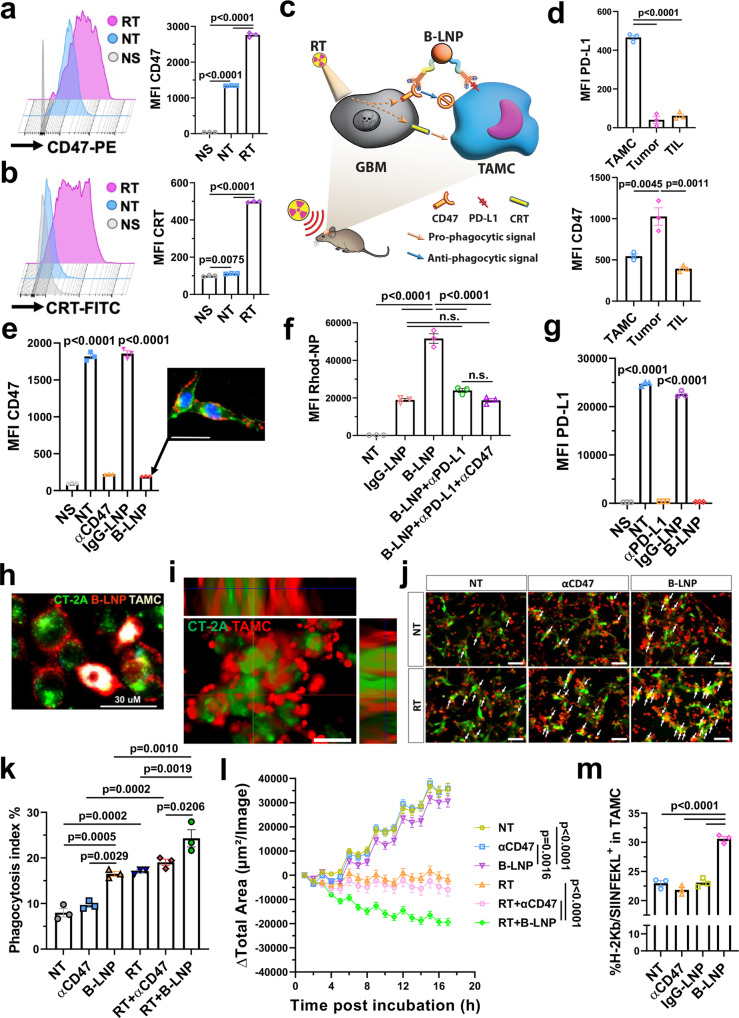
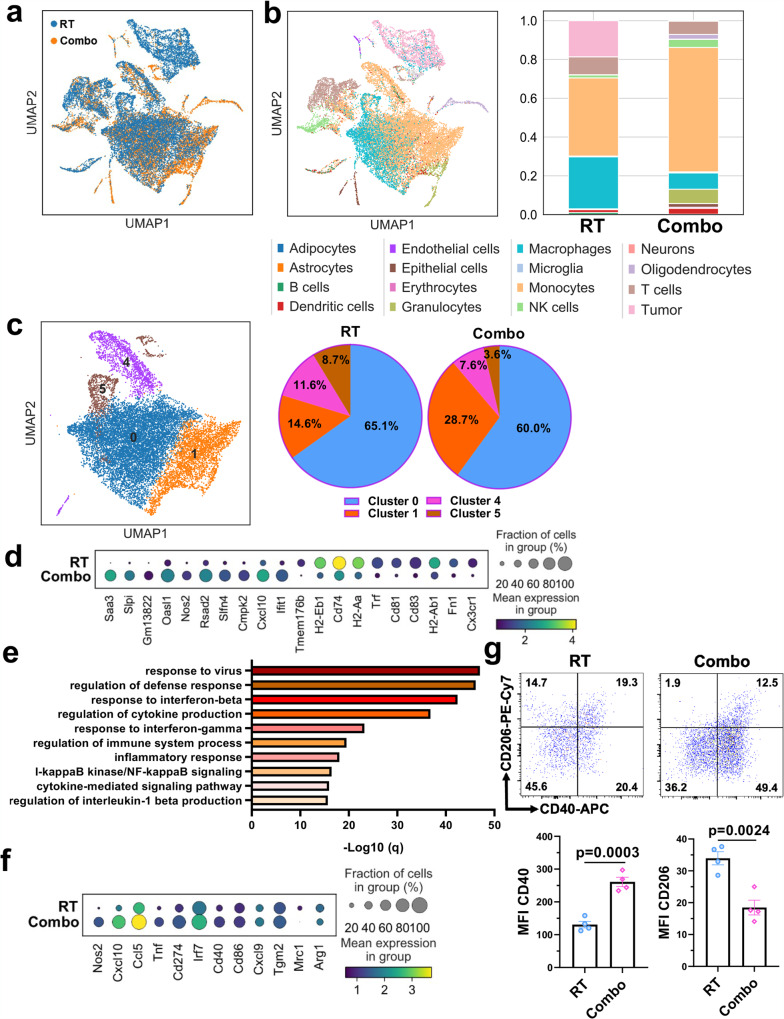
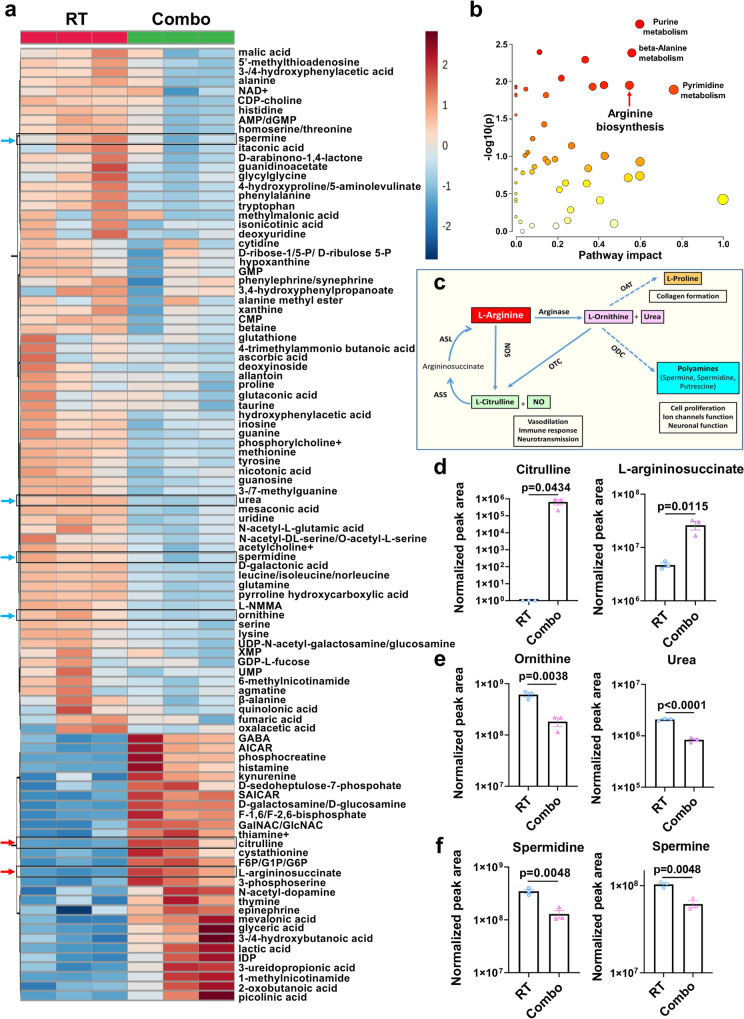
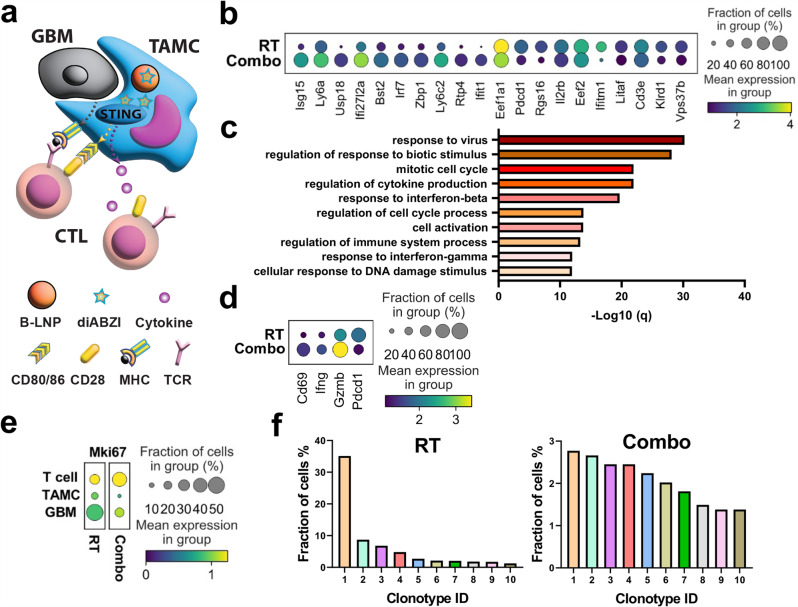
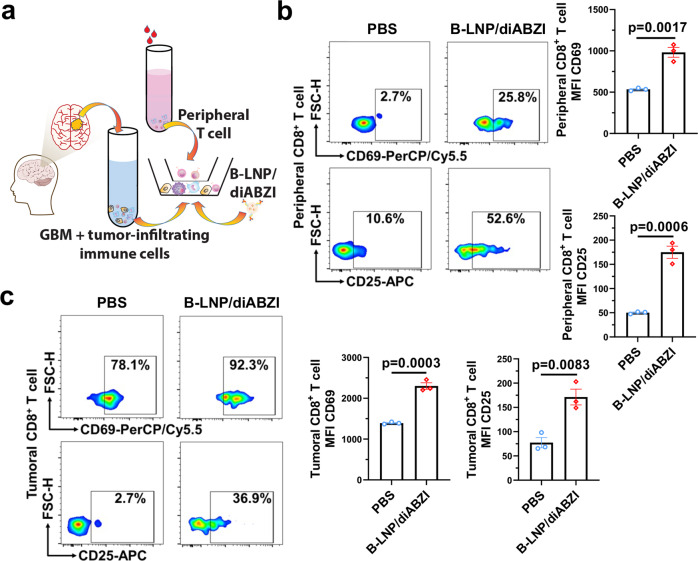
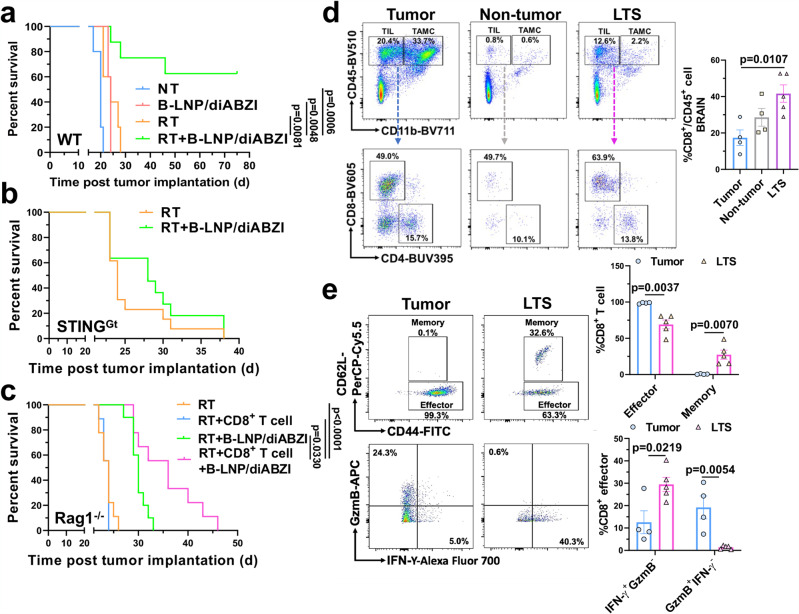
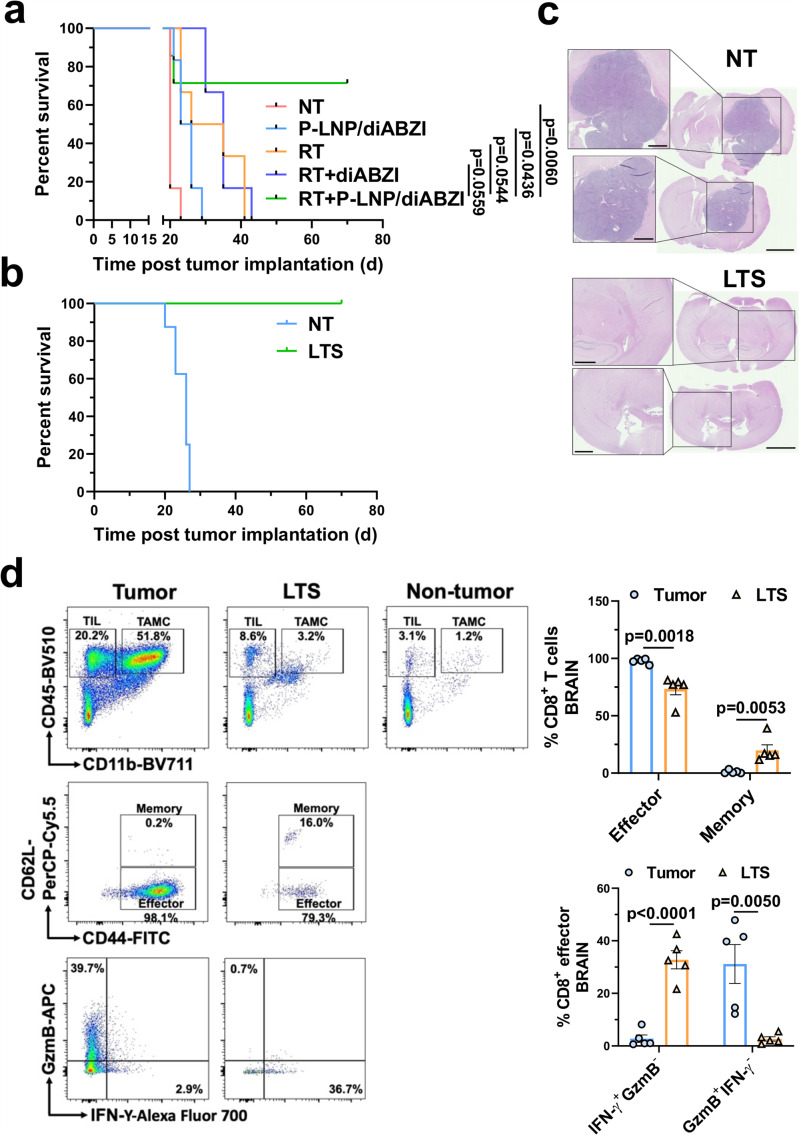
As a key component of the standard of care for glioblastoma, radiotherapy induces several immune resistance mechanisms, such as upregulation of CD47 and PD-L1. Here, leveraging these radiotherapy-elicited processes, we generate a bridging-lipid nanoparticle (B-LNP) that engages tumor-associated myeloid cells (TAMCs) to glioblastoma cells via anti-CD47/PD-L1 dual ligation. We show that the engager B-LNPs block CD47 and PD-L1 and promote TAMC phagocytic activity. To enhance subsequent T cell recruitment and antitumor responses after tumor engulfment, the B-LNP was encapsulated with diABZI, a non-nucleotidyl agonist for stimulator of interferon genes. In vivo treatment with diABZI-loaded B-LNPs induced a transcriptomic and metabolic switch in TAMCs, turning these immunosuppressive cells into antitumor effectors, which induced T cell infiltration and activation in brain tumors. In preclinical murine models, B-LNP/diABZI administration synergized with radiotherapy to promote brain tumor regression and induce immunological memory against glioma. In summary, our study describes a nanotechnology-based approach that hijacks irradiation-triggered immune checkpoint molecules to boost potent and long-lasting antitumor immunity against glioblastoma.


Conflict of interest statement

A provisional patent application pertaining to the work presented in this manuscript was filed by Northwestern University with P.Z. and M.L. as inventors. The remaining authors declare no competing interests.

Figures

Fig. 1
Fig. 1. Schematic representation of B-LNP-mediated therapeutic hijacking of TAMCs to boost antitumor immunity and potentiate radiotherapy for GBM.
i, Radiotherapy (RT) induces overexpression of pro-phagocytic signal calreticulin (CRT) and anti-phagocytic molecule CD47 in glioma cells. ii, B-LNPs were engineered to “bridge” TAMCs and GBM through CD47 and PD-L1 dual-ligation, block both checkpoint molecules, and promote phagocytosis of tumor cells. iii, In addition to acting as an engager, B-LNPs also encapsulate STING agonist to promote type I interferon responses in TAMCs, which trigger infiltration and activation of tumor-antigen specific T cells. iv, Reprogrammed TAMCs promote T cell-mediated antitumor responses, leading to durable tumor eradication. TCR, T cell receptor; MHC, major histocompatibility complex. The figure was generated using Adobe Illustrator. The mouse illustration was sourced and adapted from Scidraw.io (doi.org/10.5281/zenodo.3925921).
Fig. 2
Fig. 2. B-LNPs engage TAMC and promote phagocytosis.
a, b Flow cytometric quantification of radiotherapy (RT)-triggered overexpression of CD47 (a) and calreticulin (CRT) (b) in CT-2A glioma cells 72 h after 9 Gy of irradiation. Data are shown as mean fluorescence intensity (MFI). NT, non-treated; NS, unstained control. n = 3 independent samples. c Schematic presentation of the “bridging” effect of B-LNP to engage TAMC and block the checkpoint molecules CD47 and PD-L1. The scheme was generated using Adobe Illustrator. The mouse illustration was sourced and adapted from Scidraw.io (doi.org/10.5281/zenodo.3925921). d Flow cytometric quantification (MFI) of PD-L1 and CD47 expression in different subsets of cells in CT-2A-bearing brains 72 h after brain-focused radiotherapy. n = 3 mice. e Flow cytometric quantification (MFI) of CD47 expression in CT-2A cells treated with αCD47 antibody at 25 μg/ml. n = 3 independent samples. Figure insert indicates cell membrane binding of Rhod-tagged B-LNP (red) in CT-2A cells (green) with nuclear staining (blue). Scale bar, 30 μm. f Binding efficiency of Rhod-tagged B-LNP to CT-2A-associated TAMCs. n = 3 donor mice. g Flow cytometric quantification (MFI) of PD-L1 expression in CT-2A-associated TAMCs treated with αPD-L1 antibody at 25 μg/ml. n = 3 biological replicates. h Cellular distribution of Rhod-tagged B-LNP (red) in a co-culture of CT-2A (green) and TAMC (gray) for 30 min. Scale bar, 30 μm. The experiment was carried out independently three times. i Z-stack microscopic image of co-cultured irradiated CT-2A (green) and TAMC (red) in an ultra-low attachment plate. Scale bar, 100 μm. The experiment was carried out independently three times. j, k TAMC (red) phagocytosis of CT-2A (green) +/- RT treated with αCD47 antibody (free or B-LNP-conjugated form) at 10 μg/ml for 4 h at 37 °C. Arrows indicate the phagocytic cells. Phagocytic index was determined by fluorescence microscopy. n = 3 donor mice. Scale bar, 100 μm. l, Kinetics of TAMC phagocytic clearance of CT-2A were measured by IncuCyte in a co-culture of CT-2A-GFP and TAMCs. n = 16 views by IncuCyte. m Flow cytometric quantification of OVA257-264 (SIINFEKL) peptide bound to H-2Kb in TAMCs 24 h after co-cultured with CT-2A-OVA. n = 3 biological replicates. One-way ANOVA with Tukey’s multiple comparisons test was used in all figure panels. The data are presented as mean + /- SEM. Representative dot plots of flow cytometric analysis are provided in Supplementary Fig. 1. Source data are provided as a Source Data file.
Fig. 3
Fig. 3. B-LNP-mediated targeted delivery of diABZI remodels transcriptomic and phenotypic features of TAMC.
af Single-cell RNA sequencing analysis of brain tumors from CT-2A-bearing C57 mice received radiotherapy (RT) or RT + B-LNP/diABZI combination therapy (referred to as Combo) (n = 5 mice pooled per sample). a UMAP plots of the clustering of cells collected from brain tumors as color-coded by treatments (RT, blue v.s. Combo, orange). b Cell composition analysis of brain tumors after RT or Combo treatments. c Sub-cluster analysis of TAMCs. Gene enrichment analysis and the full list of the upregulated genes in sub-cluster 1 are provided in Supplementary Fig. 9a and Supplementary Dataset 1. d Unbiased expression analysis indicating top upregulated and downregulated genes in TAMCs post-Combo treatment as compared to RT alone. e GO analysis of top upregulated pathways in TAMCs post-Combo treatment. q-values were determined using the Benjamini-Hochberg procedure to account for multiple testing. The full gene list is provided in Supplementary Dataset 2. f Expression analysis of representative genes in related to TAMC pro-inflammatory and anti-inflammatory activities. g Flow cytometric analysis of CD40 and CD206 expression in TAMCs from CT-2A-bearing brains of C57 mice. n = 4 mice. Statistics were determined by two-sided Student’s t-test. The data are presented as mean + /- SEM. Source data are provided as a Source Data file.
Fig. 4
Fig. 4. B-LNP/diABZI treatment reprograms metabolic features of TAMC.
Bulk metabolomic analysis of TAMCs from CT-2A-bearing brains of C57 mice received radiotherapy (RT) or RT + B-LNP/diABZI combination therapy (referred to as Combo). Unbiased metabolomics (a) and metabolic pathway analysis (b) of TAMCs from brain tumors. c Schematic illustration of the arginine metabolic pathway. LC-MS/MS analysis of iNOS (d), ARG1 (e), and ornithine decarboxylase (ODC) (f)-derived metabolites in TAMCs. n = 3 samples (TAMCs collected from 5 CT-2A-bearing mice were pooled for each sample; in total, 15 mice per treatment group). Statistics were determined by two-sided Student’s t-test. The data are presented as mean + /- SEM. Source data are provided as a Source Data file.
Fig. 5
Fig. 5. Nanoparticle-mediated TAMC reprogramming induces transcriptomic changes of T cells in murine gliomas.
a Schematic representation of the interaction between B-LNP/diABZI-reprogrammed TAMC and T cell. The scheme was generated using Adobe Illustrator. b–f Single-cell RNA sequencing analysis of T cells from CT-2A brain tumors in C57 mice received radiotherapy (RT) or RT + B-LNP/diABZI combination therapy (referred to as Combo) (n = 5 mice pooled per sample). b Unbiased differential expression analysis indicating top upregulated and downregulated genes in T cells post-Combo treatment as compared to RT alone. c GO analysis of top upregulated pathways in T cells post-Combo treatment. q-values were determined using the Benjamini-Hochberg procedure to account for multiple testing. The full gene list is provided in Supplementary Dataset 3. d Expression analysis of representative genes in related to T cell activation. e Differential expression analysis of Mki67 expression in T cell, TAMC, and tumor cell. f T cell clonotype analysis.
Fig. 6
Fig. 6. Therapeutic reprogramming of TAMC enhances CD8+ T cell infiltration and activation in murine gliomas.
a CD45.1+ CD8+ T cells were adoptively transferred through intravenous administration to CT-2A tumor-bearing C57 mice received radiotherapy (RT) followed by saline or B-LNP/diABZI (0.25 mg/kg diABZI) treatment through an intracranially implanted cannula. CD45.1+ cells were analyzed by flow cytometry in tumor-bearing brains (n = 5 mice). T cell activation status was assessed by CD69 expression. A representative animal for each group is shown. b CD8+ T cell brain localization was demonstrated by immunofluorescence staining. Dotted line indicates the border of normal brain (B) and tumor site (T). Scale bar, 100 μm. The experiment was carried out twice independently. c MSD multiplex cytokine analysis of serum and brain tumors collected from CT-2A-bearing C57 mice received RT + saline (n = 4 mice) or B-LNP/diABZI (n = 3 mice). d CT-2A-bearing mice were treated by RT + saline, free diABZI + αPD-L1 + αCD47 (Cocktail), or B-LNP/diABZI. T cells were analyzed by flow cytometry in tumor-bearing brains (n = 3 or 4 mice/group). T cell activation status was assessed by expression of CD69. The scheme was generated using Microsoft PowerPoint and Adobe Illustrator. The mouse (doi.org/10.5281/zenodo.3925921) and syringe (10.5281/zenodo.4152947) illustrations were sourced and adapted from Scidraw.io. Statistics were determined by two-sided Student’s t-test (in a, c) or one-way ANOVA with Tukey’s multiple comparisons test (in d). The data are presented as mean + /- SEM. Source data are provided as a Source Data file.
Fig. 7
Fig. 7. Anti-human CD47/PD-L1 functionalized B-LNP/diABZI activates GBM patient-derived T cells.
a Schematic representation of ex vivo experiments using clinical specimens from GBM patients. The scheme was generated using Adobe Illustrator. The human brain illustration was sourced and adapted from Scidraw.io (doi.org/10.5281/zenodo.3925925, doi.org/10.5281/zenodo.3926065). Ex vivo samples were treated with PBS or anti-human CD47/PD-L1 functionalized B-LNP/diABZI at diABZI concentration of 100 nM. Flow cytometric analysis of activation status of peripheral (b) and tumoral (c) CD8+ T cells collected from clinical specimens of GBM case NU02747. n = 3 independent formulation samples. Statistics were determined by two-sided Student’s t-test. The data are presented as mean + /- SEM. Source data are provided as a Source Data file.
Fig. 8
Fig. 8. B-LNP/diABZI treatment potentiates the antitumor effects of radiotherapy in glioma-bearing mice.
ac Survival curves of C57 wildtype (WT) (a), STINGGt (b), and Rag1-/- (c) mice received intracranial implantation of 5×10⁴ CT-2A glioma cells and two administrations of saline or B-LNP/diABZI (0.25 mg/kg diABZI) through an intracranially implanted cannula. Selected groups of mice received radiotherapy (RT, 3 Gy×3) as monotherapy or combination therapy starting from the seventh day post-tumor implantation. In (c) selected groups of mice also received two doses of adoptively transferred CD8+ T cells (5×10⁶ per dose) through intravenous injection. Statistics were determined by Log-rank method with p values adjusted by Bonferroni correction. de Freshly dissected brains from long-term survivor (LTS), age-matched tumor-bearing mice, and age-matched non-tumor control mice were analyzed by flow cytometry for immune composition (d) and CD8+ T cell phenotypes (e). n = 4-5 mice. TIL, tumor-infiltrating lymphocyte. Statistics were determined by one-way ANOVA with Tukey’s multiple comparisons test (in d) or two-sided Student’s t-test (in e). The data are presented as mean + /- SEM. Source data are provided as a Source Data file.
Fig. 9
Fig. 9. Systemic nanoparticle delivery of diABZI potentiates the anti-glioma effects of radiotherapy.
C57 mice received intracranial implantation of 7.5×10⁴ CT-2A cells and three administrations of saline, free diABZI, or P-LNP/diABZI (2.5 mg/kg diABZI) through intravenous injections. Selected groups of mice received radiotherapy (RT, 3 Gy×3) as monotherapy or combination therapy. a Survival curves of CT-2A-bearing C57 mice received different treatments. n = 6–7 mice per group. Survival curves were compared using Log-rank test for those with proportional hazards or Renyi’s test for those with crossing hazards with p values adjusted by Bonferroni correction. b 180 d after tumor implantation, long-term survivor (LTS) mice were rechallenged with 7.5×10⁴ CT-2A cells in the opposite hemisphere of the initial tumor injection site. The animal survival was compared to age-matched tumor-bearing control mice (NT). c Tumor burden in control and LTS mice were evaluated through H&E staining. Scale bar, 2.5 mm; insert scale bar, 1 mm. d 100 d post-rechallenge, freshly dissected brains from LTS, age-matched tumor-bearing mice, and age-matched non-tumor control mice were analyzed by flow cytometry for immune composition and CD8+ T cell phenotypes. n = 5 mice. Statistics were determined by two-sided Student’s t-test. The data are presented as mean + /- SEM. Source data are provided as a Source Data file.
Fig. 10
Fig. 10. Nanoparticle treatment reshapes immune microenvironment and potentiates the therapeutic effects of radiotherapy in PVPF8 murine gliomas.
C57 mice received intracranial implantation of 7.5×10⁴ PVPF8 cells, radiotherapy (RT, 3 Gy×3) and two administrations of saline or P-LNP/diABZI (2.5 mg/kg diABZI) through intravenous injections. a Histology of the brains was evaluated by H&E staining. Scale bar, 2.5 mm; inset scale bar, 500 μm. b Freshly dissected brains were analyzed by flow cytometry for immune composition, TAMC, and CD8+ T cell phenotypes. n = 5 mice. Statistics were determined by two-sided Student’s t-test; data are presented as mean + /- SEM. Representative dot plots of flow cytometric analysis are provided in Supplementary Fig. 20. c Survival curves of the PVPF8 tumor-bearing mice received RT (3 Gy×3) and two administrations of saline or P-LNP/diABZI (2.5 mg/kg diABZI) through intravenous injections. n = 9 mice. Statistics were determined by Log-rank method. Source data are provided as a Source Data file.

References

    1. Atun R, et al. Expanding global access to radiotherapy. Lancet Oncol. 2015;16:1153–1186. doi: 10.1016/S1470-2045(15)00222-3. - DOI - PubMed
    1. Barker HE, Paget JT, Khan AA, Harrington KJ. The tumour microenvironment after radiotherapy: mechanisms of resistance and recurrence. Nat. Rev. Cancer. 2015;15:409–425. doi: 10.1038/nrc3958. - DOI - PMC - PubMed
    1. Demaria S, Coleman CN, Formenti SC. Radiotherapy: Changing the Game in Immunotherapy. Trends Cancer. 2016;2:286–294. doi: 10.1016/j.trecan.2016.05.002. - DOI - PMC - PubMed
    1. Engblom C, Pfirschke C, Pittet MJ. The role of myeloid cells in cancer therapies. Nat. Rev. Cancer. 2016;16:447–462. doi: 10.1038/nrc.2016.54. - DOI - PubMed
    1. Awad RM, De Vlaeminck Y, Maebe J, Goyvaerts C, Breckpot K. Turn Back the TIMe: Targeting Tumor Infiltrating Myeloid Cells to Revert Cancer Progression. Front Immunol. 2018;9:1977. doi: 10.3389/fimmu.2018.01977. - DOI - PMC - PubMed

Publication types