. 2023 Apr;24(4):637-651.
doi: 10.1038/s41590-023-01469-2. Epub 2023 Mar 23.

How autoreactive thymocytes differentiate into regulatory versus effector CD4+ T cells after avoiding clonal deletion

Affiliations

How autoreactive thymocytes differentiate into regulatory versus effector CD4+ T cells after avoiding clonal deletion

Xuguang Tai et al. Nat Immunol. 2023 Apr.

Abstract

Thymocytes bearing autoreactive T cell receptors (TCRs) are agonist-signaled by TCR/co-stimulatory molecules to either undergo clonal deletion or to differentiate into specialized regulatory T (Treg) or effector T (Teff) CD4+ cells. How these different fates are achieved during development remains poorly understood. We now document that deletion and differentiation are agonist-signaled at different times during thymic selection and that Treg and Teff cells both arise after clonal deletion as alternative lineage fates of agonist-signaled CD4+CD25+ precursors. Disruption of agonist signaling induces CD4+CD25+ precursors to initiate Foxp3 expression and become Treg cells, whereas persistent agonist signaling induces CD4+CD25+ precursors to become IL-2+ Teff cells. Notably, we discovered that transforming growth factor-β induces Foxp3 expression and promotes Treg cell development by disrupting weaker agonist signals and that Foxp3 expression is not induced by IL-2 except under non-physiological in vivo conditions. Thus, TCR signaling disruption versus persistence is a general mechanism of lineage fate determination in the thymus that directs development of agonist-signaled autoreactive thymocytes.


Conflict of interest statement

The authors declare no competing interests.

Figures

Fig. 1
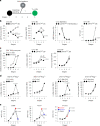
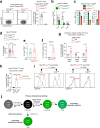
Fig. 1. Timing of clonal deletion and Treg generation in the thymus.
a, Flow cytometric analysis of CD4+ thymocytes by CD69/CCR7 expression identifies five sequential stages of thymocyte differentiation (stages 1–5) in Rag-GFP.B6 mice as shown by steadily declining Rag-GFP expression (mean fluorescence intensity (MFI)) after stage 2. Differentiation time from stage 2 onward was calculated by the formula: time (h) = (100 − relative Rag-GFP MFI) / 0.9 based on a Rag-GFP half-life of 54–56 h and Rag-GFP content in stage 2 thymocytes set equal to 100. Data are representative of more than ten independent experiments. b, Surface CD28 expression on thymocytes from each strain was normalized relative to stage 2, which was set equal to 100%. Mean ± s.e.m. of five mice from three independent experiments. Clonal deletion induced by superantigens and conventional antigens. TCR-Vβ6 frequencies at each stage of differentiation in CD4+ thymocytes from indicated mice (n = 4, per strain). Relative number of TCR transgenic CD4+ thymocytes in antigen-positive compared to antigen-negative mice at each thymocyte stage. AND TCRTg (n = 4, per strain) and OT-II TCRTg (n = 11, per strain) were analyzed. Mean ± s.e.m. of three to six independent experiments. c, Frequency of Foxp3+ cells among CD4+ thymocytes at each thymocyte stage determined by Foxp3-GFP expression or intracellular Foxp3 staining. Mean ± s.e.m. of three independent experiments. d, Timing of TCR-Vβ5 deletion and Treg generation in the same thymus. Frequency of TCR-Vβ5+ thymocytes and TCR-Vβ5+Foxp3+ cells among CD4+ thymocytes in Rag-GFP/Foxp3-RFP.B6 double-reporter mice (left). Differentiation time from stage 2 was calculated as in a (right). Mean ± s.e.m. of three experiments. e, TCR/CD28-signaled death of different stage thymocytes in overnight culture. Thymocytes at each stage of development were either stimulated with anti-TCR/CD28 or placed in medium cultures overnight. After overnight culture, dead cells were identified by ethidium bromide staining and frequency of dead cells in stimulation cultures was normalized to that in medium cultures at each thymocyte stage. Data are mean ± s.e.m. of triplicate cultures representative of three independent experiments; two-tailed unpaired Student’s t-test was used for b,c. Source data
Fig. 2
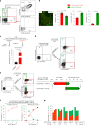
Fig. 2. Assessment of clonal deletion and Treg generation in the absence of late-stage agonist signaling.
a, Schematic illustration that TCR/CD28-mediated agonist signaling of early stage thymocytes induces clonal deletion but it is not known whether it also induces Treg cells. b, Diminished or absent TCR signal transduction in late-stage CD4+ thymocytes from ZAP70TgKO mice and its effect on clonal deletion and Treg generation. Different stage CD4+ thymocytes were assessed for expression of the indicated proteins (left) or frequencies of TCR-Vβ6 and Foxp3+ cells. TCR-Vβ6+ frequencies in CD4+ thymocytes from intact B6xCBA/J mice and CD4+ thymocytes of ZAP70TgKO (CD45.1) origin that developed in irradiated B6xCBA/J (CD45.1+) host mice. c, Effect of late-stage agonist signaling on n-cRel and n-Foxo1 upregulation. n-cRel and n-Foxo1 in different stage B6 thymocytes were expressed relative to stage 5, which was set equal to 100% (left). Intracellular staining for n-cRel and n-Foxo1 was compared in different stage CD4+ thymocytes from ZAP70TgKO B6 (n = 3) and control B6 (n = 3) mice (middle and right). d, Impact of antigen-specific agonist signaling on n-cRel and n-Foxo1 expression in TCR transgenic thymocytes at different stages of differentiation. n-cRel and n-Foxo1 were quantified in different stage CD4+ thymocytes from AND and OT-II TCR transgenic mice expressing or lacking their agonist antigen (PCC or OVA). e, In vivo TCR signaling is disrupted at stage 5. Analysis of CD69, Nur77-GFP and n-Foxo1 expression in different stage CD4+ thymocytes. CD25+ stage 4 thymocytes, Foxp3+ stage 5 thymocytes and conventional (CD25+, Foxp3+ and conventional (conv)) thymocytes are indicated. Data were analyzed by two-tailed unpaired Student’s t-test for be and show mean ± s.e.m. of three experiments. Source data
Fig. 3
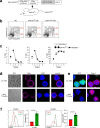
Fig. 3. Generation of Foxp3+ Treg cells in vitro.
a, In vitro signaled stage 4 thymocytes express Foxp3 only after placement in medium culture. Electronically sorted stage 1 and stage 4 CD4+ thymocytes from hBcl-2Tg mice were cultured in vitro for 24 h with immobilized anti-TCR/CD28 monoclonal antibodies for 1 day and then either continued or transferred into medium cultures for day 2, after which cultured thymocytes were analyzed. Data show mean ± s.e.m. of triplicate cultures representative of four independent experiments. b, In vivo signaled stage 4 thymocytes express Foxp3 after medium culture. Sorted stage 4 CD4+ thymocytes from hBcl-2Tg mice were placed in O/N medium cultures and then assessed for expression of the indicated proteins. Data show mean ± s.e.m. of triplicate cultures representative of five independent experiments. c, Foxp3 precursors are Foxp3CD69+CD25+ thymocytes. CD4SP thymocytes from hBcl-2Tg mice were electronically sorted as indicated, placed in O/N medium cultures and then analyzed. Data are representative of six independent experiments. d, CD4SP thymocytes from hBcl-2Tg mice were electronically sorted as indicated, placed in O/N medium cultures and then analyzed. Data are representative of nine independent experiments. e, CD4SP thymocytes from the indicated strains were analyzed by flow cytometry. Where indicated, Foxp3CD25+ thymocytes were electronically sorted and placed in O/N medium cultures, after which they were assessed for Foxp3 and CD25 expression. Results for each strain are representative of five independent experiments. f, Sorted Foxp3CD25+ thymocytes from hBcl-2Tg mice were placed in O/N medium cultures; cells that became Foxp3-GFP+ were then purified again by electronic sorting, placed in O/N cultures containing IL-2 and assessed for Foxp3-GFP and CD25 expression. Data are representative of three independent experiments. g, Purified Foxp3CD69+CD25+ thymocytes from the indicated mice were placed in O/N medium cultures and then analyzed. Data are representative of six independent experiments. Numbers in flow cytometry plots indicate percentages. Data were analyzed by two-tailed unpaired Student’s t-test (a,b).
Fig. 4
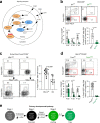
Fig. 4. In vivo generation of Foxp3+ Treg cells after intra-thymic transfer.
a,b, Purified Foxp3CD25+ CD4 SP thymocytes (CD45.2+) from B6 or hBcl-2Tg mice were injected into the thymus of CD45.1+ B6 (n = 4 or 6 for B6 or hBcl-2Tg donor cells) or IL-2KO (n = 3 or 6 for B6 or hBcl-2Tg donor cells) congenic hosts. At the indicated times after injection, thymi were recovered and phenotype of donor populations was determined. Dots represent individual mice assayed in three independent experiments. IT, intra-thymic transfer. c, Purified Foxp3CD25+ or Foxp3+CD25 CD4 SP thymocytes from hBcl-2Tg mice (CD45.2+) were injected into the thymus of CD45.1+ B6 congenic hosts. At the indicated time of post injection, thymi were recovered and phenotype of donor populations was determined. Two to five host mice per each time point were analyzed in two to three independent experiments (n = 4 (12 h), n = 5 (24 h), n = 4 (40 h), n = 2 (60 h) and n = 2 (90 h) for Foxp3CD25+ thymocytes, n = 1 (12 h), n = 4 (40 h) and n = 5 (90 h) for Foxp3+CD25 thymocytes). d, Purified Foxp3CD25+ CD4 SP thymocytes from the indicated mice were injected into the thymus of CD45.1+ B6 congenic hosts. After 40 h, thymi were recovered and phenotype of donor populations was determined. Dots represent individual mice assayed in three independent experiments. Numbers in flow cytometry plots indicate percentages. Data were analyzed by two-tailed unpaired Student’s t-test and show mean ± s.e.m. (a,b,d). Source data
Fig. 5
Fig. 5. TGF-β and Treg development.
a, TGF-β disrupts in vitro agonist signaling to induce Foxp3+ thymocytes. Conventional (Foxp3CD25) CD4SP thymocytes from B6 mice were stimulated in vitro with immobilized anti-TCR/CD28 monoclonal antibodies alone or together with rTGF-β for 2 d, after which cultured thymocytes were analyzed for the expression of indicated proteins. Mean ± s.e.m. of triplicate cultures representative of five independent experiments. b, Foxp3CD25+ CD4SP thymocytes from the indicated mice were injected into the thymus of CD45.1+ B6 hosts. After 40 h, phenotype of donor populations was determined. Representative of three independent experiments. c,d, CD4SP thymocytes from the indicated strains were analyzed by flow cytometry. Representative of four to six independent experiments. e, IL-2 mRNA expression in stage 5 CD4SP thymocytes or IL-2 protein in the serum or in the thymus of indicated mice. Data are mean ± s.e.m. of four technical replicates representative of four independent experiments for IL-2 mRNA and mean ± s.e.m. for IL-2 protein. Dots represent individual mice for protein analysis. f, Foxp3CD25+ CD4SP thymocytes from hBcl-2Tg mice (CD45.1+) were injected into the thymus of CD45.2+ B6 (n = 7) or γccKOTGFβR1cKO (n = 4) hosts. After 40 h, phenotype of donor populations was determined. Representative of three independent experiments. g,h, Foxp3CD25+ CD4SP thymocytes from B6 or hBcl-2Tg mice (CD45.1+) were injected into the thymus of CD45.2+ B6 or CD25KO hosts. After 40 h, phenotype and frequency analysis of the donor populations were determined. i, Foxp3CD25+ CD4SP thymocytes from hBcl-2Tg mice (CD45.1+) were injected into the thymus of CD45.2+ γccKOTGFβR1cKO hosts that had received either rat IgG or anti-IL-2-neutralizing antibodies. After 40 h, the phenotype of donor populations was determined. Dots represent individual mice assayed in three independent experiments. j, Foxp3CD25+ CD4SP thymocytes from hBcl-2TgFoxocDKO mice (CD45.1+) were injected into the thymus of CD45.2+ B6 or CD25KO hosts that had received either rat IgG or anti-IL-2-neutralizing antibodies. After 40 h, phenotype of donor populations was determined. Red arrows in fj indicate the primary (left) and alternative (right) developmental pathways. Numbers in the flow cytometry plots indicate percentages. Data were analyzed by two-tailed unpaired Student’s t-test and show mean ± s.e.m. (a,e,i).
Fig. 6
Fig. 6. SOCS1 expression during primary Treg differentiation and the development of IL-2+ Teff cells in the thymus.
a, ThPOK protein and SOCS1 mRNA expression in Treg precursors and preTreg cells of B6. CD4SP thymocytes. n = 4, representative of two independent experiments. b, Representative flow cytometry analysis of CD4SP thymocytes from the indicated strains. Red arrows indicate the primary (left) and alternative (right) developmental pathways. c, Purified Foxp3CD25+ CD4 SP thymocytes from the indicated strain (CD45.2+) were injected into the thymus of CD45.2+ B6 congenic hosts. After 40 h, thymi were recovered and phenotype of donor populations was determined. Red arrows indicate the primary (left) and alternative (right) developmental pathways. Data are representative of two independent experiments with three host mice per group. d, Frequency of Foxp3+ Treg cells and IL-2+ Teff cells among CD4SP thymocytes from day 2 neonates (left) and their content of Rag-GFP (right). Dots represent individual mice from three independent experiments. e, Time (in hours) after Rag2 gene cessation when Foxp3 and IL-2 gene expressions appear. Data are representative of three independent experiments. f, IL-2 mRNA in the indicated subsets of B6 CD4SP thymocytes (n = 3, representative of two independent experiments with four technical replicates). DN, double negative. g, IL-2+ Teff cells among CD4SP thymocytes in B6, CD28KO and ZAP70TgKO mice. Dots represent individual mice from five independent experiments. h, Conventional IL-2 CD4SP thymocytes from IL-2 reporter (IL-2.tdTomato) mice were stimulated in vitro with immobilized anti-TCR/CD28 monoclonal antibodies for the indicated time. Data show mean ± s.e.m. of triplicates cultures representative of four independent experiments. Numbers in the flow cytometry plots indicate percentages. Data were analyzed by two-tailed unpaired Student’s t-test, mean ± s.e.m. (a,d,g), one-way analysis of variance with Tukey’s post hoc test (d,f).
Fig. 7
Fig. 7. Signaling of Treg versus Teff cell generation.
a, Flow cytometric analysis of CD4SP thymocytes from Foxp3-GFP/IL-2.tdTomato double-reporter mice. Representative of five independent experiments. b, Immunohistochemical assessment of thymic sections from Foxp3-GFP/IL-2.tdTomato double-reporter mice (left). Green identifies Foxp3-GFP+ thymocytes, red identifies IL-2.tdTomato+ thymocytes, C indicates the thymic cortex and M indicates the thymic medulla. Magnification ×10. Summary analysis of double-reporter thymocytes for expression of the indicated proteins (right). Dots represent individual mice from four independent experiments. c, Purified Foxp3CD25+ CD4SP thymocytes from the indicated strain (CD45.2+) were injected into the thymus of CD45.1+ B6 congenic hosts (n = 3, for each donor cells, two independent experiments). After 40 h, thymi were recovered and IL-2 production from the donor populations was determined by intracellular staining. d,e, Purified conventional (Foxp3IL-2) stage 5 CD4SP thymocytes from indicated double-reporter (Foxp3-GFP/IL-2.tdTomato) mice were stimulated in vitro with immobilized anti-TCR/CD28 monoclonal antibodies alone or together with rTGF-β. Mean ± s.e.m., representative of three independent experiments. f,g, Purified conventional (Foxp3IL-2) B6 stage 5 CD4SP thymocytes from double-reporter (Foxp3-GFP/IL-2.tdTomato) mice were stimulated with different dose of anti-TCR alone or together with different dose of rTGF-β. Frequency of Foxp3+ Treg cells and IL-2+ Teff cells was analyzed after 48 h. Anti-CD28 was fixed at 25 μg ml−1. Data are representative of five independent experiments. Numbers in the flow cytometry plots indicate percentages. Data were analyzed by two-tailed unpaired Student’s t-test and show mean ± s.e.m. (b,c,e).
Extended Data Fig. 1
Extended Data Fig. 1. Timing of clonal deletion and Treg generation in the thymus.
a, Analysis of CD4 and CD8 expression on thymocytes at sequential stages of thymocyte differentiation. Representative of 10 independent experiments. b, Frequencies of TCR-Vβ3+, -Vβ8+ and -Vβ11+ cells at each stage of CD4+ thymocyte differentiation. Mean ± SEM of 3 independent experiments. c, B6 mice were injected intra-peritoneally with EdU (1 mg/mouse) and then assessed after 4 h or 15 h for EdU labeling. Mean ± SEM of 3 mice for each time point, representative of two independent experiments. d, Frequency of Foxp3-RFP+ cells among different stage CD4+ thymocytes expressing the Rag-GFPTg. Mean ± SEM of 5 independent experiments. e, Endogenous Bim and mBcl-2 protein expression in TCR-Vβ5+ cells among different stage CD4+ thymocytes from hBcl-2Tg mice. Two-tailed unpaired t-test, mean ± SEM (b and c). Source data
Extended Data Fig. 2
Extended Data Fig. 2. Assessment of clonal deletion and Treg generation in the absence of late-stage agonist signaling.
a, A schematic representation of the ZAP70TgKO mouse line. Mouse ZAP70 cDNA was put under the control of the Cd8-E8III promoter/enhancer to generate the ZAP70Tg which was then introduced into ZAP70KO mice to generate ZAP70TgKO mice. b, Analysis of CD4+ thymocytes from the indicated mice. c, TCR-Vβ3+, -Vβ5+ and -Vβ8+ frequencies in CD4+ thymocytes from intact B6xCBA/J mice and CD4+ thymocytes of ZAP70TgKO (CD45.1) origin that developed in irradiated B6xCBA/J (CD45.1+) host mice. d, Electronically purified Foxp3-GFP+ Tregs were first surface stained for Qa2 and then fixed with either 4% PFA or eBioscience Transcription Factor Staining Buffer (eBio TF buffer). The hypotonicity of eBio TF buffer was revealed by differential interference contrast (DIC) images and impaired cytoplasmic membrane integrity. e, Sorted Foxp3-GFP+ Tregs were fixed with either 4% PFA or eBio TF buffer and then the intracellular distribution of GFP and Foxo1 were detected. Note the loss of total GFP and cytosolic Foxo1 after eBio TF buffer treatment. Depicted representative of 3 independent experiments (d and e). f, Relative n-cRel and n-Foxo1 expression in Foxp3+ Tregs. The n-cRel and n-Foxo1 content in Foxp3- CD4SP were set as 1. Two-tailed unpaired t-test, mean ± SEM of 5 independent experiments. Source data
Extended Data Fig. 3
Extended Data Fig. 3. Signaling disruption and Treg generation.
a, Regulation of n-Foxo1 expression and its target gene expression. b, CD4SP thymocytes from the indicated strains were analyzed by flow cytometry (top and lower left panels, n = 13 for B7WT and n = 7 for B7DKO). Foxp3-CD25+ Treg precursors from the indicated strains were electronically sorted and placed in O/N medium cultures, after which they were assessed for Foxp3 expression (lower right panel). Dots represent individual mice, n = 10 for B7WT and n = 4 for B7DKO. c, Foxp3-CD25+ CD4SP thymocytes from hBcl-2Tg (n = 18) or B6 (n = 10) mice were placed in O/N medium cultures and then analyzed. Dots represent individual mice assayed in 9 independent experiments. d, CD4SP thymocytes from the indicated strains were analyzed as in b. For fresh cells (top and lower left panels), n = 16 for FoxoWT and n = 19 for FoxocDKO. For cultured cells (lower right panel), n = 18 for FoxoWT and n = 6 for FoxocDKO. e, Schematic of the primary Treg developmental pathway. Agonist signaling disruption occurs in Stage 4 CD25+ precursor thymocytes during their differentiation into stage 5 cells, which upregulates n-Foxo1 expression and induces Foxp3 gene expression. Two-tailed unpaired t-test, mean ± SEM (b, c and d).
Extended Data Fig. 4
Extended Data Fig. 4. Verification of primary Treg developmental pathway in vivo.
a, CD4SP thymocytes from the indicated strains were analyzed by flow cytometry (top panels). Depicted are frequencies of Foxp3+CD25- preTregs and Foxp3+CD25+ mature Tregs (lower panels). Dots represent individual mice (n = 9 for both strains) assayed in 5 independent experiments. b, Foxp3CD25+ or Foxp3+CD25 CD4SP thymocytes from Foxp3RFP reporter positive B6 (CD45.2+) mice were injected into B6 (CD45.1+) host thymus. Donor T cells were analyzed after 40 hr or 90 hr. Representative of 4 experiments. Two-tailed unpaired t-test, mean ± SEM (a).
Extended Data Fig. 5
Extended Data Fig. 5. TGFβ signaling and Treg generation via the alternative pathway.
a, Foxp3CD25+ donor thymocytes (left) were injected into the thymus of B6 congenic hosts. Depicted are frequencies of Foxp3-GFP+ Tregs developed from donor cells (right). N = 8 for TGFβR1WT donor cells and n = 6 for TGFβR1cKO donor cells, assayed in 3 independent experiments. b, Analysis of CD4SP from the indicated strains (n = 7 per strain, assayed in 4 independent experiments). c, Quantification of n-Foxo1, surface CCR7 and CD69 on Foxp3+ CD4SP (n = 4 per strain). Mean ± SEM, 2 independent experiments. d, Frequencies of Foxp3+CD25+ mature Tregs from the indicated hBcl-2Tg strains (n = 17, 11 and 6 for TGFβR1WT, TGFβR1cKO and IL-2KOTGFβR1cKO), assayed in 6 independent experiments. e, Foxp3-CD25+ thymocytes from hBcl-2Tg mice were injected into the thymus of B6 (n = 7) or γccKOTGFβR1cKO (n = 4) congenic hosts. Depicted are frequencies of Foxp3+CD25+ thymocytes developed from donor Foxp3-CD25+ thymocytes from 3 independent experiments. f, IL-2 protein in the serum. N = 3 per strain, representative of 2 independent experiments. g, Foxp3-CD25+ thymocytes from hBcl-2Tg mice were injected into the thymus of B6 (n = 7) or CD25KO (n = 6) congenic hosts. Donor origin cells were analyzed. Dots represent individual host mice from 3 independent experiments. h, Foxp3-CD25+ thymocytes from hBcl-2TgFoxocDKO mice were injected into the thymus of B6 (n = 4) or CD25KO congenic hosts that had received either Rat IgG (n = 3) or α-IL-2 (n = 3) antibodies. Frequency of donor origin Foxp3+CD25+ mature Tregs determined. Dots represent individual host mice from two experiments. i, CD69 expression on donor cells before and after intra-thymic injection. j, Schematic of two thymic Treg differentiation pathways. The primary developmental pathway is Foxo/TGFβ dependent, whereas the alternative developmental pathway is Foxo/TGFβ independent and requires excess IL-2. Two-tailed unpaired t-test, mean ± SEM (a, b, c, d, e, f, g and h).
Extended Data Fig. 6
Extended Data Fig. 6. IL-2+ Teff cell generation.
a, Characterization of Socs-/- mice. Summary of flow cytometry analysis of CD4SP thymocytes from the indicated strains. Dots represent individual mice. b, A schematic representation of the IL-2 fate-mapping mouse line. Design of IL2-GFP-Cre BAC transgenic mice are provided in Experimental Procedures. IL-2PE, IL-2 promoter/enhancer. c and d, Flow cytometric analyses of thymocytes and spleen cells from IL-2 reporter (IL-2-tdTomato) mice. Representative of more than 3 independent experiments. e and f, IL-2+ cells among CD4+ T cells. g, Frequency of IL-2+ cells among CD4SP thymocytes from the indicated mice. Dots represent individual mice. Two-tailed unpaired t-test, mean ± SEM (a and g).
Extended Data Fig. 7
Extended Data Fig. 7. Differentiation of Foxp3+ Tregs and IL-2+ Teffs in the thymus.
a, Immunohistochemical assessment of thymic sections from Foxp3-GFP/IL-2.tdTomato double-reporter mice (n = 3). UEA1, ulex europaeus agglutinin-1, labels medullar thymic epithelial cells (mTECs). Depicted representative of 3 independent experiments. b, Schematic of autoreactive thymocyte differentiation into Foxp3+ Tregs and IL-2+ Teffs. c, Purified conventional (Foxp3-IL-2-) stage 5 CD4SP thymocytes from double-reporter (Foxp3-GFP/IL-2.tdTomato) mice were stimulated with different doses of anti-TCR alone or together with different doses of rTGFβ. Surface CD69 and CCR7 were analyzed after 48 h. d, Surface CD69 and CCR7 expression on Foxp3+ Tregs and IL-2+ Teffs generated in c were analyzed. Representative of more than 5 independent experiments.
Extended Data Fig. 8
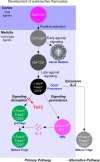
Schematic illustration of autoreactive thymocyte development in the normal thymus.

References

    1. Singer A, Adoro S, Park JH. Lineage fate and intense debate: myths, models and mechanisms of CD4- versus CD8-lineage choice. Nat. Rev. Immunol. 2008;8:788–801. doi: 10.1038/nri2416. - DOI - PMC - PubMed
    1. Punt JA, Osborne BA, Takahama Y, Sharrow SO, Singer A. Negative selection of CD4+CD8+ thymocytes by T cell receptor-induced apoptosis requires a costimulatory signal that can be provided by CD28. J. Exp. Med. 1994;179:709–713. doi: 10.1084/jem.179.2.709. - DOI - PMC - PubMed
    1. Stritesky GL, Jameson SC, Hogquist KA. Selection of self-reactive T cells in the thymus. Annu. Rev. Immunol. 2012;30:95–114. doi: 10.1146/annurev-immunol-020711-075035. - DOI - PMC - PubMed
    1. Takahama Y. Journey through the thymus: stromal guides for T-cell development and selection. Nat. Rev. Immunol. 2006;6:127–135. doi: 10.1038/nri1781. - DOI - PubMed
    1. Hemmers S, et al. IL-2 production by self-reactive CD4 thymocytes scales regulatory T cell generation in the thymus. J. Exp. Med. 2019;216:2466–2478. doi: 10.1084/jem.20190993. - DOI - PMC - PubMed

Publication types

MeSH terms

Substances