. 2023 Jun;7(6):970-985.
doi: 10.1038/s41562-023-01548-2. Epub 2023 Mar 23.

Neurons in human pre-supplementary motor area encode key computations for value-based choice

Affiliations

Neurons in human pre-supplementary motor area encode key computations for value-based choice

Tomas G Aquino et al. Nat Hum Behav. 2023 Jun.

Abstract

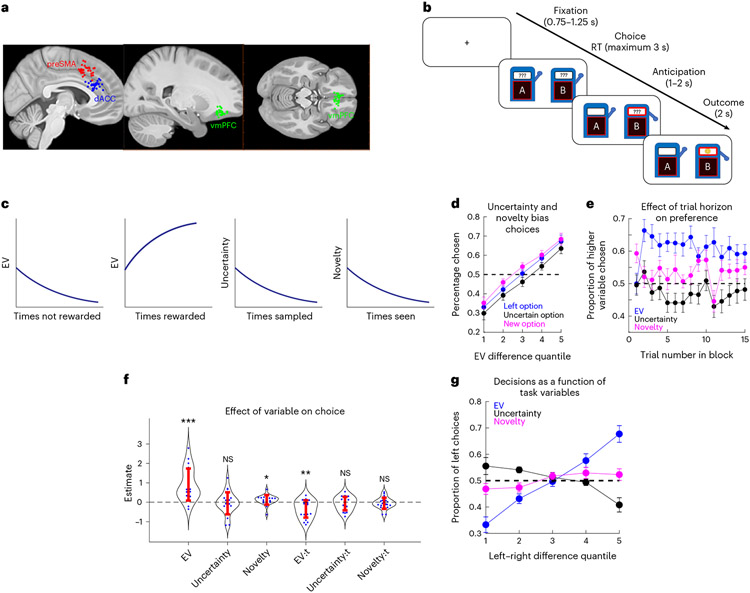
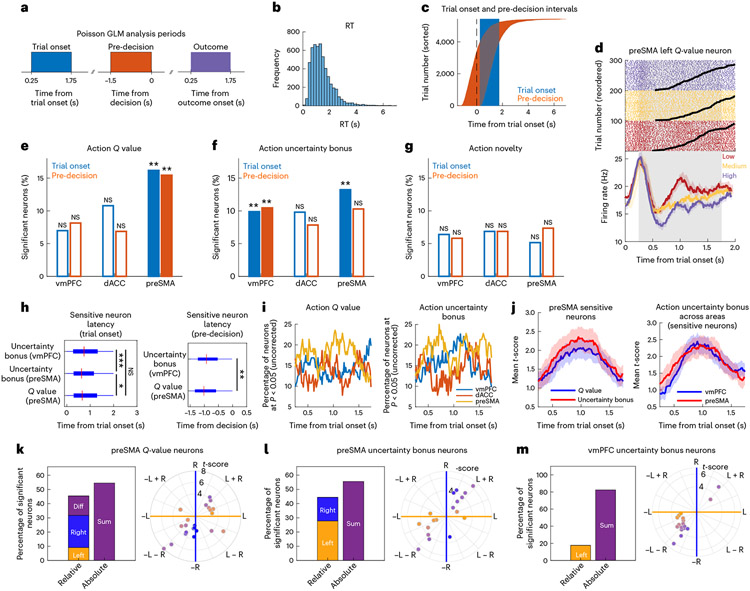
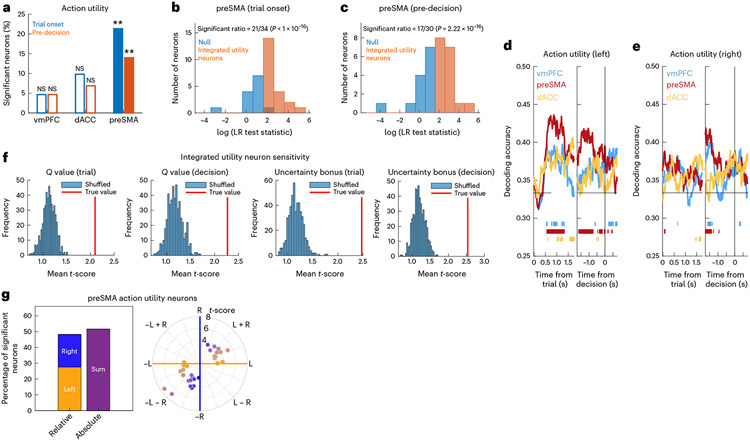
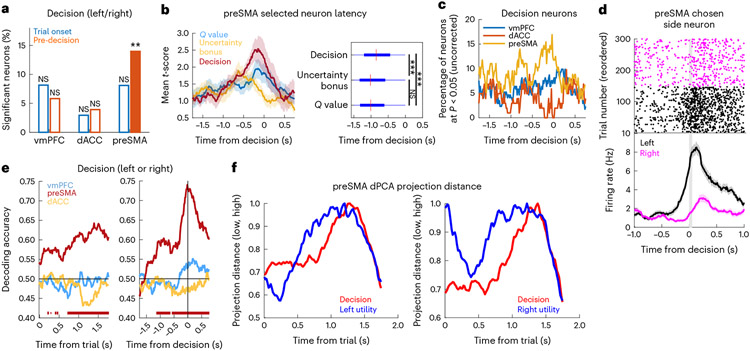
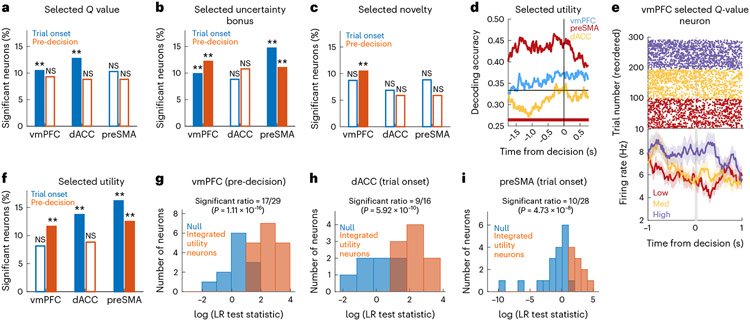
Adaptive behaviour in real-world environments requires that choices integrate several variables, including the novelty of the options under consideration, their expected value and uncertainty in value estimation. Here, to probe how integration over decision variables occurs during decision-making, we recorded neurons from the human pre-supplementary motor area (preSMA), ventromedial prefrontal cortex and dorsal anterior cingulate. Unlike the other areas, preSMA neurons not only represented separate pre-decision variables for each choice option but also encoded an integrated utility signal for each choice option and, subsequently, the decision itself. Post-decision encoding of variables for the chosen option was more widely distributed and especially prominent in the ventromedial prefrontal cortex. Our findings position the human preSMA as central to the implementation of value-based decisions.


Figures

Fig. 1 ∣
Fig. 1 ∣. Electrode positions, exploration task and behaviour.
a, Electrode positioning. Each dot indicates the location of a microwire bundle in the preSMA (red), dACC (blue) or vmPFC (green). b, Trials were structured according to fixation, decision, anticipation and feedback stages. In the actual task, slot machines were distinguished by artistic paintings displayed in front of them, represented in this figure by distinct letter labels. c, Schematic indicating how Q values, uncertainty and novelty of stimuli vary as a function of the past history of rewards, choices (‘sampled’) and exposures. d,e, Behaviour. d, EV correlates with choice, biased by novelty and uncertainty. Patients chose the left option (blue), the more uncertain option (black) or the newer option (magenta) as a function of chosen minus unchosen EV. n = 22 sessions. e, Proportion of trials in which patients chose the option with higher EV (blue), uncertainty (black) or novelty (magenta), as a function of trial number. The dots and bars indicate the mean and s.e.m., respectively. n = 22 sessions. f, Logistic regression coefficients for EV (P < 0.001), uncertainty (P = 0.639), novelty (P = 0.034) and interactions with trial number (EV:t, P = 0.001; uncertainty:t, P = 0.352; novelty:t, P = 0.369). The dots and bars indicate the fits for each patient and s.e.m., respectively (*P < 0.05; **P < 0.01; ***P < 0.001, two-sided t-test). Positive values indicate seeking behaviour. g, Decision as a function of task variables. The lines indicate the proportion of left choices as a function of the difference in the variable of interest between left and right stimuli (EV: blue; uncertainty: black; novelty: magenta). All error bars indicate the s.e.m.
Fig. 2 ∣
Fig. 2 ∣. Encoding of action utility components in the preSMA and vmPFC.
a, Time windows used for all analyses (trial onset, pre-decision and outcome). b, Reaction times in all trials. c, Relationship between trial onset and pre-decision periods across all trials, relative to trial onset, reordering trials by reaction time. d, Example left Q-value preSMA neuron. Top, spike raster plots. The black lines indicate RT. Trials sorted by Q-value tertile (purple: high; yellow: medium; red: low). Bottom, peristimulus time histogram (PSTH) (bin size = 0.2 s, step size = 0.0625 s). Data are presented as mean values ± s.e.m. e, Percentage of neurons sensitive to action Q value in the trial onset (blue, preSMA: P = 0.002) and pre-decision (orange, preSMA: P = 0.002) periods (**P < 0.01, one-sided permutation test). The unfilled bars indicate non-significant counts. f, Same but for action uncertainty (vmPFC, trial onset: P = 0.002; vmPFC, pre-decision: P = 0.004; preSMA, trial onset: P = 0.002). g, Same but for action novelty. h, Box plots of latency time across trials for sensitive neurons at trial onset (left) or pre-decision (right) (*P < 0.05; **P < 0.01; ***P < 0.001, two-sided Wilcoxon rank-sum test). P values as follows: P < 0.001 for preSMA versus vmPFC uncertainty bonus; P = 0.036 for Q value versus uncertainty bonus in preSMA. The red mark indicates the median and the box extends between the 25th and 75th centiles of latency times. The bar whiskers extend to the most extreme data points not labelled as outliers, defined as values that are more than 1.5 times the interquartile length away from the edges of the box. i, Significant neuron percentages (uncorrected) for action Q value or uncertainty bonus in vmPFC (blue), dACC (orange) or preSMA (yellow). j, Timing in sensitive neurons of absolute t-score from the Poisson GLM. Left, Q values (blue) versus uncertainty bonus (red) in the preSMA. n = 22 Q-value neurons, n = 18 uncertainty bonus neurons. Right, uncertainty bonus in vmPFC (blue) versus preSMA (red). n = 18 preSMA neurons, n = 17 vmPFC neurons. k, Left versus right coding in sensitive preSMA Q-value neurons. Left, percentage of neurons coding left and right, difference or sum values. Right, polar plot for left (yellow), right (blue) and mixed (purple) Q-value coding. The radial lines indicate the separation used for neuron classification as right, left, sum or difference. The hues indicate the degree of left (yellow), right (blue) or mixed (purple) coding. l, Same but for preSMA uncertainty bonus neurons. m, Same but for vmPFC uncertainty bonus neurons.
Fig. 3 ∣
Fig. 3 ∣. Neurons in the preSMA encode integrated utility.
a, Percentage of action utility neurons in the vmPFC, dACC and preSMA at the trial onset (blue, preSMA: P = 0.002) and pre-decision (orange, preSMA: P = 0.002) periods (**P < 0.01, one-sided permutation test). The unfilled bars indicate non-significant counts. b, LR test statistics across candidate preSMA integrated action utility neurons at the trial onset period. Neurons whose activity was better explained by a model containing Q values and uncertainty bonuses were classified as integrated utility neurons (orange). For the remaining neurons (blue), the null model restricted to Q values was not rejected. c, Same but for the pre-decision period. d, dPCA population decoding performance for the left action utility for the vmPFC (blue), preSMA (red) and dACC (yellow). The bars indicate periods of time where decoding accuracy was significantly above chance. The horizontal line indicates chance. Left, trial onset period. Right, pre-decision period. e, Same but for the right action utility. f, Integrated utility preSMA neuron sensitivity to Q values. The red lines indicate the mean absolute t-score across integrated utility neurons. The histograms include the mean absolute t-scores for 500 iterations of bootstrapped null models with shuffled firing rates. Tested variables (from left to right): Q value (trial onset); Q value (decision); uncertainty bonus (trial); uncertainty bonus (decision). g, Left versus right coding in sensitive preSMA action utility neurons. Left, percentage of neurons coding left, right or sum values. Right, polar plot for left (yellow), right (blue) and mixed (purple) Q-value coding. The colours indicate the degree of left (yellow), right (blue) or mixed (purple) coding. The radial lines indicate the separation used for neuron classification as right, left, sum or difference.
Fig. 4 ∣
Fig. 4 ∣. The PreSMA encodes decisions.
a, Percentage of decision neurons (left versus right choice) in the vmPFC, dACC and preSMA at the trial onset (blue) and pre-decision (orange, preSMA: P = 0.002) periods (**P < 0.01, one-sided permutation test). The unfilled bars indicate non-significant counts. b, Sensitive preSMA neuron timing during the pre-decision period. Left, mean absolute t-score for the Q value (blue, n = 21 neurons), uncertainty bonus (yellow, n = 14 neurons) and decision (red, n = 19 neurons). The shaded areas indicate the s.e.m. Right, latency time box plots for all Q-value, uncertainty bonus or decision neurons (***P < 0.001, two-sided Wilcoxon rank-sum test). P values are as follows: P < 0.001 for decision versus uncertainty bonus; P < 0.001 for decision versus Q. The red mark indicates the median and the box extends between the 25th and 75th centiles of latency times. The bar whiskers extend to the most extreme data points not labelled as outliers, defined as values that are more than 1.5 times the interquartile length away from the edges of the box. c, Percentage of significant decision neurons in the vmPFC (blue), dACC (orange) or preSMA (yellow). d, Example preSMA decision neuron. Top, raster plot. For plotting, we sorted trials into left (black) and right (magenta) decisions. Bottom, PSTH (bin size = 0.2 s, step size = 0.0625 s). The grey bar indicates the button press. Data are presented as mean values ± s.e.m. e, dPCA decision decoding for vmPFC (blue), preSMA (red) and dACC (yellow). The bars indicate significant times compared to a bootstrapped null distribution. The horizontal line indicates chance. Left, trial onset period. Right, pre-decision period. f, Normalized Euclidean distance between dPCA projections onto principal utility components (blue), between low- and high-utility trials and decision components (red) and between left and right decision trials, with left (left) or right (right) utility marginalizations.
Fig. 5 ∣
Fig. 5 ∣. Encoding selected stimulus properties.
a, Percentage of selected Q-value neurons in the vmPFC, dACC and preSMA at the trial onset (blue, P = 0.002 for the vmPFC and dACC) and pre-decision (orange) periods (**P < 0.01, one-sided permutation test). The unfilled bars indicate non-sensitive counts. b, Same but for selected uncertainty. P = 0.002 for the vmPFC and preSMA, both periods. c, Same but for selected novelty. P = 0.002 for the preSMA, pre-decision. d, dPCA selected utility decoding in the pre-decision period for the vmPFC (blue), preSMA (red) and dACC (yellow). The bars indicate significant decoding accuracies for each brain region, compared to a bootstrapped null distribution. e, Example selected Q-value neuron in the vmPFC. Top, raster plots. For plotting, we sorted trials by Q-value tertiles (purple: high; yellow: medium; red: low). Bottom, PSTH (bin size = 0.2 s, step size = 0.0625 s). The grey bar indicates the button press. Data are presented as mean values ± s.e.m. f, Same as in a but for selected utility. P = 0.002 for vmPFC, pre-decision, dACC, trial onset and preSMA, both periods. g, Histogram of LR test statistics across candidate vmPFC integrated selected utility neurons (orange) in the pre-decision period. For the remaining neurons (blue), a null model containing only selected Q values was not rejected. h, Same as in g but for dACC. i, Same as in g but for the preSMA.

References

    1. Sutton RS & Barto AG Reinforcement Learning: an Introduction (MIT Press, 2018).
    1. Payzan-LeNestour E & Bossaerts P Risk, unexpected uncertainty, and estimation uncertainty: Bayesian learning in unstable settings. PLoS Comput. Biol 7, e1001048 (2011). - PMC - PubMed
    1. Payzan-LeNestour E & Bossaerts P Do not bet on the unknown versus try to find out more: estimation uncertainty and ‘unexpected uncertainty’ both modulate exploration. Front. Neurosci 6, 150 (2012). - PMC - PubMed
    1. Gershman SJ Deconstructing the human algorithms for exploration. Cognition 173, 34–42 (2018). - PMC - PubMed
    1. Wittmann BC, Daw ND, Seymour B & Dolan RJ Striatal activity underlies novelty-based choice in humans. Neuron 58, 967–973 (2008). - PMC - PubMed

Publication types