. 2023 Dec;41(12):1776-1786.
doi: 10.1038/s41587-023-01714-x. Epub 2023 Mar 23.

Global detection of human variants and isoforms by deep proteome sequencing

Affiliations

Global detection of human variants and isoforms by deep proteome sequencing

Pavel Sinitcyn et al. Nat Biotechnol. 2023 Dec.

Abstract

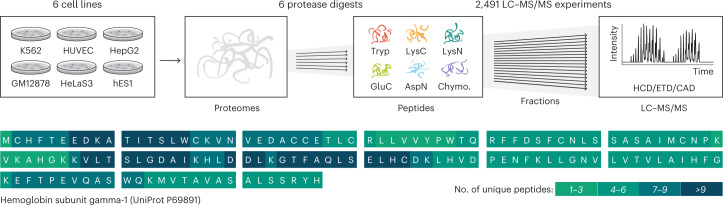
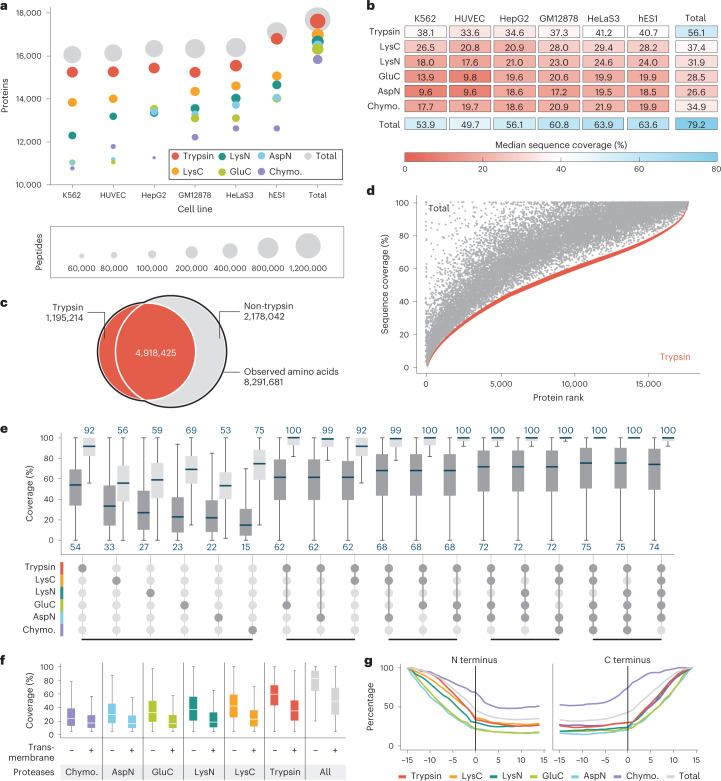
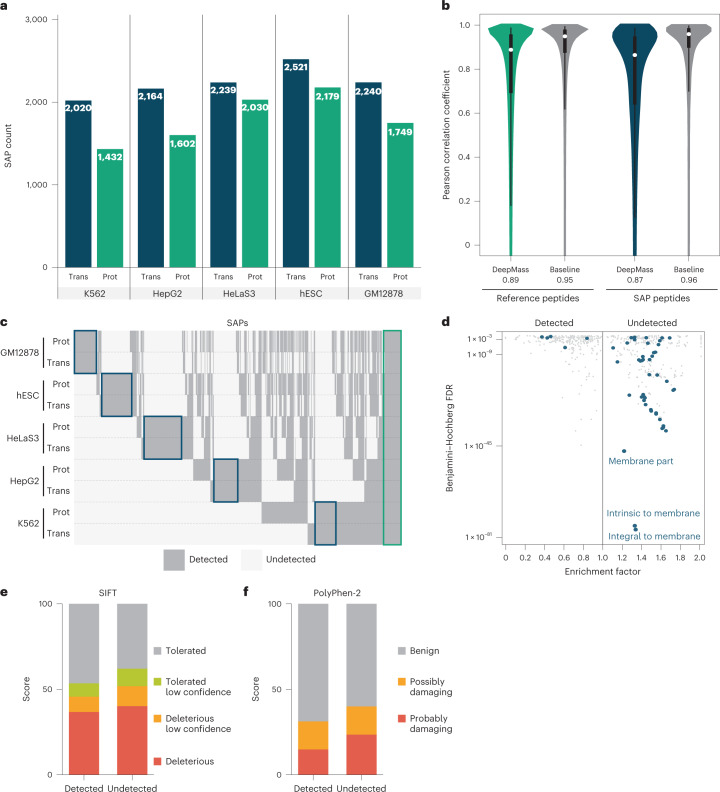
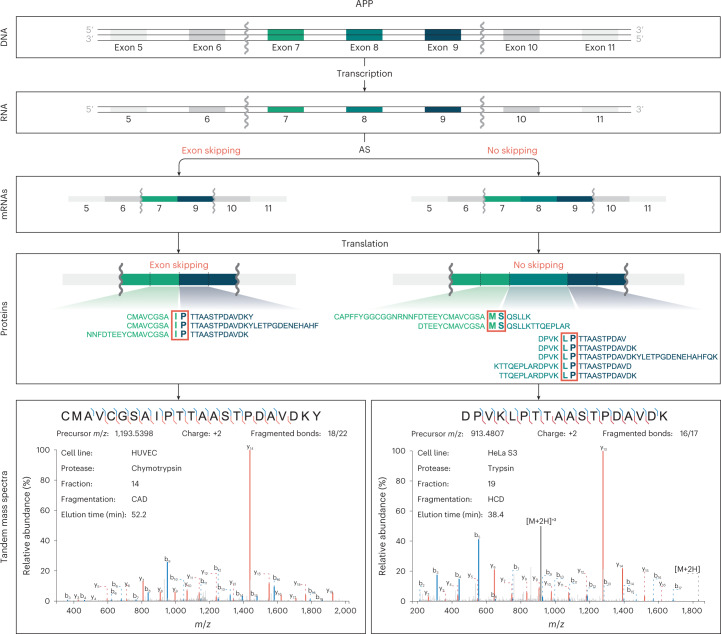
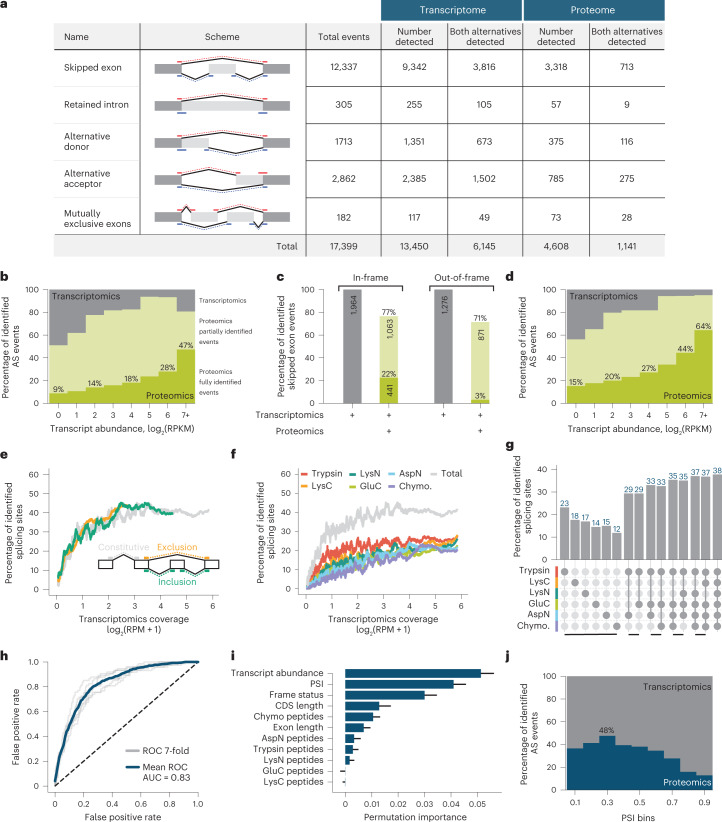
An average shotgun proteomics experiment detects approximately 10,000 human proteins from a single sample. However, individual proteins are typically identified by peptide sequences representing a small fraction of their total amino acids. Hence, an average shotgun experiment fails to distinguish different protein variants and isoforms. Deeper proteome sequencing is therefore required for the global discovery of protein isoforms. Using six different human cell lines, six proteases, deep fractionation and three tandem mass spectrometry fragmentation methods, we identify a million unique peptides from 17,717 protein groups, with a median sequence coverage of approximately 80%. Direct comparison with RNA expression data provides evidence for the translation of most nonsynonymous variants. We have also hypothesized that undetected variants likely arise from mutation-induced protein instability. We further observe comparable detection rates for exon-exon junction peptides representing constitutive and alternative splicing events. Our dataset represents a resource for proteoform discovery and provides direct evidence that most frame-preserving alternatively spliced isoforms are translated.


Conflict of interest statement

J.J.C. is a consultant for Thermo Fisher Scientific, 908 Devices, and Seer. The other authors declare no competing interests.

Figures

Fig. 1
Fig. 1. Deep proteome sequencing workflow.
Six human cell lines were grown in parallel, their proteomes were isolated and then one of the six proteases was used to digest separate aliquots of each proteome in parallel. Peptides resulting from each digestion were fractionated by high-pH RP chromatography and then analyzed separately with nLC–MS/MS using HCD, ETD and CAD. The resulting data were searched with MaxQuant, against the human proteome database, and over 17,000 proteins were identified by peptides that produce a median coverage of over 80%. The high coverage achieved is illustrated on the sequence of hemoglobin subunit gamma-1, with color coding to illustrate the number of unique peptides that cover each amino acid position.
Fig. 2
Fig. 2. Overview of results from deep proteomics analysis.
a, Number of proteins detected for each of the six cell lines and cumulative as a function of peptides from the various protease digests. b, Median sequence coverage of various cell line proteomes achieved by digests with individual proteases and by combining all protease results. Supplementary Fig. 2c shows sequence coverage distributions separately for all combinations of cell lines, proteases and fragmentation methods. c, Venn diagram of all observed amino acids digested by trypsin versus all proteases combined excluding trypsin. d, Sequence coverage for each of the detected proteins for the tryptic peptide data (red) and combined protease digests, including trypsin (gray). e, Observed (dark gray) and theoretical (light gray) distributions of sequence coverage achieved for various combinations of proteases. The top three combinations of 2, 3, 4 or 5 proteases are displayed. f, Protein coverage comparison of transmembrane and nonmembrane proteins. For e and f, the lower whisker/quartile and upper quartile/whisker show the 5th, 25th, 75th and 95th percentiles, accordingly. g, Relative protein coverage of N terminus (left) and C terminus (right) transmembrane segments. Chymo., chymotrypsin.
Fig. 3
Fig. 3. Discovery of proteins with SAPs.
a, Comparison of SAPs discovered in the ENCODE transcriptomic data (Trans) and presented proteomics data (Prot) for each of the cell lines. b, Distribution of correlation coefficients between observed and predicted by DeepMass spectra. The baseline distribution shows acquisition-to-acquisition variation by comparing observed spectra for peptides. The white circle shows the median value. The lower and upper quartiles of the box demonstrate the 25th and 75th percentiles, accordingly. The lower and upper whiskers show the 5th and 95th percentiles, accordingly. The distributions are based on 5,128,969, 442,476, 16,516 and 4,969 comparisons (from left to right). c, Clustered binary heatmap of the detected SAPs row-grouped by cell line and omics platform (transcriptomics or proteomics). Blue rectangles highlight clusters specific to each cell line, and the green rectangle SAPs that are conserved across all cell lines. d, Gene ontology (GO) enrichment of genes with SAPs detected or undetected by MS. Genes with a mixed population of SAPs were removed, and repeats collapsed. Blue dots highlight GO terms with the word ‘membrane’ mentioned in the name. e. SIFT-generated score distribution over four categories for detected and undetected SAPs. Applying the two-sided Wilcoxon rank sum test on the raw scores results in P value of 2 × 10−8. f, The same as e, but for the PolyPhen-2 (ref. ) tool. Applying the two-sided Wilcoxon rank sum test on the raw scores results in P value of 1.1 × 10−12.
Fig. 4
Fig. 4. Example of proteomics data corroborating occurrence of an alternative splicing (AS) event in APP.
The initial sequential order of exons undergoes transcription. Splicing processing follows, resulting in either 7–9 or 7–8–9 exon combinations. Since all mentioned exons are part of APP’s open reading frame, they have a theoretical possibility to be present and translated into a protein sequence. The multi-enzyme shotgun MS approach described here allows detection of peptides specific to each isoform. Two of 42 total spectra, corroborating these splicing events, are shown.
Fig. 5
Fig. 5. Properties of detected exon skipping AS events.
a, Summary table of annotated, detected by transcriptomics and proteomics splicing events. AS events are further subdivided into groups with expression evidence for at least one or both alternatives. b, Proteomics detection rate of exon skipping AS events as a function of expression. Each gene is grouped by expression level as obtained from RNA-seq data. c, Proportions of detected AS events with in-frame or out-of-frame properties. For in-frame AS events, the length of included exon is divisible by 3. It is not the case for out-of-frame AS events which hence result in a frameshift. d, The same analysis as in b but performed based on frame-preserving isoform events only. e, Percentage of MS-identified splicing sites as a function of transcriptional coverage (reads per million, RPM). Three groups of splicing sites are displayed—constitutive (present in all isoforms of a specific gene), exclusion and inclusion splice sites. For more information, see Supplementary Fig. 8. f, The same as e, but by individual proteases used in this study or all combined (Total). g, Splice junction proteomic coverage achieved over all protease combinations. The top two combinations are displayed for 2–5 proteases. Only splice junctions with transcriptomics coverage of more than 1 RPM are included in this analysis. h, ROC curve of a binary XGBoost classifier trained to predict whether AS events are detected or not detected on the proteomics level. i, Features ranked by their importance for the XGBoost classifier. The bars and whiskers demonstrate mean and 1 s.d. accordingly. The visualized values were calculated over 100 random shuffles for each parameter. j, Proteomics detection rate as a function of percent spliced-in (PSI) value defined by RNA-seq data. AUC, area under the curve.

References

    1. Richards AL, et al. One-hour proteome analysis in yeast. Nat. Protoc. 2015;10:701–714. - PMC - PubMed
    1. Hebert AS, et al. The one hour yeast proteome. Mol. Cell. Proteomics. 2014;13:339–347. - PMC - PubMed
    1. Gholami AM, et al. Global proteome analysis of the NCI-60 cell line panel. Cell Rep. 2013;4:609–620. - PubMed
    1. Kelstrup CD, et al. Performance evaluation of the Q Exactive HF-X for shotgun proteomics. J. Proteome Res. 2018;17:727–738. - PubMed
    1. Kim MS, et al. A draft map of the human proteome. Nature. 2014;509:575–581. - PMC - PubMed

Publication types