Multicenter Study
. 2023 Apr;29(4):828-832.
doi: 10.1038/s41591-023-02252-4. Epub 2023 Mar 23.

Artificial-intelligence-based molecular classification of diffuse gliomas using rapid, label-free optical imaging

Affiliations
Multicenter Study

Artificial-intelligence-based molecular classification of diffuse gliomas using rapid, label-free optical imaging

Todd Hollon et al. Nat Med. 2023 Apr.

Abstract

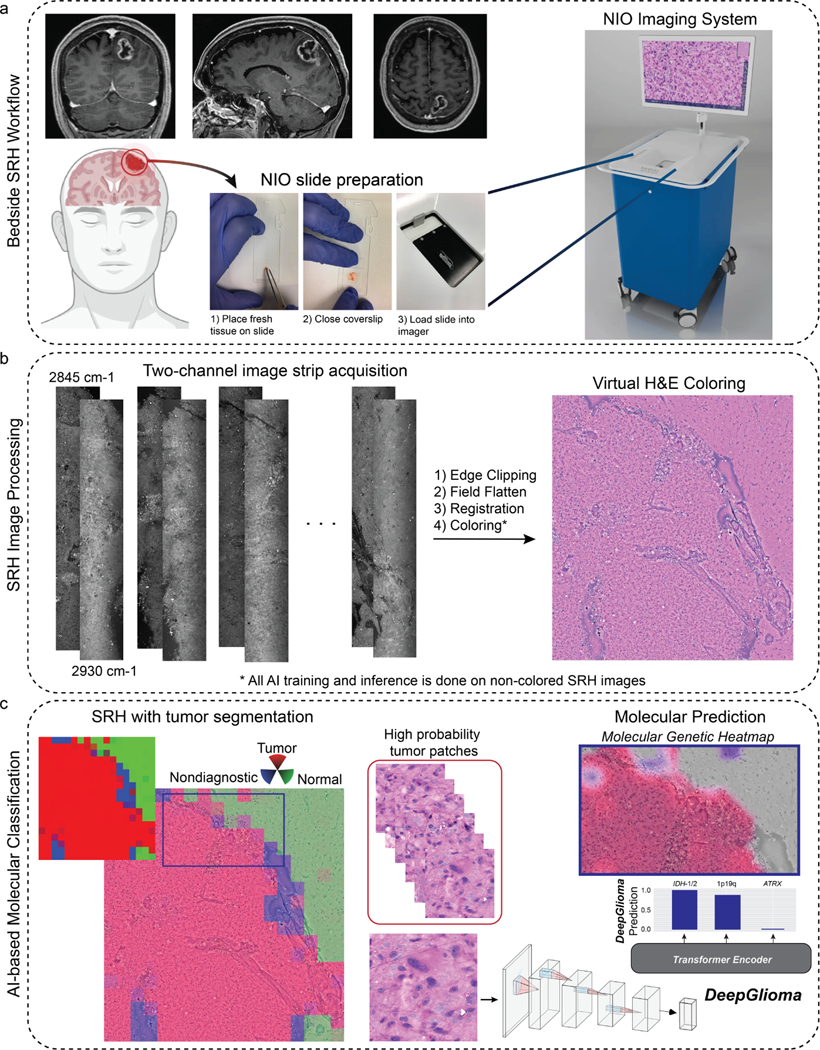
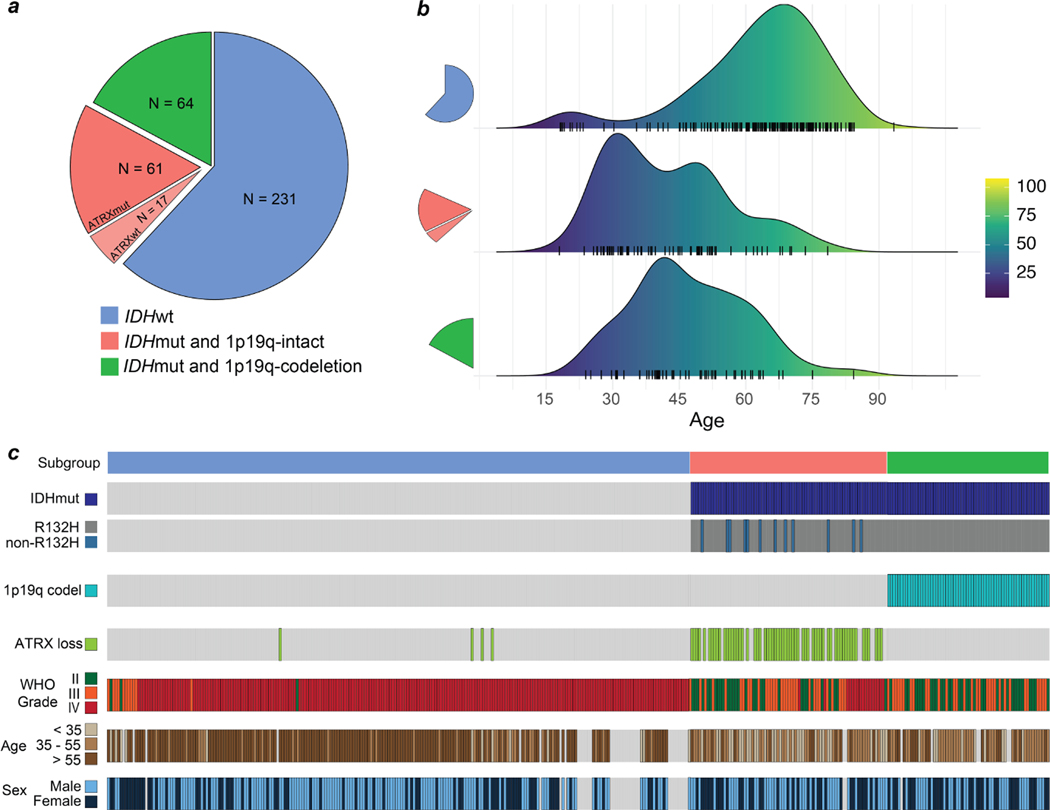
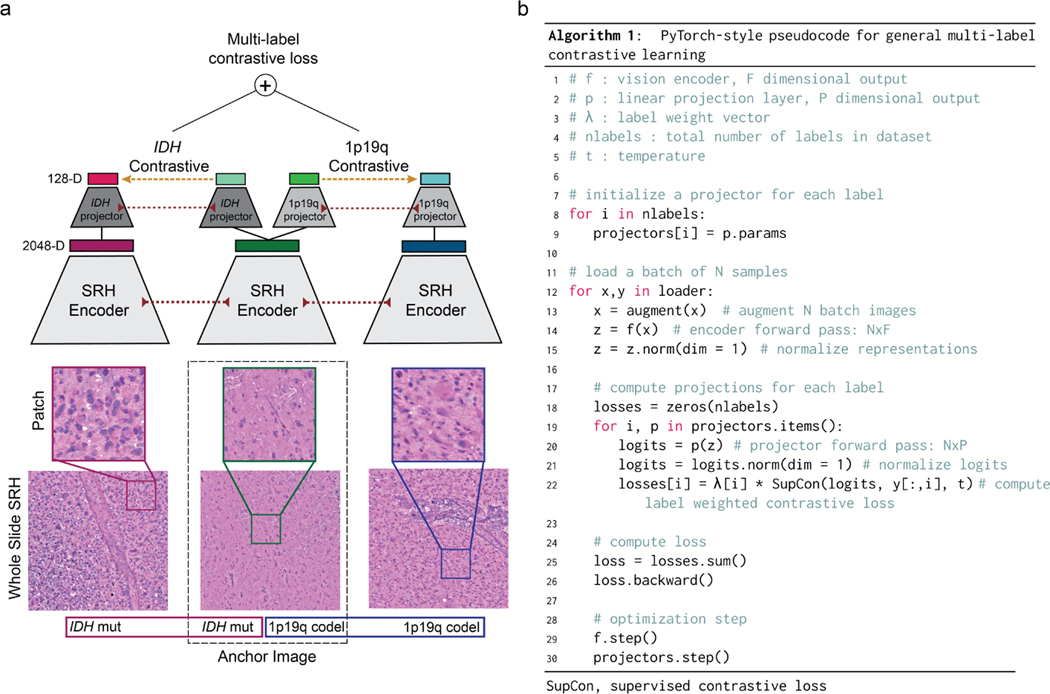
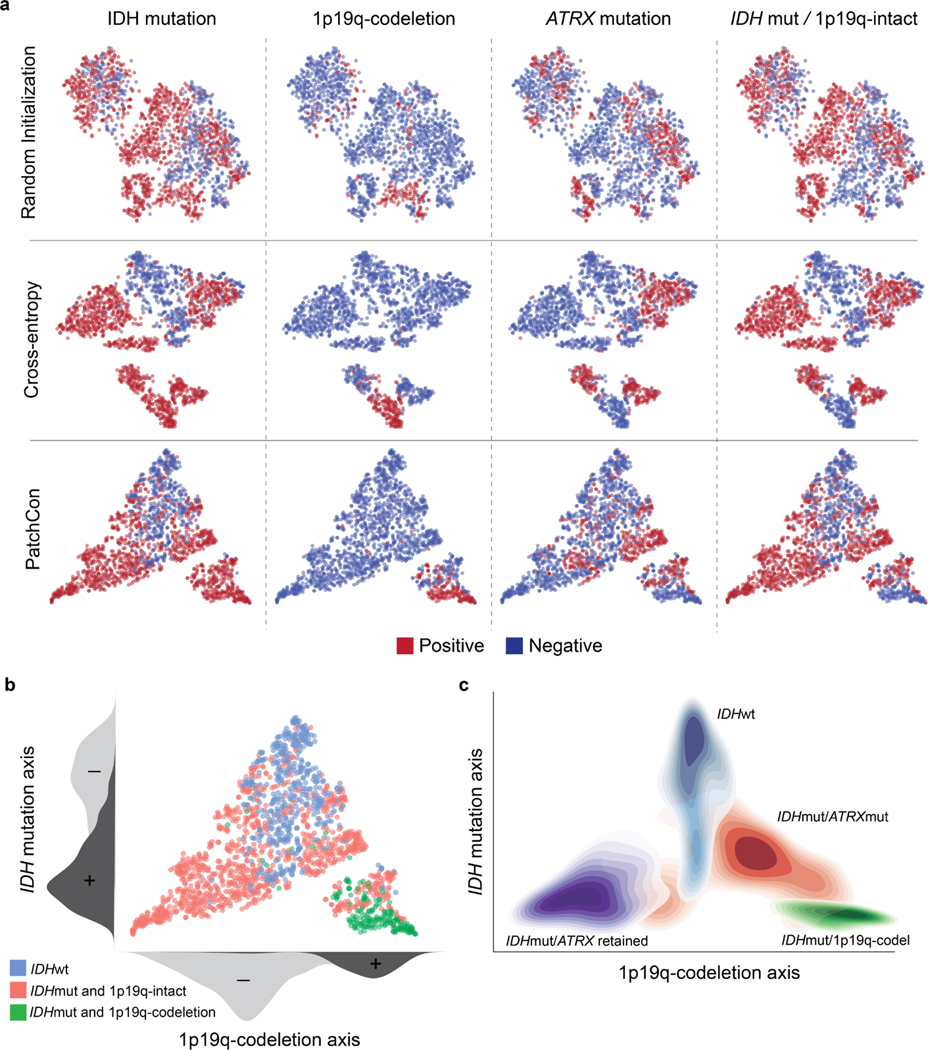
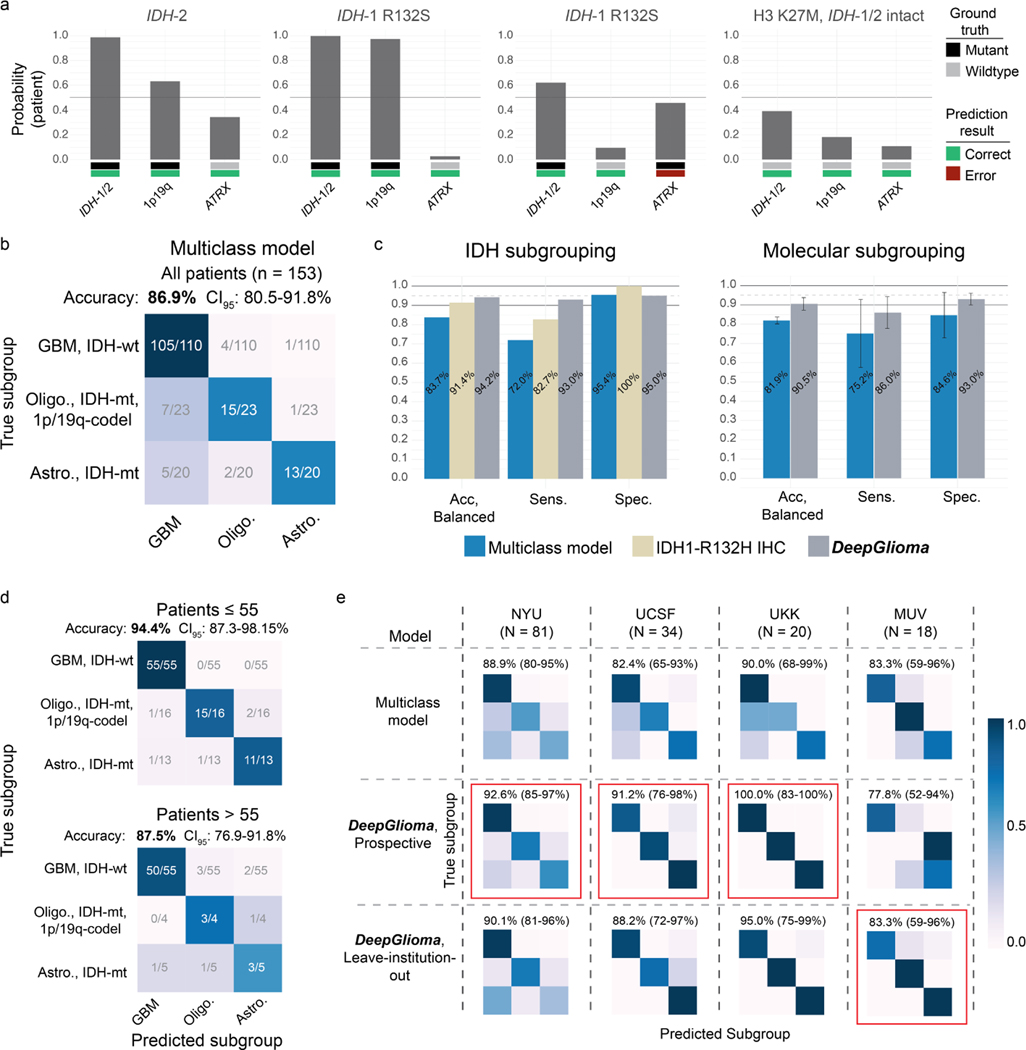
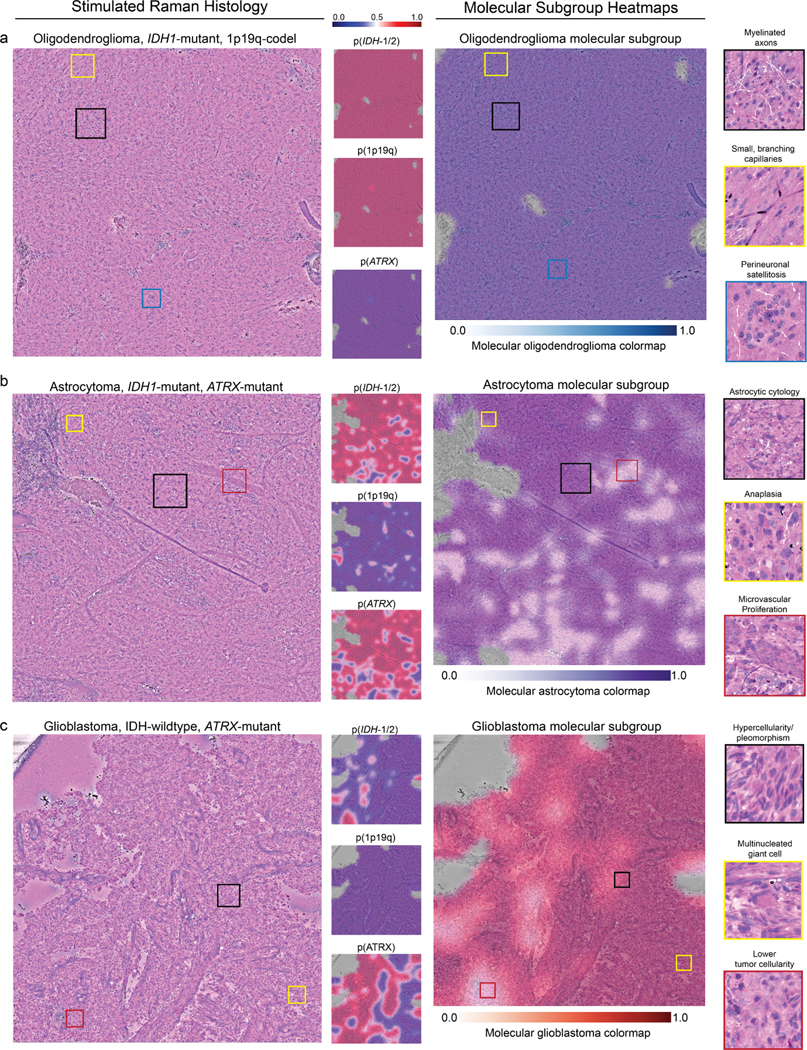
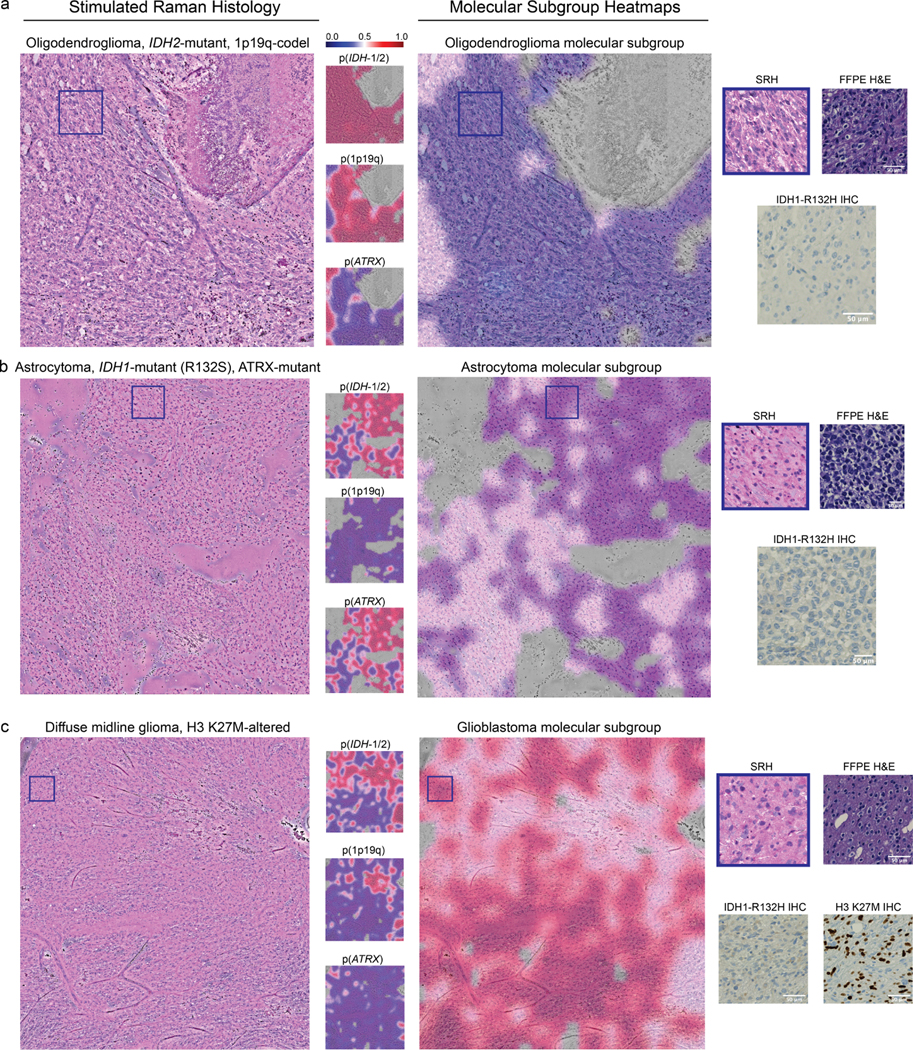
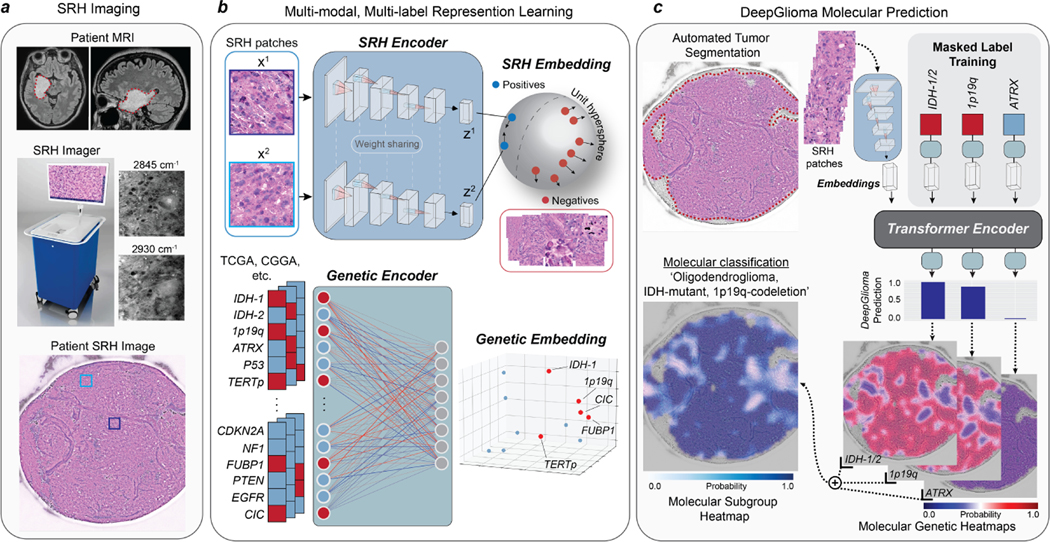
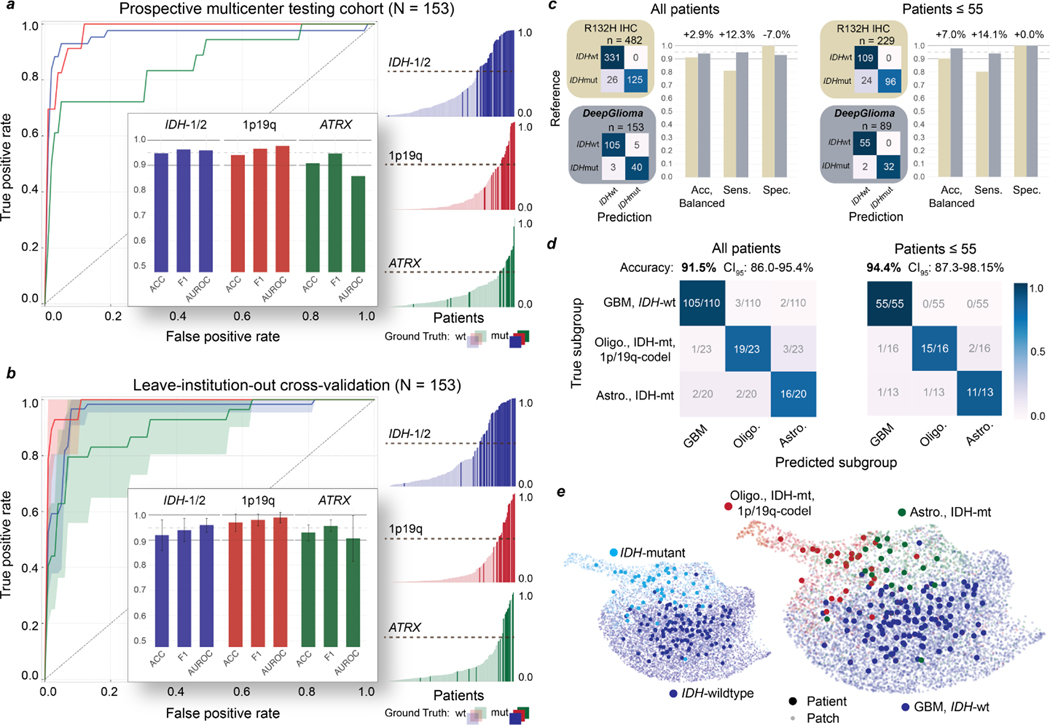
Molecular classification has transformed the management of brain tumors by enabling more accurate prognostication and personalized treatment. However, timely molecular diagnostic testing for patients with brain tumors is limited, complicating surgical and adjuvant treatment and obstructing clinical trial enrollment. In this study, we developed DeepGlioma, a rapid (<90 seconds), artificial-intelligence-based diagnostic screening system to streamline the molecular diagnosis of diffuse gliomas. DeepGlioma is trained using a multimodal dataset that includes stimulated Raman histology (SRH); a rapid, label-free, non-consumptive, optical imaging method; and large-scale, public genomic data. In a prospective, multicenter, international testing cohort of patients with diffuse glioma (n = 153) who underwent real-time SRH imaging, we demonstrate that DeepGlioma can predict the molecular alterations used by the World Health Organization to define the adult-type diffuse glioma taxonomy (IDH mutation, 1p19q co-deletion and ATRX mutation), achieving a mean molecular classification accuracy of 93.3 ± 1.6%. Our results represent how artificial intelligence and optical histology can be used to provide a rapid and scalable adjunct to wet lab methods for the molecular screening of patients with diffuse glioma.


Figures

Extended Data Fig 1.
Extended Data Fig 1.. Overall workflow of intraoperative SRH and DeepGlioma
a, DeepGlioma for molecular prediction is intended for adult (≥ 18 years) patients with clinical and radiographic evidence of a diffuse glioma who are undergoing surgery for tissue diagnosis and/or tumor resection. The surgical specimen is sampled from the patient’s tumor and directly loaded into a premade, disposable microscope slide with attached coverslip. The specimen is loaded into the NIO Imaging System (Invenio Imaging, Inc., Santa Clara, CA) for rapid optical imaging. b, SRH images are acquired sequentially as strips at two Raman shifts, 2845 cm−1 and 2930 cm−1. The size and number of strips to be acquired is set by the operator who defines the desired image size. Standard images sizes range from 1–5mm2 and image acquisition time ranges from 30 seconds to 3 minutes. The strips are edge clipped, field flattened, and registered to generate whole slide SRH images. These whole slide images are then used for both DeepGlioma training and inference. Additionally, whole slide images can be colored using a custom virtual H&E colorscheme for review by the surgeon or pathologist [6]. c, For AI-based molecular diagnosis, the whole slide image is split into non-overlapping 300×300 pixel patches and each patch undergoes a feedforward pass through a previously trained network to segment the patches into tumor regions, normal brain, and nondiagnostic regions [19]. The tumor patches are then used by DeepGlioma at both training and inference to predict the molecular status of the patient’s tumor.
Extended Data Fig 2.
Extended Data Fig 2.. Training dataset
The UM adult-type diffuse gliomas dataset used for model training. The UM training set consisted of a total of 373 patients who underwent a biopsy or brain tumor resection. Dataset generation occurred over a six-year period, starting in November 2015 and ended in November 2021. a, The distribution of patients by molecular subgroup is shown. IDH-wildtype gliomas consisted of 61.9% (231/373) of the total dataset. IDH-mutant/1p19q-codeleted tumors consisted of 17.2% (64/373) and IDH-mutant/1p19q-intact tumors consisted of 21.% (78/373) of tumors in the dataset. Our dataset distribution of molecular subgroups is consistent with reported distributions in large-scale population studies [56]. ATRX mutations were found in the majority of IDH-mutant/1p19q-intact patients (78%), also concordant with previous studies [10]. b, The age distribution for each of the molecular subgroups is shown. The average age of IDH-wildtype patients was 62.6 ± 15.4 and IDH-mutant patients was 44.6 ± 13.8. The average patient age of IDH-mutant/1p19q-codel group was 47.0 ± 12.9 and IDH-mutant/1p19-intact was 42.5 ± 14.1 years. c, Individualized patient characteristics and mutational status are shown by molecular subgroups. We report the WHO grade based on pathologic interpretation at the time of diagnosis. Because many of the patients were treated prior to the routine use of molecular status alone to determine WHO grade, several patients have IDH-wildtype lower grade gliomas (grade II or III) or IDH-mutant glioblastomas (grade IV). The discordance between histologic features and molecular features has been well documented[10] and is a major motivation for the present study.
Extended Data Fig 3.
Extended Data Fig 3.. Multi-label contrastive learning for visual representations
Contrastive learning for visual representation is an active area of research in computer vision [22, 57, 58]. While the majority of research has focused on self-supervised learning, supervised contrastive loss functions have been underexplored and provide several advantages over supervised cross-entropy losses [58, 59]. Unfortunately, no straightforward extension of existing contrastive loss functions, such as InfoNCE[60] and NT-Xent[61], can accommodate multi-label supervision. Here, we propose a simple and general extension of supervised contrastive learning for multi-label tasks and present the method in the context of patch-based image classification. a, Our multi-label contrastive learning framework starts with a randomly sampled anchor image with an associated set of labels. Within each minibatch a set of positive examples are defined for each label of the anchor image that shares the same label status. All images in the minibatch undergo a feedforward pass through the SRH encoder (red dotted lines indicate weight sharing). Each image representation vector (2048-D) is then passed through multiple label projectors (128-D) in order to compute a contrastive loss for each label (yellow dashed line). The scalar label-level contrastive loss is then summed and backpropagated through the projectors and image encoder. The multi-label contrastive loss is computed for all examples in each minibatch. b, PyTorch-style pseudocode for implementation of our proposed multi-label contrastive learning framework is shown. Note that this framework is general and can be applied to any multi-label classification task. We call our implementation patchcon because individual image patches are sampled from whole slide SRH images to compute the contrastive loss. Because we use a single projection layer for each label and the same image encoder is used for all images, the computational complexity is linear in the number of labels.
Extended Data Fig 4.
Extended Data Fig 4.. SRH visual representation learning comparison
a, SRH patch representations of a held-out validation set are plotted. Patch representations from a ResNet50 encoder randomly initialized (top row), trained with cross-entropy (middle row), and PatchCon (bottom row) are shown. Each column shows binary labels for the listed molecular diagnostic mutation or subgroup. A randomly initialized encoder shows evidence of clustering because patches sampled from the same patient are correlated and can have similar image features. Training with a cross-entropy loss does enforce separability between some of the labels; however, there is no discernible lowdimensional manifold that disentangles the label information. Our proposed multi-label contrastive loss produced embeddings that are more uniformly distributed in representation space than cross-entropy. Uniformity of the learned embedding distribution is known to be a desirable feature of contrastive representation learning [32]. b, Qualitative analysis of the SRH patch embeddings indicates that that data is distributed along two major axes that correspond to IDH mutational status and 1p19q-codeletion status. This distribution produces a simplex with the three major molecular subgroups at each of the vertices. These qualitative results are reproduced in our prospective testing cohort show in Figure 2e. c, The contour density plots for each of the major molecular subgroups are shown to summarize the overall embedding structure. IDH-wildtype images cluster at the apex and IDH-mutant tumors cluster at the base. Patients with 1p19q-intact are closer to the origin and 1p19q-codeleted tumors are further from the origin.
Extended Data Fig 5.
Extended Data Fig 5.. Diffuse glioma genetic embedding using global vectors
Embedding models transform discrete variables, such as words or gene mutational status, into continuous representations that populate a vector space such that location, direction, and distance are semantically meaningful. Our genetic embedding model was trained using data sourced from multiple public repositories of sequenced diffuse gliomas (Extended Data Table 2). We used a global vector embedding objective for training [28]. a, A subset of the most common mutations in diffuse gliomas is shown in the co-occurrence matrix. Data was collected from multiple public repositories and aggregated to generate a single co-occurrence matrix for global vector embedding training. b, The learned genetic embedding vector space with the 11 most commonly mutated genes shown. Both the mutant and wildtype mutational statuses (N=22) are included during training to encode the presence or absence of a mutation. Genes that co-occur in specific molecular subgroups cluster together within the vector space, such as mutations that occur in (c) IDH-mutant, 1p19q-codel oligodendrogliomas (green), (d) IDH-mutant, ATRX-mutant diffuse astrocytomas (blue), and (e) IDH-wildtype glioblastoma subtypes (red). Additionally, wildtype genes (black) form a single cluster with gene mutations organized in a radial pattern. Radial traversal of the embedding space defines clinically meaningful linear substructures [28] corresponding to molecular subgroups. f, Corresponding to the known clinical and prognostic significance of IDH mutations in diffuse gliomas, IDH mutational status determines the axis along which increasing malignancy is defined in our genetic embedding space.
Extended Data Fig 6.
Extended Data Fig 6.. PyTorch-style pseudocode for transformer-based masked multi-label classification
Inputs to our masked multi-label classification algorithm are listed in lines 1–5. The vision encoder and genetic encoder are pretrained in our implementation but can be randomly initialized and trained end-to-end. The label mask is an L-dimensional binary mask with a variable percentage of the labels removed and subsequently predicted in each feedforward pass. An image x is augmented and undergoes a feedforward pass through the vision encoder f. The image representation is then 2 normalized. The labels are embedded using our pretrained genetic embedding model and the label mask is applied. The label embeddings are then concatenated with the image embedding and passed into the transformer encoder as input tokens. Unlike previous transformer-based methods for multi-label classification [31], we enforce that the transformer encoder outputs into the same vector space as the pretrained genetic embedding model. We perform a batch matrix multiplication with the transformer outputs and the embedding layer weights. The main diagonal elements are the inner product between the transformer encoder output and the corresponding embedding weight values. We then compute the masked binary cross-entropy loss. In our implementation, this is used to train the transformer encoder model only.
Extended Data Fig 7.
Extended Data Fig 7.. Ablation studies and cross-validation results
We conducted three main ablation studies to evaluate the following model architectural design choices and major training strategies: (1) cross-entropy versus contrastive loss for visual representation learning, (2) linear versus transformer-based multi-label classification, and (3) fully-supervised versus masked label training. a, The first two ablation studies are shown in the panel and the details of the cross-validation experiments are explained in the Methods section (see ‘Ablation Studies‘). Firstly, a ResNet50 model was trained using either cross-entropy or PatchCon. The PatchCon trained image encoder was then fixed. A linear classifier and transformer classifier were then trained using the same patchcon image encoder in order to evaluate the performance boost from using a transformer encoder. This ablation study design allows us to evaluate (1) and (2). The columns of the panel correspond to the three levels of prediction for SRH image classification: patch-, slide-, and patient-level. Each model was trained three times on randomly sampled validation sets and the average (± standard deviation) ROC curves are shown for each model. Each row corresponds to the three molecular diagnostic mutations we aimed to predict using our DeepGlioma model. The results show that PatchCon outperforms cross-entropy for visual representation learning and that the transformer classifier outperforms the linear classifier multi-label classification. Note that the boost in performance of the transformer classifier over the linear model is due to the deep multi-headed attention mechanism learning conditional dependencies between labels in the context of specific SRH image features (i.e. not improved image feature learning due to fixed encoder weights). b, We then aimed to evaluate (3). Similar to the above, a single ResNet50 model was trained using PatchCon and the encoder weights were fixed for the following ablation study to isolate the contribution of masked label training. Three training regimes were tested and are presented in the table: no masking (0%), 33% masking (one label randomly masked), and 66% (two labels randomly masked). To better investigate the importance of masked label training, we report multiple multi-label classification metrics. We found that 33% masking, or randomly masking one of three diagnostic mutations, showed the best results across all metrics at the slide-level and patient-level. We hypothesize that this results from allowing a single mutation to weakly define the genetic context while allowing supervision from the two masked labels to backpropagate through the transformer encoder.
Extended Data Fig 8.
Extended Data Fig 8.. Patient subgroup analysis of DeepGlioma performance
a, Subset of patients from the prospective cohort with non-canonical IDH mutations and a diffuse midline glioma, H3 K27M mutation. DeepGlioma correctly classified all non-canonical IDH mutations, including IDH-2 mutation. Moreover, DeepGlioma generalized to a pediatric-type diffuse high-grade gliomas, including diffuse midline glioma, H3 K27-altered, in a zero-shot fashion as these tumor were not included in the UM training set. This patient was included in our prospective cohort because the patient was a 34 year old adult at presentation. b, Confusion matrix of our benchmark multiclass model trained using categorical cross-entropy. DeepGlioma outperformed the multiclass model by +4.6% in overall diagnostic accuracy with a substantial improvement in differentiating molecular astrocytomas and oligodendrogliomas. c, Direct comparison of subgrouping performance for our benchmark multiclass model, IDH1-R132H IHC, and DeepGlioma. Performance metrics values are displayed. Molecular subgrouping mean and standard deviations are plotted. d, DeepGlioma molecular subgroup classification performance on patients 55 years or younger versus patient older than 55 years. The overall DeepGlioma performance remained high in the ≤ 55 cohort, maintaining a high multiclass accuracy compared the entire cohort. DeepGlioma was trained to generalize to all adult patients. b, DeepGlioma molecular subgroup classification performance for each of the prospective testing medical centers is shown. Accuracy (95% confidence intervals) are shown above the confusion matrices. Overall performance was stable across the three largest contributors of prospective patients. Performance on the MUV dataset was comparatively lower than other centers; however, some improvement was observed during the LIOCV experiments. Red indicates the best performance.
Extended Data Fig 9.
Extended Data Fig 9.. Molecular genetic and molecular subgroup heatmaps
DeepGlioma predictions are presented as heatmaps from representative patients included in our prospective clinical testing dataset for each diffuse glioma molecular subgroup. a, SRH images from a patient with a molecular oligodendroglioma, IDH-mutant, 1p19q-codel. Uniform high probability prediction for both IDH and 1p19q-codel and corresponding low ATRX mutation prediction. SRH images show classic oligodendroglioma features, including small, branching ‘chicken-wire’ capillaries and perineuronal satellitosis. Oligodendroglioma molecular subgroup heatmap shows expected high prediction probablity throughout the dense tumor regions. b, A molecular astrocytoma, IDH-mutant, 1p19q-intact and ATRX-mutant is shown. Astrocytoma molecular subgroup heatmap shows some regions of lower probability that may be related to the presence of image features found in glioblastoma, such as microvascular proliferation. However, regions of dense hypercellularity and anaplasia are correctly classified as IDH mutant. These findings indicate DeepGlioma’s IDH mutational status predictions are not determined solely by conventional cytologic or histomorphologic features that correlate with lower grade versus high grade diffuse gliomas. c, A glioblastoma, IDH-wildtype tumor is shown. Glioblastoma molecular subgroup heatmap shows high confidence throughout the tumor specimen. Additionally, this tumor was also ATRX mutated, which is know to occur in IDH-wildtype tumors [10]. Despite the high co-occurence of IDH mutations with ATRX mutations, DeepGlioma was able to identify image features predictive of ATRX mutations in a molecular glioblastoma. Because ATRX mutations are not diagnostic of molecular glioblastomas, the ATRX prediction does not effect the molecular subgroup heatmap (see ‘Molecular heatmap generation‘ section in Methods). Additional SRH images and DeepGlioma prediction heatmaps can be found at our interactive web-based viewer deepglioma.mlins.org.
Extended Data Fig 10.
Extended Data Fig 10.. Evaluation of DeepGlioma on non-canonical diffuse gliomas
A major advantage of DeepGlioma over conventional immunohistochemical laboratory techniques is that it is not reliant on specific antigens for effective molecular screening. a, A molecular oligodendroglioma with an IDH2 mutation is shown. DeepGlioma correctly predicts the presence of both an IDH mutation and 1p19q-codeletion. IDH1-R132H IHC performed on the imaged specimen is negative. The patient was younger than 55 and, therefore, required genetic sequencing in order to complete full molecular diagnostic testing using our current laboratory methods. b, A molecular astrocytoma with an IDH1-R132S and ATRX mutation. DeepGlioma correctly identifies both mutations. c, A patient with a suspected adult-type diffuse gliomas met inclusion criteria for the prospective clinical testing set. Patient was later diagnosed with a diffuse midline glioma, H3 K27-altered. DeepGlioma correctly predicted the patient to be IDH-wildtype without previous training on diffuse midline gliomas or other pediatric-type diffuse gliomas. We hypothesize that DeepGlioma can perform well on other glial neoplasms in a similar zero-shot fashion.
Fig. 1
Fig. 1. Bedside SRH and DeepGlioma workflow.
a, A patient with a suspected diffuse glioma undergoes surgery for tumor biopsy or surgical resection. The SRH imaging system is portable and imaging takes place in the operating room, performed by a single technician using simple touch screen instructions. A freshly excised tissue specimen is loaded directly into a premade microscope slide and inserted into the SRH imager without the need for tissue processing (Extended Data Fig. 1). Raw SRH images are acquired at two Raman shifts, 2,845cm−1 and 2,930cm−1, as strips. The time to acquire a 3×3mm2 SRH image is approximately 90 seconds. Raw optical images can then be colored using a custom hematoxlyin and eosin (HE) virtual staining method for clinician review. b, DeepGlioma is trained using a multi-modal dataset. First, SRH images are used to train an CNN encoder using weakly supervised, multi-label contrastive learning for image feature embedding (Extended Data Fig. 3). Second, public diffuse glioma genomic data from TCGA, CGGA, and others (Extended Data Table 2) are used to train a genetic encoder to learn a genetic embedding that represents known co-occurrence relationships between genetic mutations (Extended Data Fig. 5). c, The SRH and genetic encoders are integrated into a single architecture using a transformer encoder for multi-label prediction of diffuse glioma molecular diagnostic mutations. We use masked label training to train the transformer encoder (Extended Data Fig. 6). Because our system uses patch-level predictions, spatial heatmaps can be generated for both molecular genetic and molecular subgroup predictions to improve model interpretability, identify regions of variable confidence, and associate SRH image features with DeepGlioma predictions (Extended Data Fig. 9 and 10).
Fig. 2
Fig. 2. DeepGlioma molecular classification performance
a, Results from our prospective multicenter testing cohort of diffuse glioma patients are shown. DeepGlioma was trained using UM data only and tested on our external medical centers. All results are presented as patient-level predictions. Individual ROC curves for IDH-1/2 (AUROC 95.9%), 1p9q-codeletion (AUROC 97.7%), and ATRX (AUROC 85.7%) classification are shown. Our AUROC values were highest for IDH-1/2 and 1p19q-codeletion prediction. Bar plot inset shows the accuracy, F1 score, and AUROC classification metrics for each of the mutations. Similar to our cross-validation experiments, ATRX mutation prediction was the most challenging as demonstrated by comparatively lower metric scores. Individual patient-level molecular genetic prediction probabilities are ordered and displayed. b, Results from the LIOCV experiments. Mean (solid line) and standard deviation (fill color) ROC curves are shown. Metrics are averaged over external testing centers to determine the stability of DeepGlioma classification results given different patient populations, clinical workflows, and SRH imagers. Including additional training data resulted in an increase in DeepGlioma performance, especially for 1p19q and ATRX classification. c, Primary testing endpoint: comparison of IDH1-R132H IHC versus DeepGlioma for IDH mutational status detection. DeepGlioma achieved a 94.2% balanced accuracy for the prospective cohort and a 97.0% balanced accuracy for patients 55 years or less. The major performance boost was due to the +10% increase in prediction sensitivity over IDH1-R132H IHC due to DeepGlioma’s detection of both canonical and non-canonical IDH mutations. d, Secondary testing endpoint: DeepGlioma results for molecular subgrouping according to WHO CNS5 adult-type diffuse glioma taxonomy. Multiclass classification accuracy for all patients and patients 55 years or less are shown. e, UMAP visualization of SRH representations from DeepGlioma. Small, semi-transparent points are SRH patch representations and large, solid points are patient representations (i.e. average patch location) from the prospective clinical cohort. Representations are labeled according to their IDH subgroup and diffuse glioma molecular subgroup. Our patch contrastive learning encourages the SRH encoder to learn representations that are uniformily distributed on the unit hypersphere [32].

Comment in

References

    1. Yadav H, Shah D, Sayed S, Horton S & Schroeder LF Availability of essential diagnostics in ten low-income and middle-income countries: results from national health facility surveys. The Lancet Global Health (2021). - PMC - PubMed
    1. Sullivan R et al. Global cancer surgery: delivering safe, affordable, and timely cancer surgery. Lancet Oncol. 16 (11), 1193–1224 (2015). - PubMed
    1. Cheah P-L, Looi LM & Horton S Cost analysis of operating an anatomic pathology laboratory in a Middle-Income country. Am. J. Clin. Pathol. 149 (1), 1–7 (2018). - PubMed
    1. Horbinski C et al. The medical necessity of advanced molecular testing in the diagnosis and treatment of brain tumor patients. Neuro. Oncol. 21 (12), 1498–1508 (2019). - PMC - PubMed
    1. Freudiger CW et al. Label-free biomedical imaging with high sensitivity by stimulated raman scattering microscopy. Science 322 (5909), 1857–1861 (2008). - PMC - PubMed

Publication types

Substances