. 2023 Apr;25(4):540-549.
doi: 10.1038/s41556-023-01110-2. Epub 2023 Mar 23.

Co-option of epidermal cells enables touch sensing

Affiliations

Co-option of epidermal cells enables touch sensing

Federica Mangione et al. Nat Cell Biol. 2023 Apr.

Erratum in

Abstract

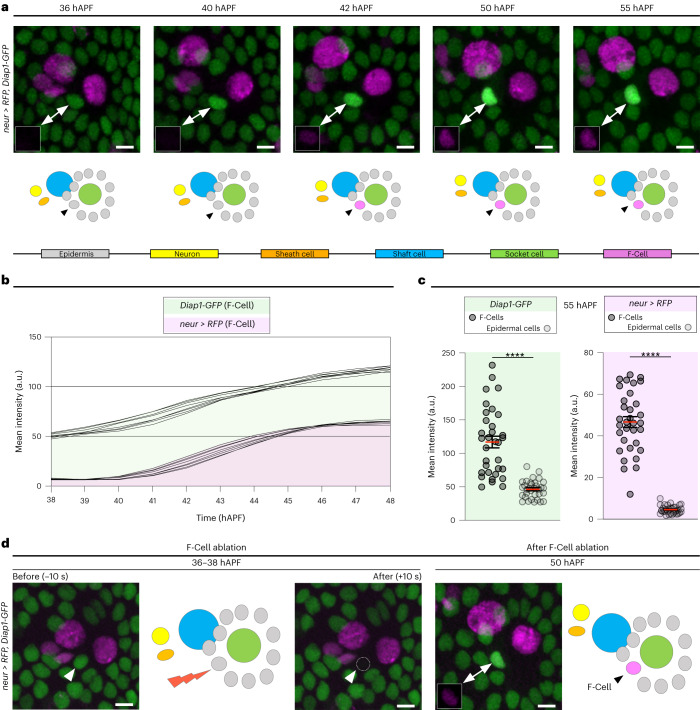
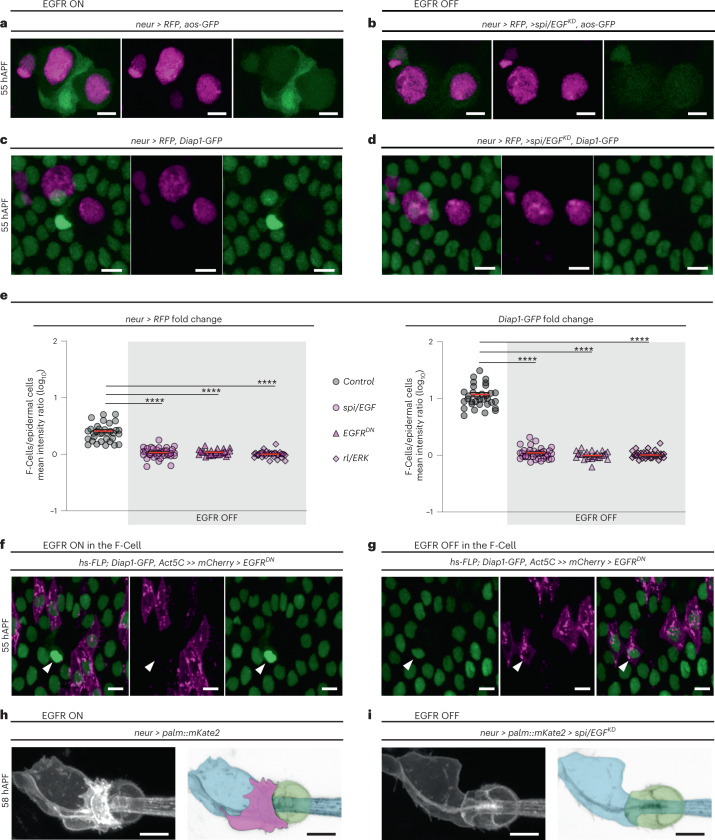
The epidermis is equipped with specialized mechanosensory organs that enable the detection of tactile stimuli. Here, by examining the differentiation of the tactile bristles, mechanosensory organs decorating the Drosophila adult epidermis, we show that neighbouring epidermal cells are essential for touch perception. Each mechanosensory bristle signals to the surrounding epidermis to co-opt a single epidermal cell, which we named the F-Cell. Once specified, the F-Cell adopts a specialized morphology to ensheath each bristle. Functional assays reveal that adult mechanosensory bristles require association with the epidermal F-Cell for touch sensing. Our findings underscore the importance of resident epidermal cells in the assembly of functional touch-sensitive organs.


Conflict of interest statement

The authors declare no competing interests.

Figures

Fig. 1
Fig. 1. Epidermal F-Cells associate with differentiating tactile bristles.
a, Left to right: diagram of the adult fly highlighting the tactile bristles decorating the dorsal body surface, SEM image showing the hairy epidermal cuticle of the abdomen, bright-field image displaying the innervation of the tactile bristles, and close-up view of the cuticular socket and hair shaft structures showing the connection of the dendrite to the base of the tactile organ. PNS neurons are marked by GFP expression under nSyb-GAL4 control (nSyb > GFP, yellow). b, Expression of the nuclear marker H2B::RFP under the control of neur-GAL4 (neur > RFP, magenta) showing the time course of neur expression. Diagrams show each cell type as bristle differentiation progresses. By 55 hAPF, a fifth neur > RFP expressing cell, the F-Cell, is visible next to each organ (arrowhead). c, Left to right: tactile bristle and the F-Cell (arrowhead) marked by the expression of neur > RFP (magenta) and the socket cell-specific reporter Su(H)-ASE5-GFP (green), diagram showing the position of the F-Cell relative to the bristle cells, and morphology of the tactile bristle and epidermis by co-expression of neur > RFP (magenta) and the ubiquitous microtubule marker Jupiter::GFP (green). Note that the F-Cell lies between the socket cell and the shaft cell. d, Simultaneous expression of neur > RFP with the ubiquitous nuclear marker Ubi-GFP.nls (green) shows that the F-Cell is part of the epidermis surrounding the bristle. e, Tactile organ visualized by co-expression of neur > RFP and the membrane-localized GFP mCD8-GFP, revealing association of the F-Cells (arrowhead) with the tactile bristles and the socket cell. Results are representative of three independent experiments. Scale bars, 150 μm, 20 μm, 5 μm (a) and 5 μm (be). Full genotypes are listed in Supplementary Table 1.
Fig. 2
Fig. 2. F-Cell specification occurs post-mitotically.
a, Top: time-lapse imaging showing expression pattern dynamics of neur > RFP (magenta) and Diap1-GFP (green). The position of the epidermal F-Cell is indicated by arrowheads and insets show expression of neur > RFP in the F-Cell. Note that, over time, levels of Diap1-GFP are selectively upregulated in the F-Cell, allowing its unambiguous detection in the epidermal layer. Results are representative of three independent experiments. See Supplementary Video 1. Bottom: diagrams summarizing the post-mitotic specification of the F-Cell. b, Graph displaying changes in expression levels of neur > RFP and Diap1-GFP in the F-Cell between 38 hAPF and 48 hAPF (n = 8 bristles simultaneously imaged for RFP and GFP over the time course from three pupae and three independent experiments). c, Dot plots showing quantifications of neur > RFP and Diap1-GFP levels at 55 hAPF in epidermal F-Cells versus epidermal cells (n = 35 bristles simultaneously imaged for RFP and GFP over the time course from seven pupae and three independent experiments). Data are mean (red bar) ± s.e.m. (black bars). Two-tailed unpaired Student’s t-test was performed; ****P < 0.0001. d, Elimination of the F-Cell via laser ablation at 36–38 hAPF leads to de novo specification of the F-Cell next to the tactile bristle and diagram showing the five neur > RFP expressing cells at 50 hAPF (n = 22 F-Cells over seven pupae from three independent experiments). Scale bars, 5 μm. Full genotypes are listed in Supplementary Table 1. Numerical data and exact P values are available in source data. Source data
Fig. 3
Fig. 3. F-Cell specification requires EGFR signalling.
a, Expression pattern of the aos-GFP reporter (green) and neur > RFP (magenta) at 55 hAPF, showing high EGFR activity in the F-Cell. b, Images showing the lack of F-Cell specification upon downregulation of the EGFR ligand spi/EGF within the bristle through the absence of aos-GFP and neur > RFP in epidermal cells surrounding the bristle. c, Epidermal cells (Diap1-GFP, green) and bristle (neur > RFP), showing the F-Cell (arrowhead) at 55 hAPF. d, Images showing the lack of F-Cell specification upon downregulation of spi/EGF by uniform Diap1-GFP expression and absence of neur > RFP in the epidermal cells surrounding the bristles. e, Dot plots showing quantifications of neur > RFP (left) and Diap1-GFP (right) intensity fold changes in presence (n = 35 control bristles from seven pupae) or absence of EGFR signalling (n = 37 spi/EGFKD bristles from five pupae; n = 25 EGFRDN bristles from five pupae; n = 37 rl/ERK bristles from five pupae), each from three independent experiments. Note that levels of both markers remain basal when EGFR signalling is off. Data are mean (red bar) ± s.e.m. (black bars). The two-tailed unpaired Kolmogorov–Smirnov test was performed; ****P < 0.0001. f,g, Expression of Diap1-GFP in the F-Cell (arrowhead) after expression of EGFRDN in clones of cells within the epidermis (f) or in clones of cells including epidermal cells and the F-Cell (g). Clones of cells expressing EGFRDN are marked in magenta (Methods). h, Morphology of the tactile bristle (left) and false coloured image (right) highlighting the association of the F-Cell (magenta) with the socket and shaft cells at 58 hAPF. i, Morphology of the tactile bristle and false coloured image highlighting the lack of associated F-Cell with the socket and shaft cells when EGFR signalling is downregulated in the bristle. Results are representative of three independent experiments. Scale bars, 5 μm. Full genotypes are listed in Supplementary Table 1. Numerical data and exact P values are available in source data. Source data
Fig. 4
Fig. 4. Morphological differentiation of the F-Cell.
a, Time-lapse imaging showing the morphological differentiation of the F-Cell after its specification. Top row: F-Cell morphology labelled by the expression of a membrane-localized GFP under control of 25c01-GAL4 (25c01 > myrGFP; grey). See also Supplementary Video 3. Bottom row: volume rendering of the F-Cell shape. b,c, 3D rendering of the tactile bristle and the F-Cell at 58 hAPF (b) and at 68 hAPF (c) from SBF-SEM data. The 3D-(xyz) coordinate system indicates the angular view of the bristle and F-Cell with respect to the epidermal tissue plane. See Supplementary Videos 4–6 and Supplementary Table 2. Results are representative of three independent experiments. Scale bars, 5 μm. Full genotypes are listed in Supplementary Table 1.
Fig. 5
Fig. 5. Epidermal F-Cells ensheath the tactile bristles.
a, 3D rendering of the tactile bristle between 68 hAPF and 95 hAPF visualized with the F-Cell (top) or showing bristle cells only (bottom). Note that the F-Cell is wrapping around the socket cell, while contacting both the shaft and socket cells more basally. See Supplementary Videos 7 and 8. b, Top: SEM image showing the external features of the adult bristle. The cuticular socket and hair shaft are false coloured in green and light blue, respectively. Bottom: 3D rendering of the cellular structures of the adult tactile bristle visualized with the F-Cell, showing exclusively bristle cells, or the mechanosensory neuron and enveloping sheath cell membrane. The F-Cell is wrapping around the socket cell, and the socket cell is wrapping around the sheath cell encapsulating the neuron dendrite. See also Supplementary Videos 9 and 10 and Supplementary Table 2. Results are representative of two (88–90 hAPF and 95 hAPF) or three independent experiments. Scale bar, 5 μm. Full genotypes are listed in Supplementary Table 1.
Fig. 6
Fig. 6. Tactile bristles require epidermal F-Cells for touch sensing.
a, Left to right: diagram of the adult tactile bristle and the F-Cell, quantifications of the TEP at rest, voltage traces with the averaged response of the neuron upon hair shaft deflection in black, and quantifications of the MRP peak amplitudes from stimulated wild-type Ore-R bristles (n = 31 TEPs and 762 MRPs pooled from 15 flies and three independent experiments). b,c, Left to right: diagram showing the adult tactile bristle without the F-Cell, quantifications of the TEP at rest, voltage traces with the averaged response of the neuron in black, and quantifications of MRP peak amplitudes from stimulated bristles lacking the F-Cell (b: n = 20 TEPs and 380 MRPs versus n = 18 TEPs and 460 MRPs paired controls pooled from eight flies and three independent experiments for each condition) or from bristles with ablated F-Cells (c: n = 15 TEPs and 349 MRPs versus n = 19 TEPs and 538 MRPs paired controls pooled from ten flies and three independent experiments for each condition). d, Action potential (AP) burst firing and AP count at stimulus onset (grey box) in wild-type Ore-R (n = 13 bristle and 1,016 APs pooled from nine flies and three independent experiments for each condition). e,f, AP burst firing and AP count in bristles lacking the F-Cell (e: n = 13 bristles and 745 APs versus n = 11 bristles and 855 APs paired controls pooled from 10 flies and three independent experiments for each conditions), or in bristles after ablation of the F-Cell (n = 11 bristles and 658 APs versus n = 9 bristles and 802 APs paired controls pooled from 11 flies and three independent experiments for each condition). g, Diagram of the touch-evoked scratch reflex assay and quantifications of the responsiveness upon touch in controls versus flies lacking the F-Cell (n = 5 stimuli per fly, 20 flies in two independent experiments per condition). Data are mean (red bar) ± s.e.m. (black bars) (ac) or mean ± s.d. (black bars) (g). In violin plots, the kernel density distribution of the data is shaped around the central median, extending to the 25% and 75% quartiles (dashed lines) up to the maximum and minimum values. The two-tailed unpaired Kolmogorov–Smirnov test; *P < 0.05, **P < 0.01 (TEP ac) or Mann–Whitney test; ****P < 0.0001 (dg), and one-way ANOVA with Kruskal–Wallis test; ****P < 0.0001 (MRP ac) were performed. Results are representative of three independent experiments. Full genotypes are listed in Supplementary Table 1. Numerical data and exact P values are available in source data. Source data
Extended Data Fig. 1
Extended Data Fig. 1. Early development of the abdominal tactile bristles.
(a) Specification of the tactile bristles within the abdominal epithelium during the first day of pupal development. Left: N-dependent pattern of E(spl)ma-GFP (green) and neur > RFP (magenta) at the onset of bristle specification. E(spl)-m⍺a-GFP is expressed in the epidermal cells surrounding the SOPs, which are marked by neur > RFP expression. Right: the pattern of E(spl)ma-GFP and of neur > RFP after SOPs division. Note that the expression of neur > RFP is restricted to the four cells of the bristles. (b) Diagram of the tactile bristle lineage showing the cellular events characterizing the specification of the four cells of each tactile bristle. Circles indicate cells and lines indicate the duration of each event in hAPF. The cross over the glial cell indicates apoptosis. (c) Time course of early bristle development showing the asymmetric cell divisions and intra-lineage apoptosis leading to the four cells of each bristle. The SOP and progeny cells are marked by the expression of neur > RFP and the membrane marker pon::GFP (grey), which displays asymmetric localization during cell divisions. (d) Shape of the tactile bristle by the onset of its terminal differentiation and coloured schematic showing the four component cells. Note that the socket and shaft cells have increased nuclear size, and that the neuron and sheath cells lie adjacent to each other. (e) Early differentiating tactile bristles marked by the expression of neur > RFP and the ubiquitous microtubule marker Jupiter::GFP (green) showing hair shaft outgrowth soon after the four bristle cells have been specified. Results are representative of three independent experiments. Scale bars: 5 μm. Full genotypes are listed in Supplementary Table 1.
Extended Data Fig. 2
Extended Data Fig. 2. F-Cells lie adjacent to differentiating tactile bristles.
(a) Tactile bristle and the F-Cell (arrowhead) at 70 hAPF labelled by expression of the microtubule marker GFP::CLIP-170 (green) under control of neur > RFP. Note that the F-Cell associates with the socket cell. (b) Top: diagram of the cuticular socket and hair shaft. Bottom: detection of the F-Cell (arrowhead) next to the socket cell (dotted circle) by enhanced expression of Diap1-GFP (green) and co-labelling of the junctional network with E-Cad::TdTomato. (c) Diagram of the tactile bristles decorating the adult abdominal surface and the abdominal epidermis visualized at 65 hAPF. E-Cad::td-Tomato expression marks the junctional network and Diap1-GFP (green) labels the nuclei of the epidermal cells. F-Cells are identifiable by elevated Diap1-GFP in the epidermal cells next to each socket cell within the monolayered epithelium. (e) Diagram of the tactile bristles decorating the adult thoracic surface and pattern of Diap1-GFP in the thoracic epidermis at 50 hAPF. (d) Identification of the F-Cell (arrowhead) in the thoracic epidermis by the expression of Diap1-GFP and neur > RFP, and simultaneous expression of Jupiter::GFP (green) and neur > RFP (magenta) to highlight F-Cell position next to the socket and shaft cells. Results are representative of three independent experiments. Scale bars: 5 μm (a-b, e), 15 μm (c) and 20 μm (d). Full genotypes are listed in Supplementary Table 1.
Extended Data Fig. 3
Extended Data Fig. 3. Selective ablation of epidermal cells reveals F-Cell specification dynamics.
(a) Methodology used for the ablation of individual cells within the abdominal epidermis. Epidermal cells are labelled by the expression of the nuclear marker Diap1-GFP and depicted in grey in all diagrams. A target epidermal cell (arrowhead) is ablated using a high-power femtosecond laser pulse (see Methods), and the behaviour of surrounding cells is tracked over time. After ablations the cells adjacent to the ablated area (asterisks) move towards each other. Note that no changes in levels of expression of the Diap1-GFP reporter in epidermal cells are detectable over time. (b) Epidermal cells (Diap1-GFP, green) and tactile bristle cells (neur > RFP) before and after laser ablation of the F-Cell (white arrowhead). When the F-Cell is ablated at 36-38 hAPF, the neighbouring epidermal cells (asterisks) fill its position over time and expression levels of Diap1-GFP and neur > RFP are selectively enhanced in a single epidermal cell next to the bristle (yellow arrowheads), indicating de novo F-Cell specification (n = 22 F-Cells over 7 pupae from 3 independent experiments). See Supplementary Video 2. (c) Diagram summarizing the findings in (b). (d) Ablation of the F-Cell (arrowhead) as in (b) but performed at 45-50 hAPF. When the F-Cell is ablated after expressing neur > RFP, the cells adjacent to the ablated area (asterisks) do not show de novo expression of neur > RFP or changes in the levels of Diap1-GFP expression over time (n = 27 F-Cells over 9 pupae from three independent experiments. (e) Diagram summarizing the findings in (d). Results are representative of three independent experiments. Scale bars: 5 μm. Full genotypes are listed in Supplementary Table 1.
Extended Data Fig. 4
Extended Data Fig. 4. F-Cell specification is initiated by the tactile bristle.
(a-to-d) Left: diagrams depicting the cell ablations used to assess F-Cell recruitment by tactile bristles cells. The cells that were ablated at 36-38 hAPF are marked by black crosses. Middle: epidermal and tactile bristle cells visualized at 55 hAPF by the expression of Diap1-GFP (green) and neur > RFP. Right: diagrams summarizing the effects of each cellular ablation on F-Cell specification (n = 16 socket cells over 7 pupae; n = 11 shaft cells over 8 pupae; n = 12 neuron and sheath cells over 5 pupae; n = 13 socket and shaft cells over 4 pupae, from three independent experiments. The F-Cell is no longer detectable after simultaneous ablation of the socket and shaft cells (b) or ablation of the shaft cell alone (d). (e) Effect of N activity gain via downregulation of H on Diap1-GFP and neur > RFP expression patterns (neur > HKD, right) within the bristle compared to control (left). (f) Diagrams depicting the differential N signalling within the differentiating socket and shaft cells (green and light blue) in controls (left), upon N activity gain in the shaft cell (middle) or upon N activity loss in the socket cell (right). (g) Top, left-to-right: brightfield images displaying the adult cuticular socket and hair shafts in controls, two socket-like structures upon N activity gain in the shaft cell, and two hair shaft-like structures upon N activity loss in the socket cell. Bottom, left-to-right: socket and shaft cells visualized by the expression of mCherry in the Diap1-GFP background (green) showing associated F-Cells in controls, lack of F-Cell next to a bristle composed of two socket-like cells, or enhanced Diap1-GFP in two cells next to a bristle composed of two shaft-like cells. Results are representative of three independent experiments. Scale bars: 5 μm. Full genotypes are listed in Supplementary Table 1.
Extended Data Fig. 5
Extended Data Fig. 5. Elevated levels of EGFR and of the aos-GFP reporter in the F-Cell.
(a) EGFR protein localization during F-Cell specification. A fire LUT scale for fluorescent intensities (bottom-right) was applied to highlight higher EGFR protein levels in the F-Cell relative to surrounding epidermis. (b) Image showing EGFR enrichment in the F-Cell relative to epidermal cells, co-labelled by the expression of E-Cadherin. A fire LUT scale for fluorescent intensities (bottom-left) was applied to highlight higher protein levels of EGFR in the F-Cell relative to surrounding epidermis. (c) Expression pattern dynamics of the EGFR signalling reporter aos-GFP (green) together with neur > RFP during tactile bristle differentiation, revealing EGFR activity in the F-Cell. Results are representative of three independent experiments. Scale bars: 12 μm (a) and 5 μm (b-c). Full genotypes are listed in Supplementary Table 1.
Extended Data Fig. 6
Extended Data Fig. 6. EGFR signalling is required for F-Cell specification.
(a) Expression the EGFR signalling reporter aos-GFP (green), together with neur > RFP, in rl/ERK mutant background (rl1/rl10a). (b) Uniform Diap1-GFP and absence of neur > RFP expression in epidermal cells surrounding bristles expressing of EGFRDN. See Fig. 3e for quantifications. (c) Uniform Diap1-GFP and absence of neur > RFP expression in epidermal cells surrounding bristles in a rl/ERK mutant background. See Fig. 3e for quantifications. (d) Top row: diagram of the tactile bristle when EGFR signalling is active (presence of the F-Cell) or impaired (absence of the F-Cell). Middle row: expression of neur > RFP and of the socket cell-specific reporter Su(H)-ASE5-GFP (green) at 60 hAPF when EGFR signalling is active or impaired. Bottom row: bright field images showing the shape of the cuticular socket and hair shaft at 90 hAPF in each condition. Note that the cuticular sockets and hair shafts appear unaffected by impaired EGFR signalling. (e) Right, Diap1-GFP expression in the epidermis showing F-Cells adjacent to control bristles (white arrowheads), but not next to bristles lacking spi/EGF activity in the shaft cells (yellow arrowhead; See Methods). Centre: zoomed-in view of the bristle lacking spi/EGF activity in the shaft cells from the left panel, with diagram summarising the result on top. (f) Quantification of Diap1-GFP fluorescence intensity in F-Cells and epidermal cells next to shaft cells lacking spi/EGF (n = 9 clones per genotypes in 8 flies at pupal stage). In the dot plots the mean is marked in red and error bars represent SEM. The unpaired two-tailed Student’s t-test for equal mean was applied (p > 0.05, NS: not significant). Results are representative of three independent experiments. Scale bars: 5 μm. Full genotypes for are listed in Supplementary Table 1. Numerical data and exact P values are available in source data. Source data
Extended Data Fig. 7
Extended Data Fig. 7. Morphology of differentiating F-Cells.
(a) Top: diagram of the argos (aos) locus. Black boxes indicate exons and black lines indicate introns. Boxes below the large intron indicate the enhancer-driven GAL4 lines screened in this study. The box highlighted in magenta denotes the GAL4 line showing restricted expression in the F-Cell. Bottom: expression of mCherry under the control of 25c01-GAL4 in a Diap1-GFP background (green) showing the co-labelling of the mCherry with the cells expressing high levels of Diap1-GFP (that is, F-Cells). (b) Time course of the shape changes underlying F-Cell differentiation. The morphology of the F-Cell is marked by the expression of a membrane localized GFP under the control of 25c01-GAL4 (magenta). See Supplementary Video 3. (c) Volume rendering of the differentiating F-Cell (coronal view) coloured in magenta (top) or after applying a 5-rumps LUT scale for z-depth (bottom). Note the basal shifting of the F-Cell as the cuticle is deposited apically over time. Results are representative of three independent experiments. Scale bar is 15 μm (a) and 5 μm (b-c). Full genotypes are listed in Supplementary Table 1.
Extended Data Fig. 8
Extended Data Fig. 8. 3D rendering of the tactile bristle and the F-Cell.
(a) Workflow used to determine the 3D structure of the tactile bristle and associated F-Cell at different developmental times by Serial Block-Face Scanning Electron Microscopy (SBF-SEM). After dissection and fixation of the abdominal tissue, the embedded specimen was subjected to micro-CT (left) to orient the block face in the microscope (middle), where the specimen was sectioned and imaged. For the 3D rendering (right) multiple sections were aligned (1), the cells were manually segmented (2) and the volume within the 3D-(xyz)-space (3) was reconstructed (see Methods and Supplementary Table 2). (b) SBF-SEM images showing the epidermal tissue and differentiating bristle at 58 hAPF sectioned at different angles and cartoons showing the cells of the tactile bristle, the F-Cell and the epidermal cells. Note that the F-Cell is contacting both the socket and the shaft cell apically, while extending contacts toward the base of the tactile organ. (c) Axial (x-y), sagittal (y-z), and coronal (x-z) views of the tactile bristle and F-Cell at 58 hAPF (top) or of the tactile bristle alone (bottom). The neuron and sheath cell are concentrically enwrapped apically by the shaft and socket cells while the F-Cell is located anteriorly (see Supplementary Videos 4 and 5). (d) Axial, sagittal, and coronal views of the tactile bristle and F-Cell (top row), or of the tactile bristle alone (bottom row) at 68 hAPF. The neuron and sheath cell are concentrically enwrapped by the shaft cell, socket cell, and F-Cell by this stage (see Supplementary Video 6). Results are representative of three independent experiments. Full genotypes are listed in Supplementary Table 1.
Extended Data Fig. 9
Extended Data Fig. 9. The F-Cell is associated with the tactile bristle of the adult fly.
(a) 3D morphology of the tactile bristle at 88-90 hAPF. The F-Cell shows extensive contacts with the socket cell and reduced contact with the shaft cell at this stage. The shaft cell cytoplasm (arrow) is retracting from the dendrite tip (arrowhead). See Supplementary Video 7. (b) 3D morphology of the tactile organ at 95 hAPF (that is, immediately before eclosion of the adult fly). The F-Cell shows extensive contacts with the socket cell and reduced contact with the shaft cell at this stage. The shaft cell cytoplasm (arrow) has retracted further away from the dendrite tip (arrowhead) and is displaying an apoptotic morphology. See Supplementary Video 8. (c) Time course of the death of the shaft cell. Cells are marked by the expression of neur > RFP. Inverted time-lapse confocal images showing condensation and fragmentation of the shaft cell nucleus (arrowhead). Note that the F-Cell is detectable next to the socket cell also at 96 hAPF. (d) SBF-SEM images of the adult bristle. Note that the F-Cell is ensheathing the socket cell. Results are representative of two (a,b) and three (c,d) independent experiments. See Supplementary Video 9. Scale bar is 5 μm. Full genotypes are listed in Supplementary Table 1.
Extended Data Fig. 10
Extended Data Fig. 10. Assessing touch-evoked mechanotransduction in the tactile bristle.
(a) Diagram showing the set-up for extracellular recording from tactile bristles. The three non-neuronal cells of the tactile organ (F-Cell, magenta; socket cell, green; sheath cell, orange), the mechanosensory neuron (yellow) and its connection to the base of the hair shaft are shown. Clipping the hollow hair shaft, placing a recording electrode over the tip and a reference electrode in the supporting epithelium allows the measurement of the transepithelial potential (TEP) at rest and provides electrical access to the underlying neuron. Displacement of the hair shaft toward the body evokes a robust downward drop in the TEP, measured as a mechanoreceptor potential (MRP) of the neuron (see Methods). (b) MRP and superimposed action potential trains recorded upon 30 μm ramp-and-hold displacement of the hair shaft toward the body surface. The neuron generates a robust response at the onset of the stimulus (arrow). The MRP slowly declines towards resting values during the stimulus. A robust but smaller response is also recorded when the neuron returned to its resting position (arrowhead). (c-d) Morphology and innervation in controls (c) or in tactile bristles lacking the F-Cell (d). Top row: morphology and innervation of the bristle. Second row: morphology of the mechanosensory neuron, with dendritic tip zoomed-in view displayed in top right corner. Third row: dendritic tip insertion at the base of the bristle. Bottom row: SBF-SEM section of the dendritic tip. Note that both the structure and innervation of the tactile bristle, as well as the morphology of the adult neuron and sheath cell are normal when F-Cell specification is prevented. (e) Representative voltage traces from control bristles (top) and bristles lacking the F-Cell (bottom). See Fig. 6 for quantifications. (f) Representative traces from control bristles (top) and bristles with ablated F-Cell (bottom). See Fig. 6 for quantifications. Results are representative of three independent experiments. Scale bars: 5 μm. Full genotypes are listed in Supplementary Table 1.

Comment in

References

    1. Lumpkin EA, Marshall KL, Nelson AM. The cell biology of touch. J. Cell Biol. 2010;191:237–248. doi: 10.1083/jcb.201006074. - DOI - PMC - PubMed
    1. Handler A, Ginty DD. The mechanosensory neurons of touch and their mechanisms of activation. Nat. Rev. Neurosci. 2021;22:521–537. doi: 10.1038/s41583-021-00489-x. - DOI - PMC - PubMed
    1. Moehring F, Halder P, Seal RP, Stucky CL. Uncovering the cells and circuits of touch in normal and pathological settings. Neuron. 2018;100:349–360. doi: 10.1016/j.neuron.2018.10.019. - DOI - PMC - PubMed
    1. Chalfie M. Neurosensory mechanotransduction. Nat. Rev. Mol. Cell Biol. 2009;10:44–52. doi: 10.1038/nrm2595. - DOI - PubMed
    1. Zimmerman A, Bai L, Ginty DD. The gentle touch receptors of mammalian skin. Science. 2014;346:950–954. doi: 10.1126/science.1254229. - DOI - PMC - PubMed

Publication types

LinkOut - more resources