. 2023 May;8(5):803-818.
doi: 10.1038/s41564-023-01335-9. Epub 2023 Mar 23.

ATG7 and ATG14 restrict cytosolic and phagosomal Mycobacterium tuberculosis replication in human macrophages

Affiliations

ATG7 and ATG14 restrict cytosolic and phagosomal Mycobacterium tuberculosis replication in human macrophages

Beren Aylan et al. Nat Microbiol. 2023 May.

Abstract

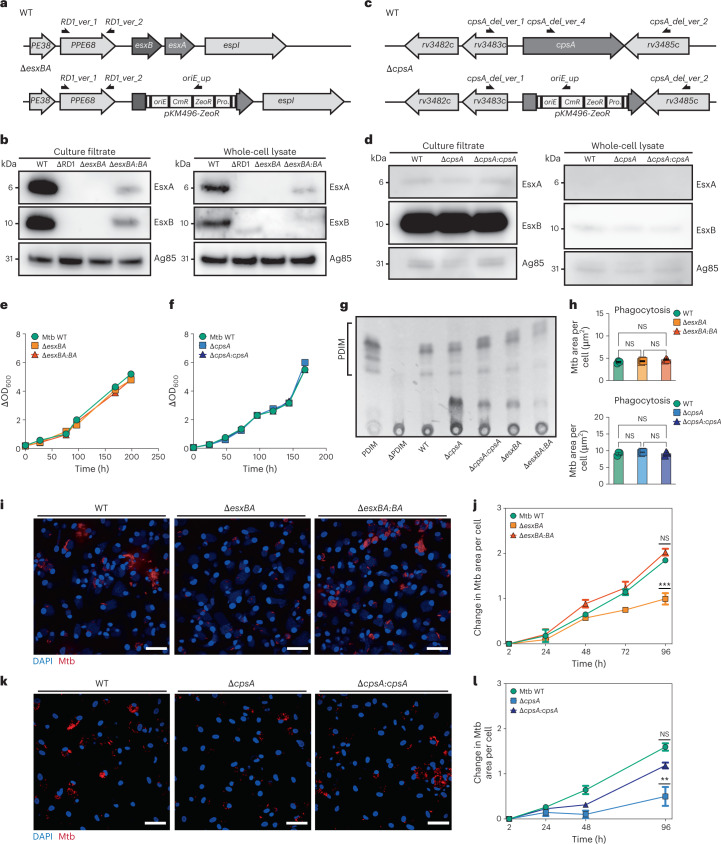
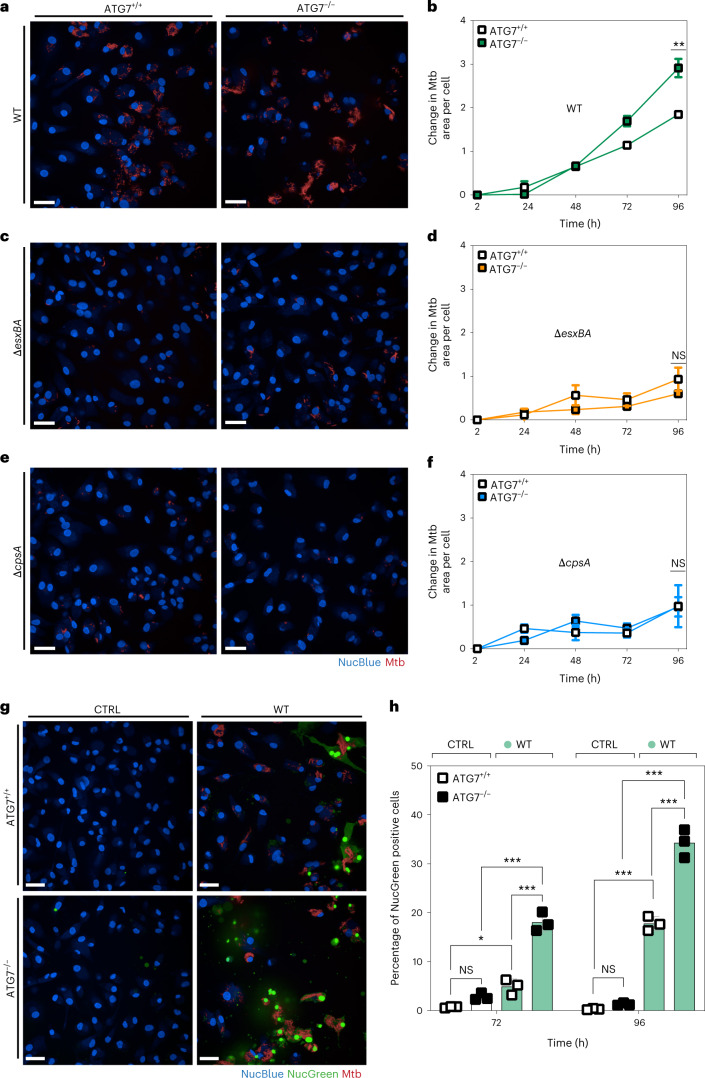
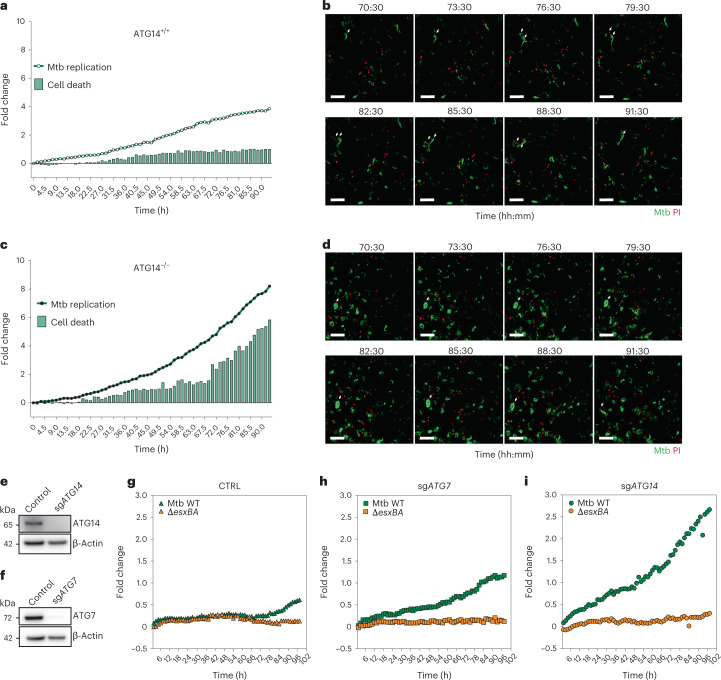
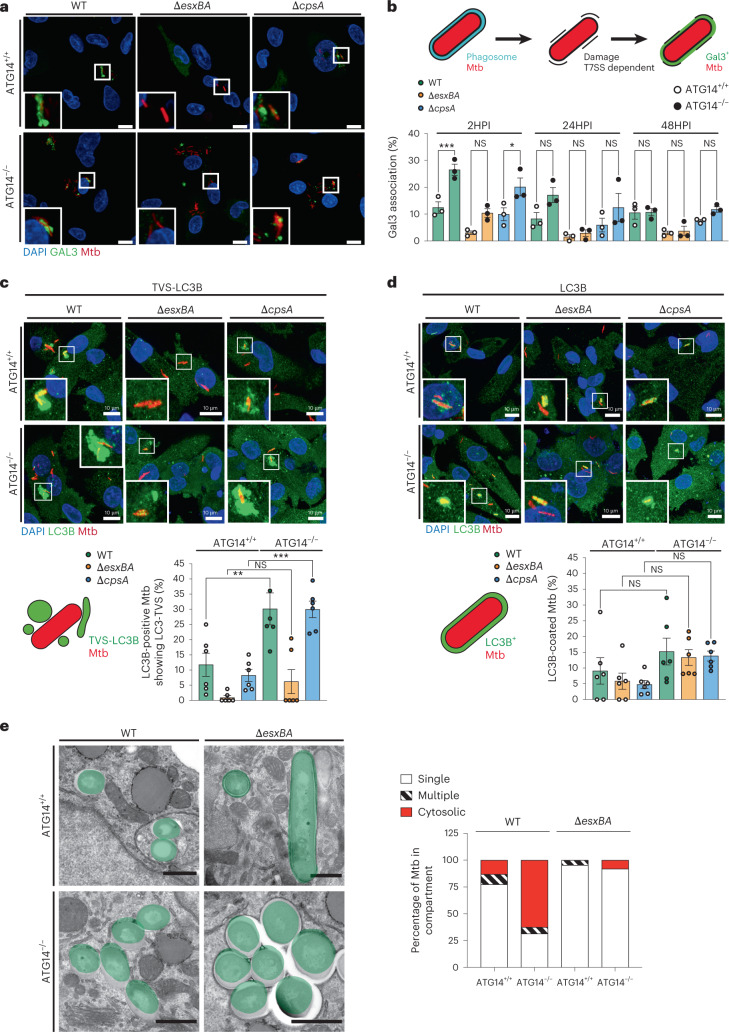
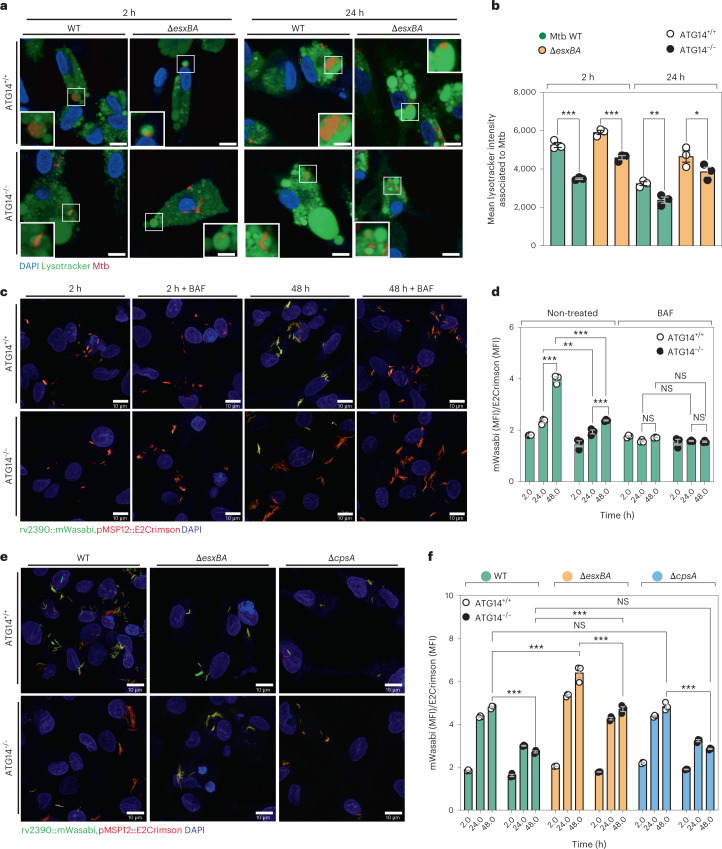
Autophagy is a cellular innate-immune defence mechanism against intracellular microorganisms, including Mycobacterium tuberculosis (Mtb). How canonical and non-canonical autophagy function to control Mtb infection in phagosomes and the cytosol remains unresolved. Macrophages are the main host cell in humans for Mtb. Here we studied the contributions of canonical and non-canonical autophagy in the genetically tractable human induced pluripotent stem cell-derived macrophages (iPSDM), using a set of Mtb mutants generated in the same genetic background of the common lab strain H37Rv. We monitored replication of Mtb mutants that are either unable to trigger canonical autophagy (Mtb ΔesxBA) or reportedly unable to block non-canonical autophagy (Mtb ΔcpsA) in iPSDM lacking either ATG7 or ATG14 using single-cell high-content imaging. We report that deletion of ATG7 by CRISPR-Cas9 in iPSDM resulted in increased replication of wild-type Mtb but not of Mtb ΔesxBA or Mtb ΔcpsA. We show that deletion of ATG14 resulted in increased replication of both Mtb wild type and the mutant Mtb ΔesxBA. Using Mtb reporters and quantitative imaging, we identified a role for ATG14 in regulating fusion of phagosomes containing Mtb with lysosomes, thereby enabling intracellular bacteria restriction. We conclude that ATG7 and ATG14 are both required for restricting Mtb replication in human macrophages.


Conflict of interest statement

The authors declare no competing interests.

Figures

Fig. 1
Fig. 1. Characterization of Mtb ΔesxBA and Mtb ΔcpsA.
a,c, Mtb esxBA-rv3874-75 locus (a) and cpsA-rv3484 locus (c) in Mtb WT and the respective deletion strains. Black half-arrows depict the primer positions (CmR, chloramphenicol resistance; ZeoR, zeocin resistance; Prom., groEL promoter). b,d, Western blot of EsxA and EsxB from total cell lysates and culture filtrates from Mtb WT, ΔRD1, ΔesxBA, ΔesxBA:BA (n = 3) (b) or Mtb WT, ΔcpsA and ΔcpsA:cpsA strains (n = 1) (d). Ag85 was used as a loading control. e, Growth curves of Mtb WT, ΔesxBA and ΔesxBA:BA. f, Growth curves of Mtb WT, ΔcpsA and ΔcpsA:cpsA strains. g, Thin-layer chromatography analysis of PDIM from Mtb WT, ΔcpsA, ΔcpsA:cpsA, ΔesxBA and ΔesxBA:BA cultures (n = 1). Purified PDIM and extracts from Mtb ΔPDIM were used as controls. h, Quantitative analysis of Mtb WT, ΔesxBA, ΔesxBA:BA (top) and Mtb WT, ΔcpsA, ΔcpsA:cpsA (bottom) area per single cell, 2 h post infection. Representative data of three independent experiments (n = 3 independent wells). Results are shown as mean ± standard error of the mean (s.e.m.). One-way ANOVA followed with Šídák’s multiple comparison test. NS, non-significant. i, Snapshot of live iPSDM infected with Mtb WT, ΔesxBA and ΔesxBA:BA 96 h post infection. Nuclear staining (blue) and Mtb-E2-Crimson (red). Scale bars, 50 µm. j, Quantitative analysis of Mtb replication after infection with Mtb WT, ΔesxBA and ΔesxBA:BA. Mtb area per cell was calculated as fold change, relative to 2 h post infection. Representative data of three independent experiments (n = 3 independent wells). Results are shown as mean ± s.e.m. One-way ANOVA followed with Šídák’s multiple comparison test. ***P < 0.001; NS, non-significant. k, Representative images of fixed iPSDM infected with Mtb WT, ΔcpsA and ΔcpsA:cpsA 96 h post infection. Nuclear staining (blue) and Mtb-E2-Crimson (red). Scale bars, 50 µm. l, Quantitative analysis of Mtb replication after infection with Mtb WT, ΔcpsA and ΔcpsA:cpsA. Mtb area per cell was calculated as fold change, relative to 2 h post infection. Representative data of three independent experiments (n = 3 independent wells). Results are shown as mean ± s.e.m. One-way ANOVA followed with Šídák’s multiple comparisons test **P < 0.002; NS, non-significant. Source data
Fig. 2
Fig. 2. Increased Mtb replication in ATG7-deficient iPSDM.
a,c,e, Snapshot of live ATG7+/+ and ATG7−/− iPSDM infected with Mtb WT (a), ΔesxBA (c) and ΔcpsA (e) at 96 h. Nuclear staining (blue) and Mtb-E2-Crimson (red). Scale bars, 50 µm. b,d,f, High content quantitative analysis of Mtb replication after infection of ATG7+/+ or ATG7−/− iPSDM with Mtb WT (b), ΔesxBA (d) and ΔcpsA (f). Mtb area per cell was calculated as fold change, relative to 2 h post infection. Data representative from one out of two independent experiments (n = 3 independent wells). Results are shown as mean ± s.e.m. An unpaired two-tailed t-test was used for comparisons **P < 0.002; NS, non-significant. g, Representative images of Blue/Green (Live/Dead)-stained ATG7+/+ and ATG7−/− iPSDM uninfected (CTRL) or infected with Mtb WT for 96 h. Nuclear staining (blue) and dead nuclear staining (green). Scale bars, 50 µm. h, Quantitative analysis of the percentage of NucGreen-positive cells in each condition. Data representative from one out of two independent experiments (n = 3 independent wells). Results are shown as mean ± s.e.m. One-way ANOVA followed with Šídák’s multiple comparison test ***P < 0.001, *P < 0.033; NS, non-significant. Source data
Fig. 3
Fig. 3. Mtb WT and Mtb ΔesxBA replication increased in ATG14-deficient iPSDM.
a,c,e, Snapshot of live ATG14+/+ and ATG14−/− iPSDM infected with Mtb WT (a), ΔesxBA (c) and ΔcpsA (e) at 96 h. Nuclear staining (blue) and Mtb-E2-Crimson (red). Scale bars, 50 µm. b,d,f, High-content quantitative analysis of Mtb replication after infection of ATG14+/+ or ATG14−/− iPSDM with Mtb WT (b), ΔesxBA (d) and ΔcpsA (f). Mtb area per cell was calculated as fold change, relative to 2 h post infection. Data representative from one out of two independent experiments (n = 3 independent wells). Results are shown as mean ± s.e.m. An unpaired two-tailed t-test was used for comparisons **P < 0.002, *P < 0.033; NS, non-significant. g, Representative images of Blue/Green (Live/Dead)-stained ATG14+/+ and ATG14−/− iPSDM uninfected (CTRL) or infected with Mtb WT, ΔesxBA and ΔcpsA for 96 h. Nuclear staining (blue) and dead nuclear staining (green). Scale bars, 50 µm. h, Quantitative analysis of the percentage of NucGreen positive cells in each condition. Data representative from one out of two independent experiments (n = 3 independent wells). Results are shown as mean ± s.e.m. Two-way ANOVA followed with Šídák’s multiple comparison test ***P < 0.001, **P < 0.002. Scale bars, 50 µm. Source data
Fig. 4
Fig. 4. Unrestrained Mtb replication and cell death in ATG14-deficient cells.
a,c, High-content quantitative analysis of live Mtb WT replication in ATG14+/+ (a) or ATG14−/− (c) iPSDM. Mtb area (dot plot) and cell death (bar plot) was calculated as fold change, relative to Mtb uptake at time 0 h post infection. Data representative from one out of two independent experiments. b,d, Representative micrographs at indicated timepoints of ATG14+/+ (b) or ATG14−/− (d) iPSDM infected with Mtb WT (green) in the presence of PI (red). Data representative from one out of two independent experiments. Scale bars, 50 µm. e,f, Western blot of human MDM pool-KO for ATG14 (e) or ATG7 (f). Data representative from one out of two independent experiments. g, High-content quantitative analysis of live Mtb WT and ΔesxBA replication in human MDM. Mtb area (dot plot) was calculated as fold change, relative to Mtb uptake at time 0 h post infection. h,i, High-content quantitative analysis of live Mtb WT and Mtb ΔesxBA replication in nucleofected human MDM pool-KO for ATG14 (h) or ATG7 (i). Mtb area (dot plot) was calculated as fold change, relative to Mtb uptake at time 0 h post infection. Data representative of one out of two independent experiments. Source data
Fig. 5
Fig. 5. ATG14 contributes to maintenance of Mtb in phagosomes.
a, GAL3 staining in ATG14+/+ or ATG14−/− iPSDM infected with Mtb WT, ΔesxBA or ΔcpsA. Nuclear staining (blue), GAL3 (green) and Mtb E2-Crimson (red). Scale bars, 10 µm. b. Compiled data from three independent experiments. Results are shown as mean ± s.e.m. One-way ANOVA followed with Šídák’s multiple comparison test ***P < 0.001, **P < 0.002; NS, non-significant. c,d, LC3B staining (top) and quantification (bottom) of ATG14+/+ or ATG14−/− iPSDMs infected with Mtb WT, ΔesxBA or ΔcpsA, 2 h post infection. Mtb in TVS-LC3B-positive (c) or LC3B-positive compartments (d). Nuclear staining (blue), LC3B (green) and Mtb E2-Crimson (red). Scale bars, 10 µm. Data representative from one out of two independent experiments (n = 5 independent fields). Results are shown as mean ± s.e.m. One-way ANOVA followed with Šídák’s multiple comparison test ***P < 0.001, **P < 0.002; NS, non-significant. e, Transmission electron micrographs of Mtb WT or ΔesxBA in distinct subcellular locations in ATG14+/+ or ATG14−/− iPSDMs after 48 h of infection (left) and stereological quantification of the subcellular distribution of Mtb WT and ΔesxBA from TEM images (right). Compiled data from two independent experiments. Scale bars, 500 nm. Source data
Fig. 6
Fig. 6. ATG14 is required for Mtb phagosome maturation.
a, Snapshot of live ATG14+/+ or ATG14−/− iPSDM infected with Mtb WT and ΔesxBA stained with LTR and NucBlue dye. Nuclear staining (blue), LTR (green) and Mtb E2-Crimson (red). Scale bars, 10 µm. b, Quantitative analysis of the LTR association with Mtb as mean fluorescence intensity (MFI). Data representative from one out of two independent experiments (n = 3 independent wells). Results are shown as mean ± s.e.m. One-way ANOVA followed with Šídák’s multiple comparisons test ***P < 0.001, **P < 0.002, *P < 0.033. c, Snapshot of ATG14+/+ or ATG14−/− iPSDM infected with Mtb expressing rv2390::mWasabi,pMSP12::E2-Crimson reporter in the presence or absence BafA1 (BAF). Scale bars. 10 µm. d, Quantitative analysis of rv2390 promoter activity as MFI of mWasabi over E2-Crimson at the indicated timepoints of infection with ATG14+/+ or ATG14−/− iPSDM. Data representative from one out of three independent experiments (n = 3 independent wells). Results are shown as mean ± s.e.m. One-way ANOVA followed with Šídák’s multiple comparisons test ***P < 0.001, **P < 0.002; NS, non-significant. e, Snapshot of ATG14+/+ or ATG14−/− iPSDM infected with Mtb WT, ΔesxBA or ΔcpsA strains expressing rv2390::mWasabi, pMSP12::E2-Crimson reporter at 48 h of infection. Scale bars, 10 µm. f, Quantitative analysis of rv2390 promoter activity as MFI of mWasabi over E2-Crimson in Mtb WT, ΔesxBA or ΔcpsA strains at the indicated time points of infection with ATG14+/+ or ATG14−/− iPSDM. Data representative from one out of two independent experiments (n = 3 independent wells). Results are shown as mean ± s.e.m. Two-way ANOVA followed with Šídák’s multiple comparisons test. ***P < 0.001; NS, non-significant. Source data
Extended Data Fig. 1
Extended Data Fig. 1. Generation and validation of ATG14 and ATG7 knock-out iPSC lines.
a, Schematic representation of the ATG7−/− CRISPR strategy. Brown circles shows the orientation of PAM sequence, and the green lines are indicating the sgRNAs used to target the introns flanking the exon 2 and exon 3 of ATG7. Black arrows are showing the primer (GF2 and GR2) used to genotyping the single clones after targeting. b, c, Representative Western blot of LC3B, p62 and ATG7 in ATG7+/+, ATG7−/− iPSC (b) and iPSDM (c) after starvation in the presence or absence of 100 nM BafA1, 100 nM BafA1 alone or 50 µM monensin for 2 h. d, Schematic representation of the orientation of the ATG14−/− CRISPR strategy. Brown circles are showing the orientation of the PAM sequence and the green lines are indicating the sgRNAs used to target the intron flanking the exon 5 of ATG14. Black arrows are showing the primers (GF1 and GR1) used to genotyping the single clones after targeting. e,f, Representative Western blot of LC3B, p62 and ATG14 in ATG14+/+, ATG14−/− iPSC (e) and iPSDM (f) after starvation in the presence or absence of 100 nM BafA1, 100 nM BafA1 alone or 50 µM monensin for 2 h. Representative Western blots from three independent biological replicates (n = 3). Source data
Extended Data Fig. 2
Extended Data Fig. 2. Characterisation of ATG14 and ATG7 knock-out monocytes and macrophages.
Flow cytometry characterisation of WT, ATG14 and ATG7 KO monocytes and macrophages. Name of the markers are indicated on top of each column of graphs and the genotype of the cells is indicated in the beginning of each row. Pink represents the isotype control and blue the corresponding marker. Source data
Extended Data Fig. 3
Extended Data Fig. 3. Mtb phagocytosis and cell numbers after infection of ATG7−/− iPSDM.
a, Left graph shows the quantitative analysis of Mtb WT or DesxBA area in ATG7−/− or ATG7+/+ iPSDMs 2 h post infection. Right graph shows the percentage of infected cells at 2, 24, 48, 72 and 96 h post infection from the same biological replicate. Data representative from one out of two independent experiments (n = 3 independent wells). Results are shown as mean ± SEM. (b) The graph on the left represents the quantification of Mtb WT or DcpsA area in ATG7−/− or ATG7+/+ iPSDMs 2 h post infection. Right graph shows the percentage of infected cells at 2, 24, 48,72 and 96 h post infection from the same biological replicate. Data representative from one out of two independent experiments (n = 3 independent wells). Results are shown as mean ± SEM. (c) Western blot analysis of ATG7, p62 and LC3B levels in ATG7+/+ and ATG7−/− iPSDMs at 2 h, 24 h or 48 h of infection with Mtb WT, ΔesxBA or ΔcpsA. Representative Western blots from two independent biological replicates (n = 2). Source data
Extended Data Fig. 4
Extended Data Fig. 4. Mtb DcpsA colocalization with p40 Phox during infection.
a, iPSDM were infected with Mtb WT, DcpsA or DcpsA:cpsA for 2 h, 24 h and 48 h and stained for p40 Phox by indirect immunofluorescence. Representative images of p40 Phox recruitment to each strain, at indicated time points. Images are representative of three independent biological replicates. Scale bars: 10 µm. b, Quantitative analysis of p40 Phox recruitment to WT Mtb, DcpsA or DcpsA:cpsA. Data are mean ± SD of three independent biological replicates. One way ANOVA followed with Šídák’s multiple comparisons test *p < 0.033, ns = non-significant. Source data
Extended Data Fig. 5
Extended Data Fig. 5. Mtb phagocytosis and cell numbers after infection of ATG14−/− iPSDM.
a, Left graph shows the quantitative analysis of Mtb WT or DesxBA area in ATG14−/− or ATG14+/+ iPSDMs 2 h post infection. Right graph shows the percentage of infected cells at 2, 24, 48,72 and 96 h post infection from the same biological replicate. Data representative from one out of two independent experiments (n = 3 independent wells). Results are shown as mean ± SEM. (b) The graph on the left represents the quantification of Mtb WT or DcpsA area in ATG14−/− or ATG14+/+ iPSDMs 2 h post infection. Right graph shows the percentage of infected cells at 2, 24, 48,72 and 96 h post infection from the same biological replicate. Data representative from one out of two independent experiments (n = 3 independent wells). Results are shown as mean ± SEM. (c) Western blot analysis of ATG14, p62 and LC3B levels in ATG14+/+ and ATG14−/− iPSDMs at 2 h, 24 h or 48 h of infection with Mtb WT, ΔesxBA or ΔcpsA. Representative Western blots from three independent biological replicates (n = 3). Source data
Extended Data Fig. 6
Extended Data Fig. 6. ATG7 absence does not impact membrane damage or phagosome maturation kinetics.
a, Representative images of endogenous Gal-3 localisation in ATG7+/+ or ATG7−/− iPSDM infected with Mtb WT, Mtb ΔesxBA or Mtb ΔcpsA. Images show nuclear staining (blue), GAL3 (green) and Mtb E2-Crimson (red). Scale bars: 10 µm. b, Manual quantification of Gal-3 association with Mtb WT, Mtb ΔesxBA or Mtb ΔcpsA after 2 h, 24 h or 48 h of infection. Compiled data from 3 independent experiments. Results are shown as mean ± SEM. One-way ANOVA followed with Šídák’s multiple comparison test ***p < 0.001, **p < 0.01, *p < 0.05, ns = non-significant. c, Representative images of ATG7+/+ or ATG7−/− iPSDM infected with Mtb WT and Mtb ΔesxBA stained with LysoTracker and NucBlue dye and imaged in live mode after 2 h and 24 h of infection by high content imaging. Images show nuclear staining (blue), LysoTracker (green) and Mtb E2-Crimson (red). Scale bars: 10 µm. d, Quantitative analysis of the LTR association with Mtb as mean fluorescence intensity. Data representative from one out of two independent experiments (n = 3 independent wells). Results are shown as mean ± SEM. One-way ANOVA followed with Šídák’s multiple comparisons test, ns = non-significant. e, Representative images of ATG14+/+ or ATG14−/− iPSDM infected with Mtb WT, ΔesxBA or ΔcpsA strains expressing rv2390::mWasabi, pMSP12::E2-Crimson reporter in the presence of 100 nM BafA1 at 48 h of infection. f, Quantitative analysis of rv2390 promoter activity in Mtb WT, ΔesxBA or ΔcpsA strains at the indicated time points of infection with ATG14+/+ or ATG14−/− iPSDM in the presence of 100 nM BafA1 was calculated as fold change of mWasabi MFI over E2-Crimson MFI for single bacterial event. Data representative from one out of two independent experiments (n = 3 independent wells). Source data

Comment in

References

    1. Deretic, V. Autophagy in immunity and cell-autonomous defense against intracellular microbes. Immunol. Rev.240, 92–104 (2011). 10.1111/j.1600-065X.2010.00995.x - DOI - PMC - PubMed
    1. Gutierrez, M., Master, S. & Singh, S. Autophagy is a defense mechanism inhibiting BCG and Mycobacterium tuberculosis survival in infected macrophages. Cell119, 753–766 (2004). 10.1016/j.cell.2004.11.038 - DOI - PubMed
    1. Nakagawa, I. et al. Autophagy defends cells against invading group A Streptococcus. Science306, 1037–1040 (2004). 10.1126/science.1103966 - DOI - PubMed
    1. Huang, J. & Brumell, J. H. Bacteria–autophagy interplay: a battle for survival. Nat. Rev. Microbiol.12, 101–114 (2014). 10.1038/nrmicro3160 - DOI - PMC - PubMed
    1. Upadhyay, S. & Philips, J. A. LC3-associated phagocytosis: host defense and microbial response. Curr. Opin. Immunol.60, 81–90 (2019). 10.1016/j.coi.2019.04.012 - DOI - PubMed

Publication types

MeSH terms

Substances