. 2023 Mar;5(3):445-465.
doi: 10.1038/s42255-023-00756-4. Epub 2023 Mar 23.

Loss of fatty acid degradation by astrocytic mitochondria triggers neuroinflammation and neurodegeneration

Affiliations

Loss of fatty acid degradation by astrocytic mitochondria triggers neuroinflammation and neurodegeneration

Yashi Mi et al. Nat Metab. 2023 Mar.

Abstract

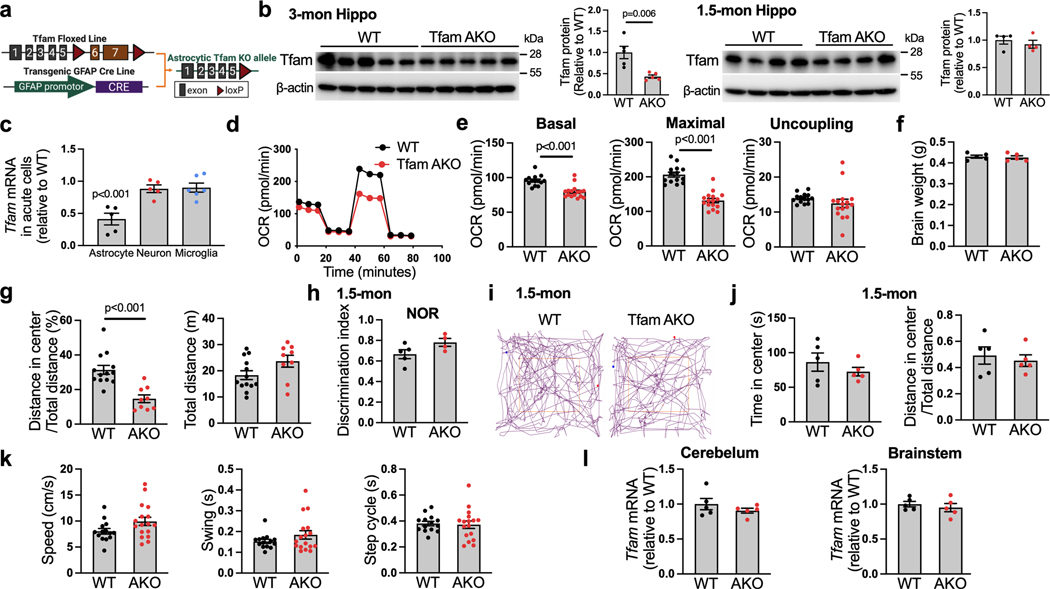
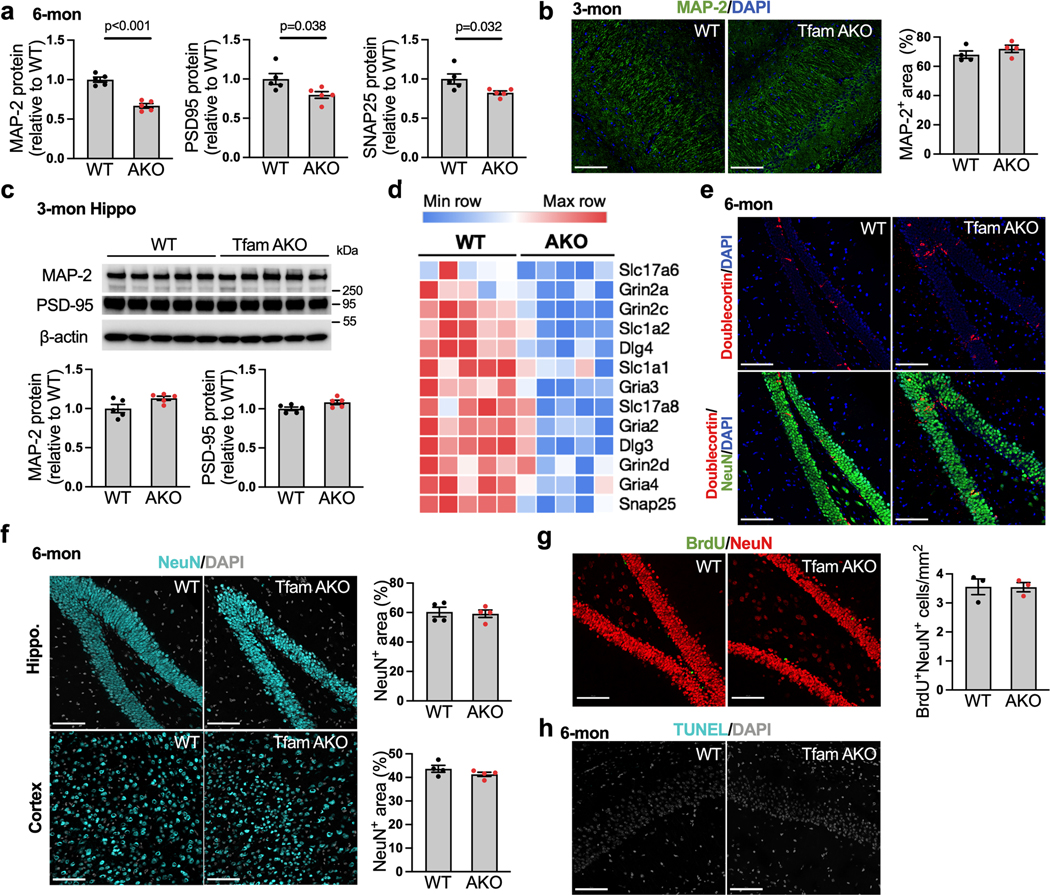
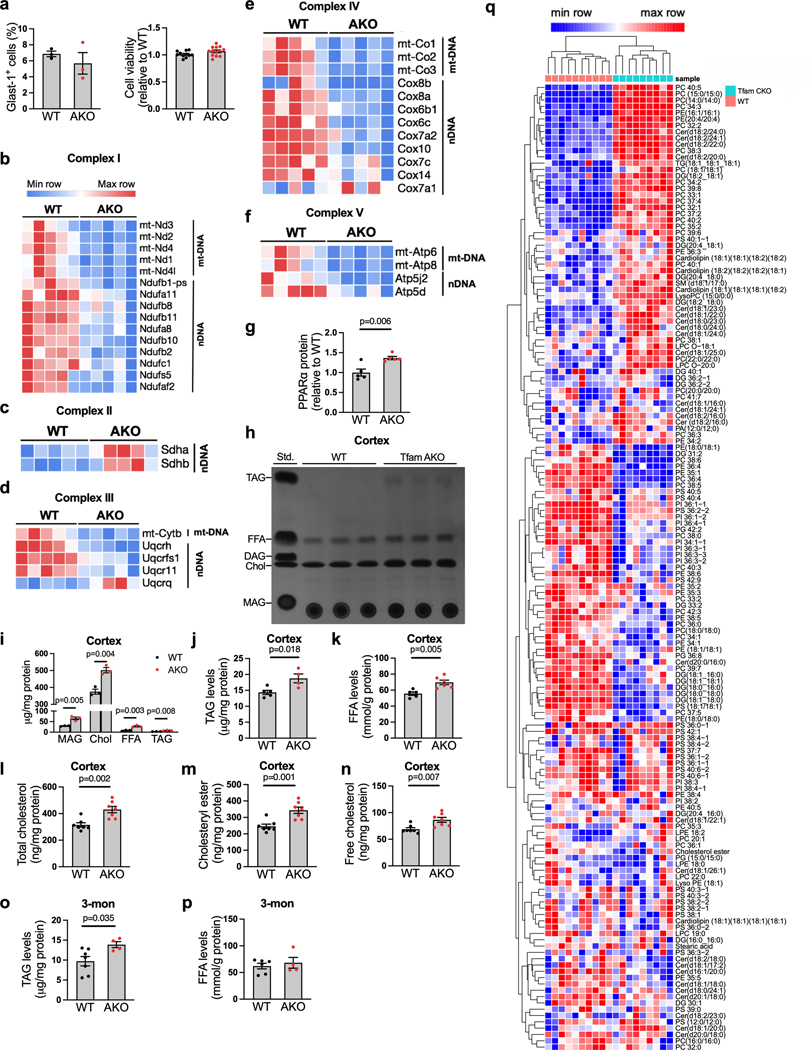
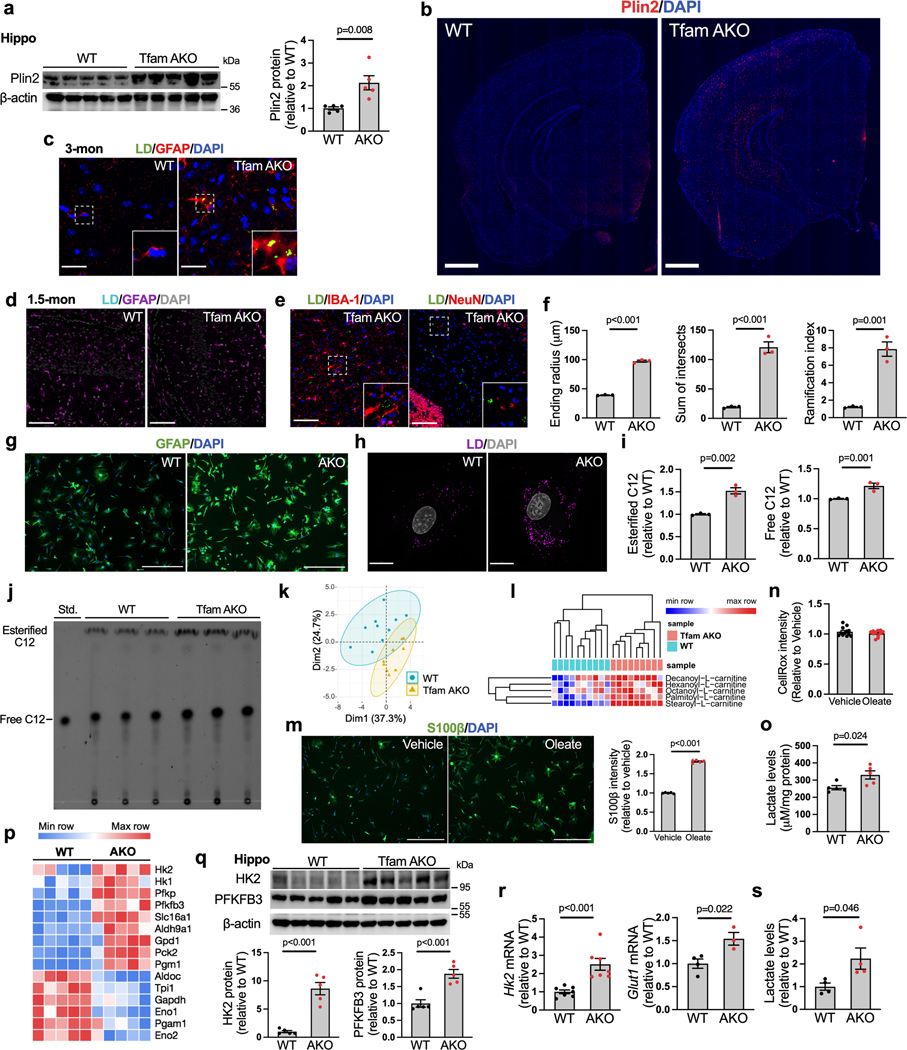
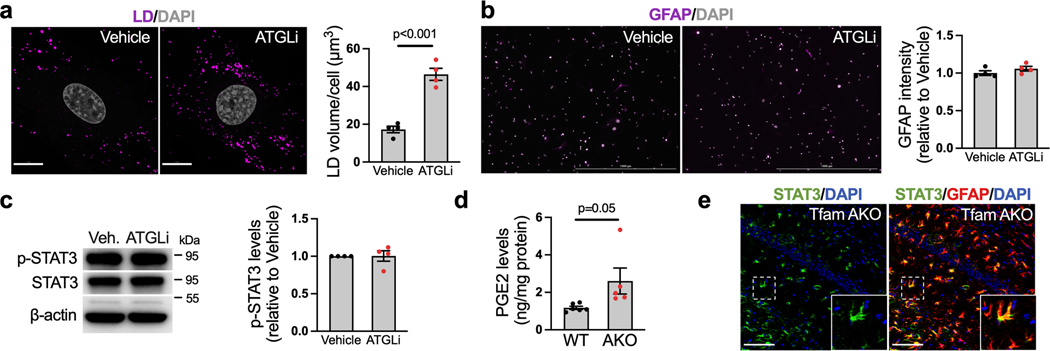
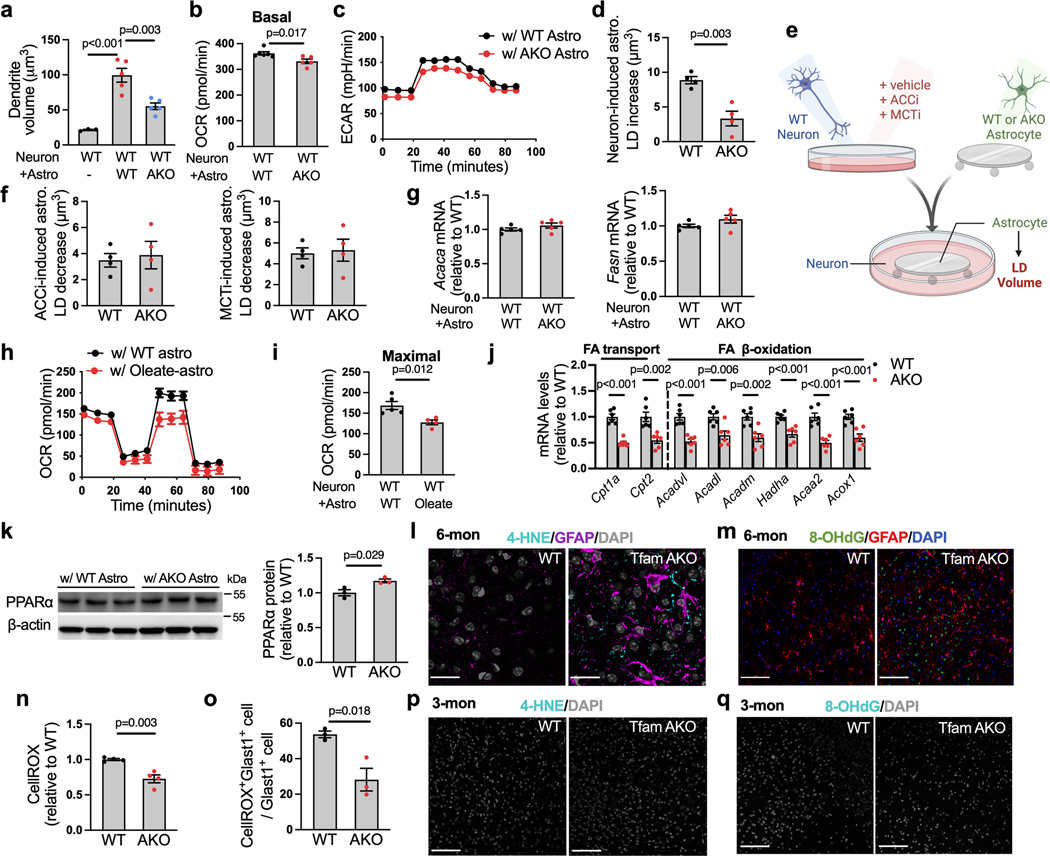
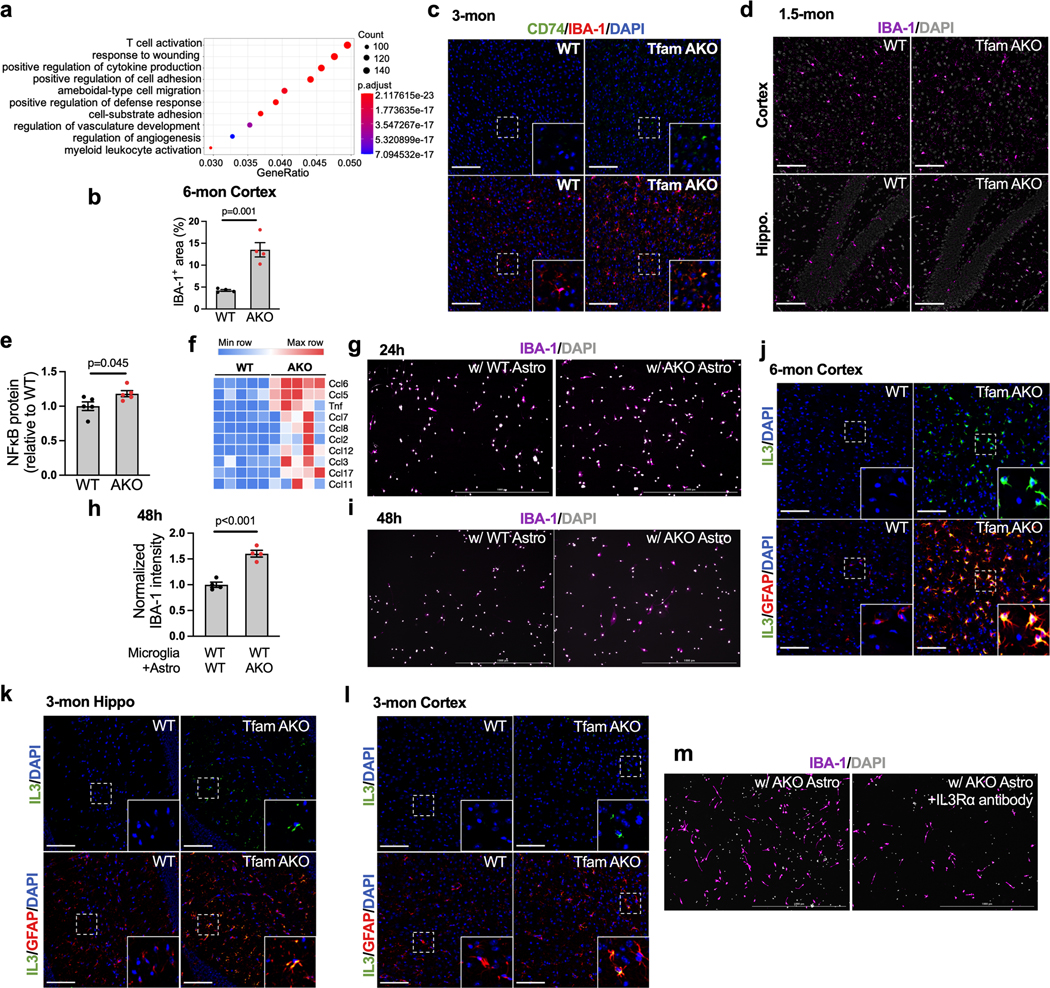
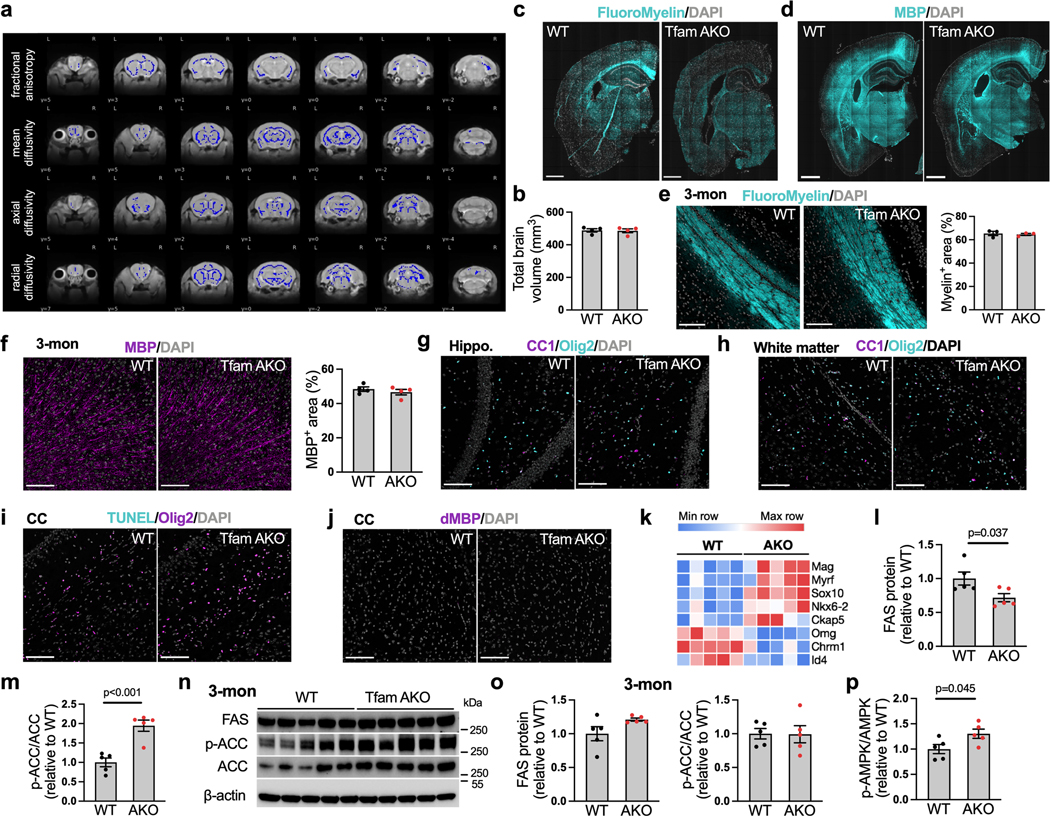
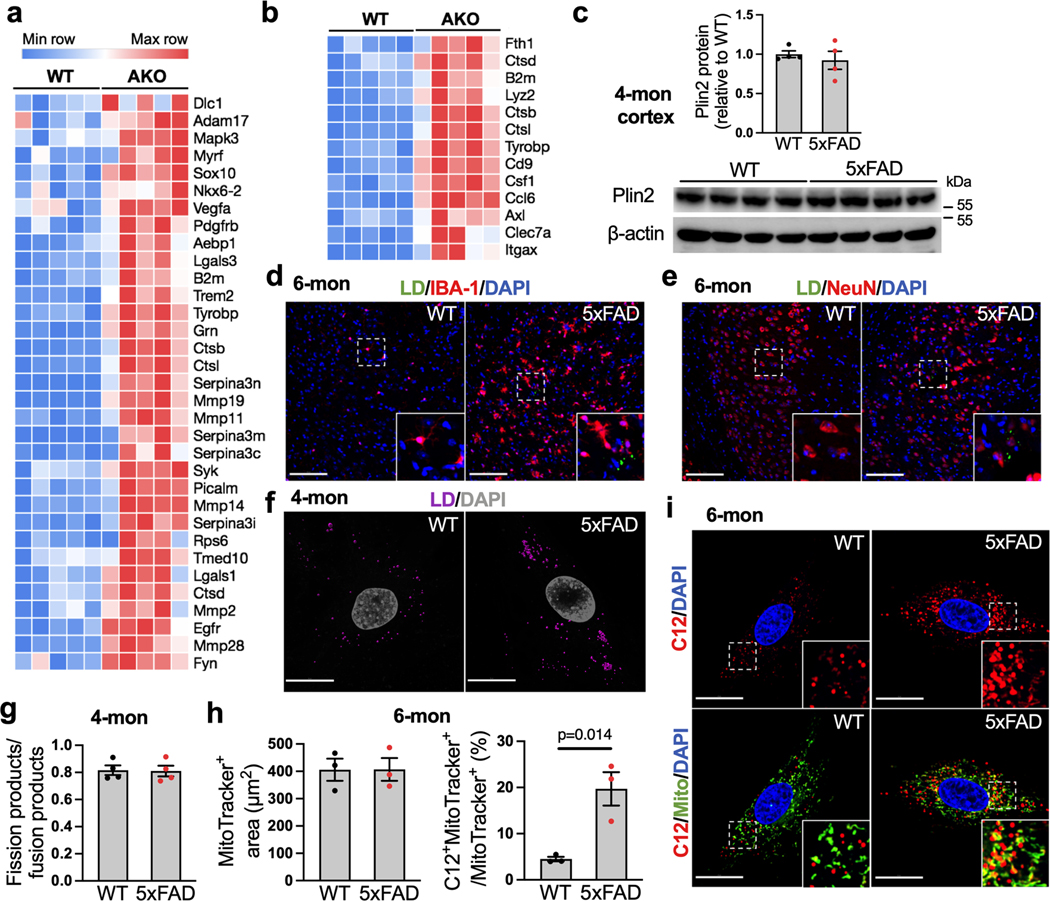
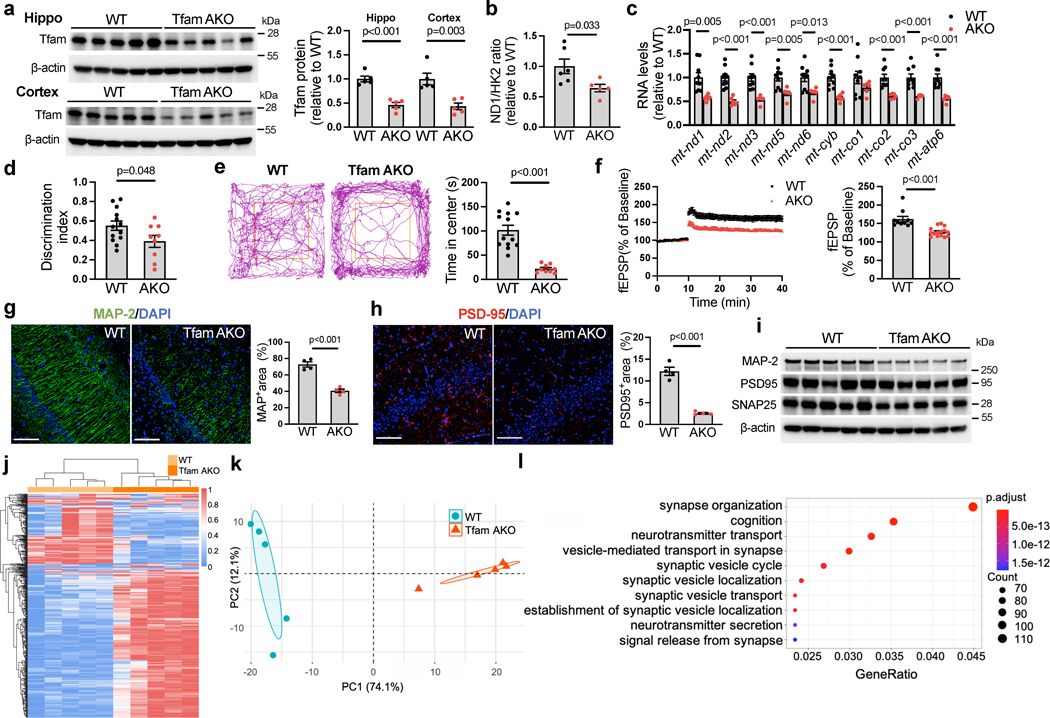
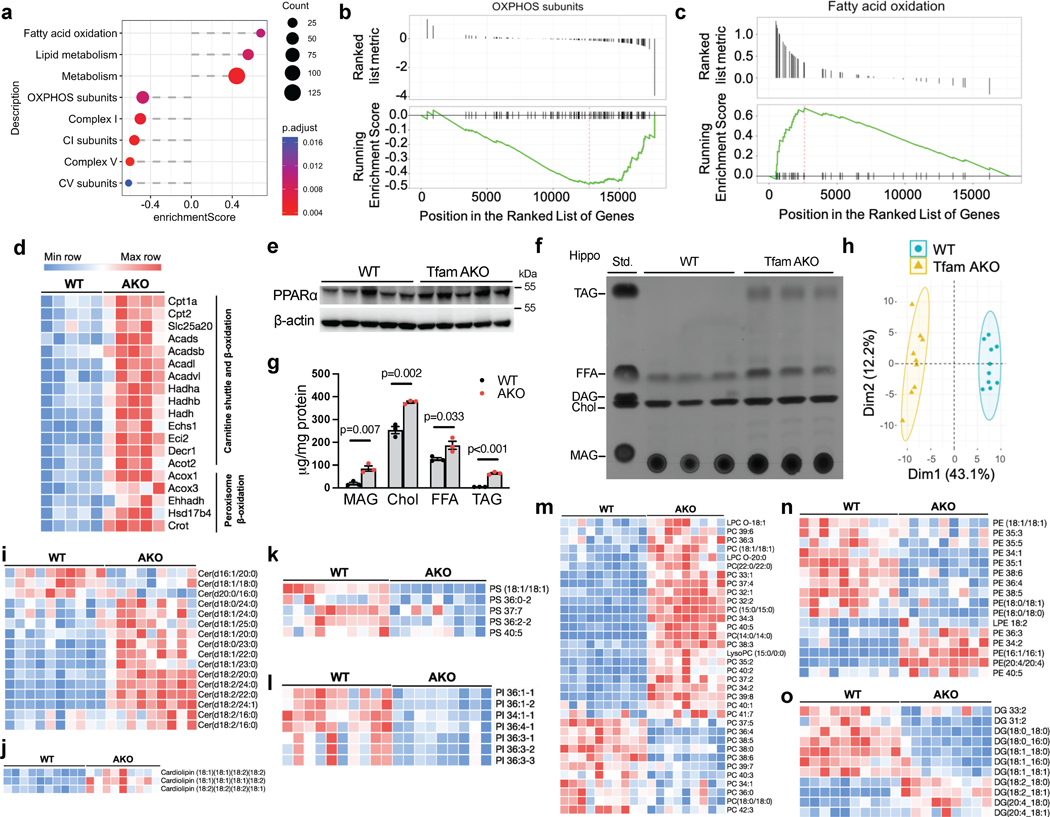
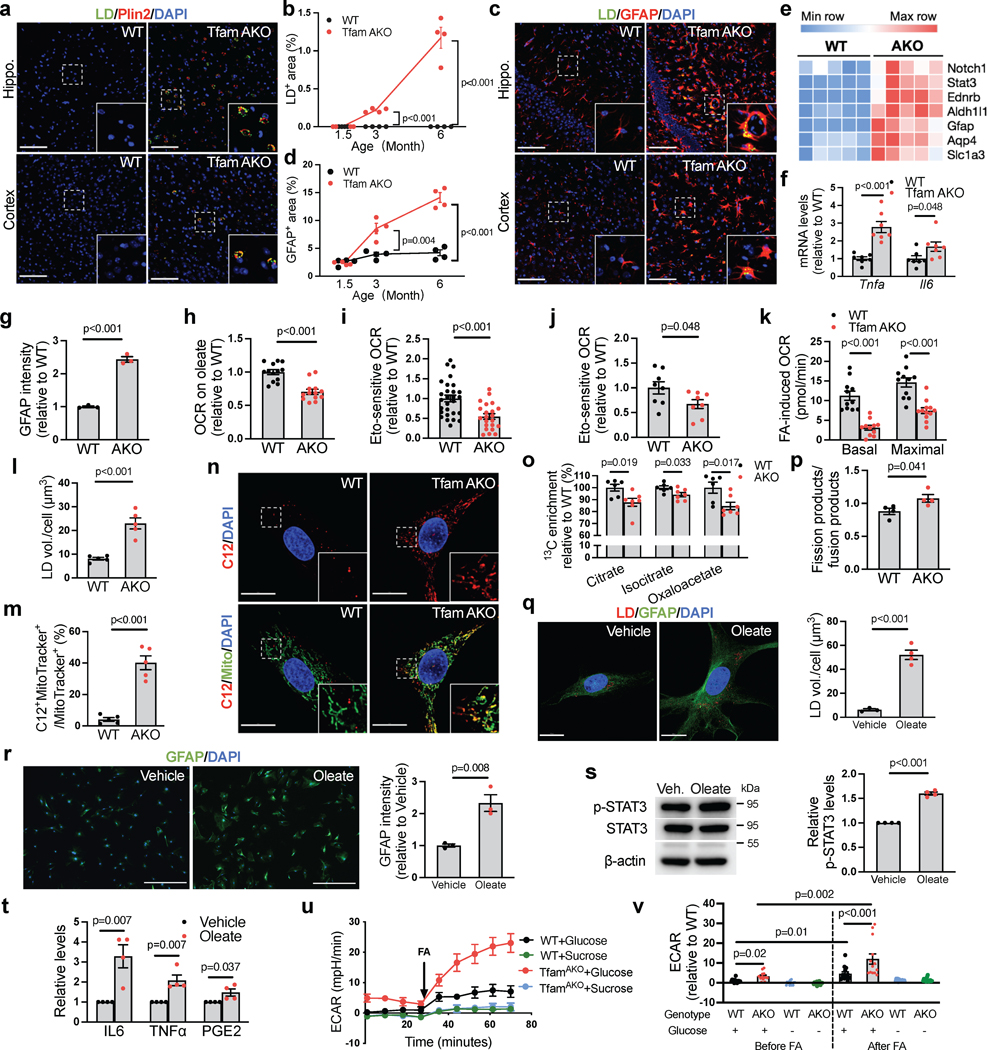
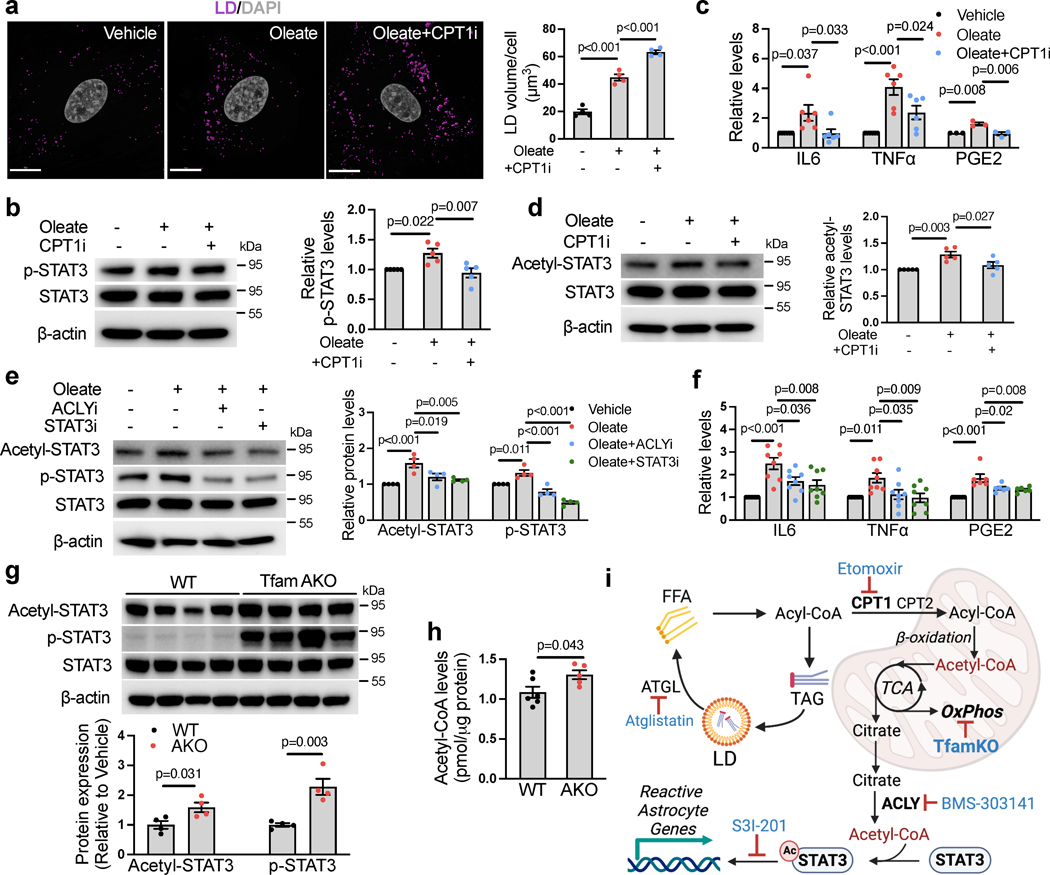
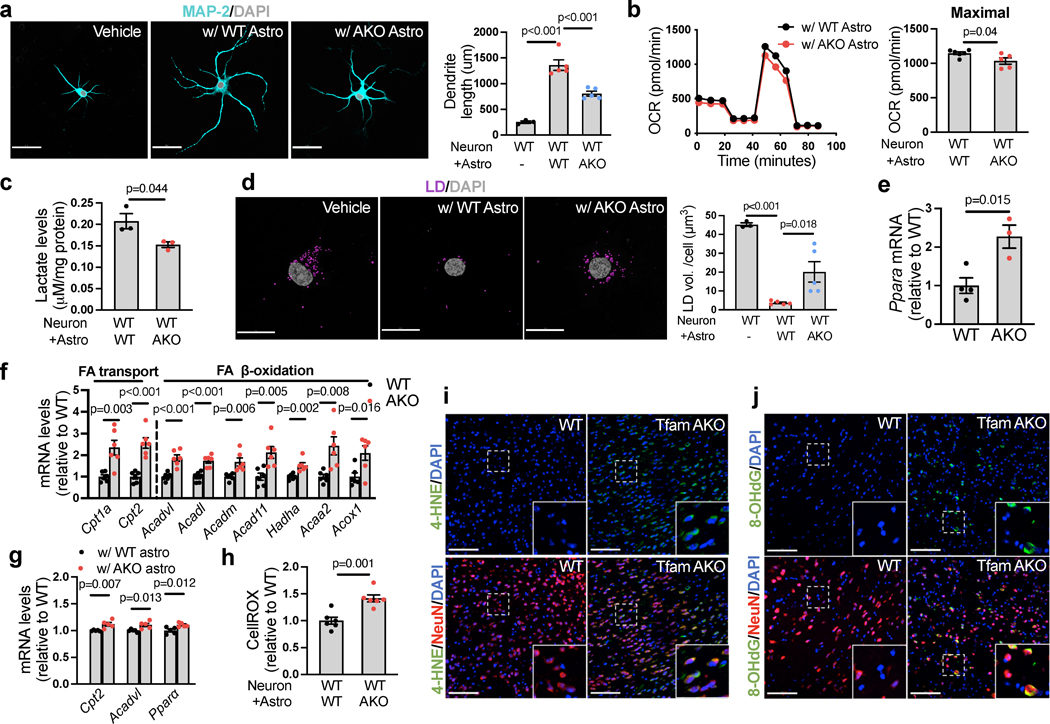
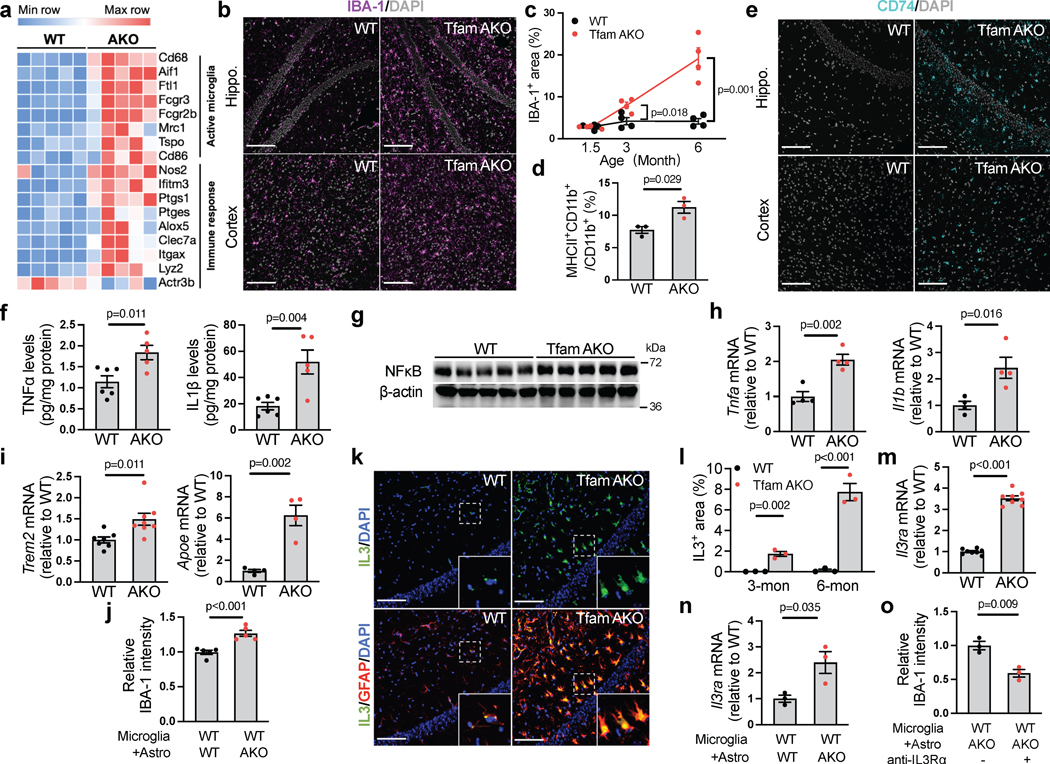
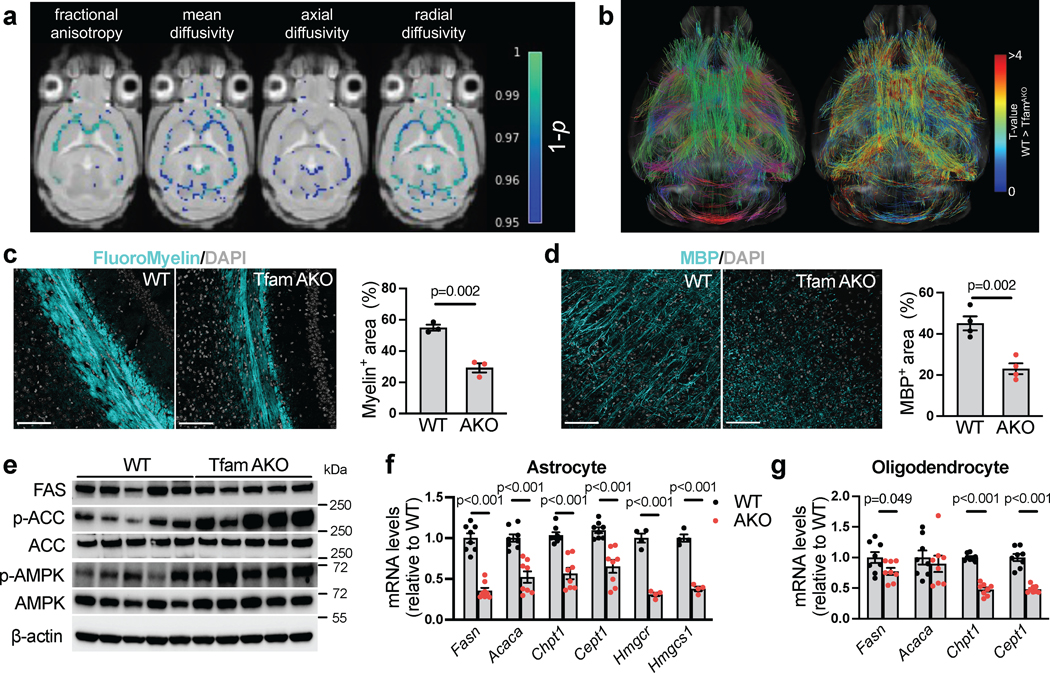
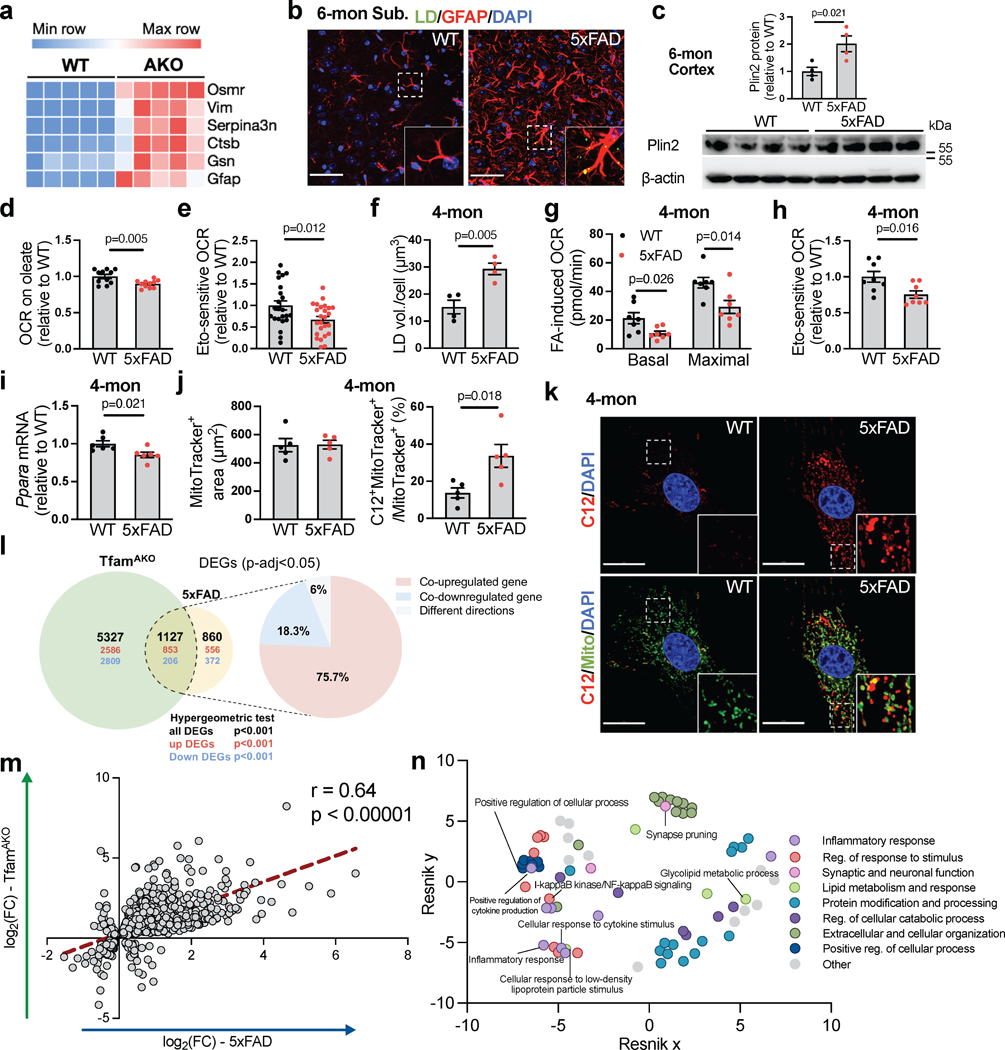
Astrocytes provide key neuronal support, and their phenotypic transformation is implicated in neurodegenerative diseases. Metabolically, astrocytes possess low mitochondrial oxidative phosphorylation (OxPhos) activity, but its pathophysiological role in neurodegeneration remains unclear. Here, we show that the brain critically depends on astrocytic OxPhos to degrade fatty acids (FAs) and maintain lipid homeostasis. Aberrant astrocytic OxPhos induces lipid droplet (LD) accumulation followed by neurodegeneration that recapitulates key features of Alzheimer's disease (AD), including synaptic loss, neuroinflammation, demyelination and cognitive impairment. Mechanistically, when FA load overwhelms astrocytic OxPhos capacity, elevated acetyl-CoA levels induce astrocyte reactivity by enhancing STAT3 acetylation and activation. Intercellularly, lipid-laden reactive astrocytes stimulate neuronal FA oxidation and oxidative stress, activate microglia through IL-3 signalling, and inhibit the biosynthesis of FAs and phospholipids required for myelin replenishment. Along with LD accumulation and impaired FA degradation manifested in an AD mouse model, we reveal a lipid-centric, AD-resembling mechanism by which astrocytic mitochondrial dysfunction progressively induces neuroinflammation and neurodegeneration.


Conflict of interest statement

COMPETING INTERESTS

The authors declare no competing interests.

Figures

Extended Data Fig. 1.
Extended Data Fig. 1.. Astrocytic Tfam deletion-induced neurodegeneration in 6- but not 1.5-month-old mice.
(a) Schematic diagram of the generating of astrocyte specific Tfam knockout allele. (b) Western blots and quantification showing protein levels of Tfam in 3-month and 1.5-month WT and TfamAKO mouse hippocampi. (c) Tfam mRNA levels in neurons, astrocytes, and microglia acutely isolated from 6-month WT and TfamAKO mouse brains. (d and e) Representative mitochondrial stress test performed with primary astrocytes isolated from 6-month WT or TfamAKO mouse brains with sequential injections of mitochondrial inhibitors including oligomycin A, FCCP and rotenone + antimycin A (d); basal, maximal, and uncoupling-linked respiration were shown in e. (f) Brain weight of 6-month WT and TfamAKO mice. (g) The ratio between distance travelled in the center area and total distance travelled for 6-month mice. (h) Discrimination index of 1.5-month WT and TfamAKO mice in NOR test. (i and j) Representative tracks (i) and time spent in the center area (marked by orange squares) and the ratio between distance travelled in the center and total distance travelled (j) for 1.5-month WT and TfamAKO mice. (k) Speed, LF swing, and LF step cycle of 6-month WT and TfamAKO mice in CatWalk tests. (l) Tfam mRNA levels in the cerebellum and brainstem of 6-month mice. n = 5 (3-mon) or 4 (1.5-mon) mice (b); n = 5 (astrocyte and neuron) or 6 (microglia) mice (c); n = 14 (WT) or 16 (AKO) wells (d,e); n = 5 mice (f, j, l); n = 13 (WT) or 9 (AKO) mice (g); n = 5 (WT) or 4 (AKO) mice (h); n = 14 (WT) or 17 (AKO) mice (k). Bar graphs are presented as mean ± SEM. Two-sided unpaired t-test was used for all comparisons.
Extended Data Fig. 2.
Extended Data Fig. 2.. TfamAKO has no effect on neurogenesis or neuronal death, and synaptic deficits occur after 3-month-of-age.
(a) Densitometric analyses of MAP-2, PSD95, and SNAP25 protein expression in the hippocampus of 6-month mice (Fig. 1i). (b) Representative images and quantification of MAP-2-positive area in hippocampal sections of 3-month mice. (c) Western blots and quantifications showing protein expression of MAP-2 and PSD-95 in 3-month mouse hippocampi. (d) Heatmap showing DEGs (FDR-corrected p < 0.05) related to synaptic function from RNAseq data of 6-month mouse hippocampi. (e) Representative images showing the hippocampal area of brain sections of 6-month mice co-stained for NeuN and Doublecortin. (f) Representative images and quantification for NeuN+ areas of the hippocampus and cortex of 6-month mouse brains. (g) Representative images and quantification of BrdU+NeuN+ cells in dentate gyrus of 6-month mouse brains. n = 5 (a, c), 4 (b, f), or 3 (g) mice. Bar graphs are presented as mean ± SEM. Two-sided unpaired t-test was used for all comparisons. Scale bars, 100 μm (b, e, f, g, h).
Extended Data Fig. 3.
Extended Data Fig. 3.. Lipid dyshomeostasis in TfamAKO mouse brains.
(a) Glast-1 positive rate of isolated brain cells by flow cytometry (left) and cell viability of primary astrocytes from 6-month WT and TfamAKO mice. (b-f) Heatmaps of DEGs (FDR-corrected p < 0.05) of mitochondrial complexes I (b), II (c), III (d), IV (e) and V (f) that are encoded by either mtDNA or nuclear DNA (nDNA) in 6-month mouse hippocampi. (g) Densitometric analyses of PPARα protein in 6-month WT and TfamAKO hippocampus (Fig. 2e). (h and i) TLC assay showing altered levels of major classes of lipid species in 6-month mouse cortices (h), which are quantified by normalizing to protein concentrations (i). Std., standard mix. (j and k) Total TAG (j) and FFA (k) levels in 6-month mouse cortices measured by fluorometric assays. (l-n) Cortical levels of total cholesterol, cholesteryl ester, and free cholesterol of 6-month mice. (o and p) Total TAG (o) and FFA (p) levels in 3-month mouse cortices measured by fluorometric assays. (q) Heatmap of all 153 lipid species detected by the targeted lipidomic panel in 6-month mouse cortices. n = 3 (a-left, i), 5 (g), or 7 (l-n) mice; n = 11 (WT) or 14 (AKO) independent samples (a-right); n = 5 (WT) or 4 (AKO) mice (j); n = 5 (WT) or 6 (AKO) mice (k); n = 7 (WT) or 4 (AKO) mice (o); n = 6 (WT) or 4 (AKO) mice (p). Bar graphs are presented as mean ± SEM. Two-sided unpaired t-test was used for all analyses.
Extended Data Fig. 4.
Extended Data Fig. 4.. Lipid accumulation and metabolic shift in astrocytic FA degradation-deficient brains.
(a) Western blots and quantification showing Plin2 expression in 6-month WT and TfamAKO mouse hippocampi. (b) Representative Montage images of Plin2 staining of coronal brain sections of 6-month mice. (c) Representative images of hippocampal sections of 3-month mice stained for LD and GFAP. (d) Representative images of hippocampal sections of 1.5-month mice stained for LD and GFAP. (e) Representative images of hippocampal sections of 6-month mice stained for LD and IBA-1 (left) or LD and NeuN (right). (f) Sholl analysis, including ending radius, sum of intersects, and ramification index, of astrocytes (GFAP stained) in the hippocampus of 6-month mouse brains. (g) Representative GFAP staining images of cultured astrocytes from 6-month WT or TfamAKO mice. (h) Representative images of LD staining of 6-month primary astrocytes. (i and j) Quantification (i) and fluorescent TLC image (j) of esterified and free BODIPY-C12 from pulse-chase assay with 6-month primary astrocytes. Std., BODIPY-C12 standard. (k) PCA plot of cortical acylcarnitine profiles of 6-month WT and TfamAKO mice. (l) Heatmap of significantly changed acylcarnitines in 6-month WT vs. TfamAKO cortices. (m) Representative images and quantification of S100β immunostaining of vehicle- or oleate-treated 6-month WT astrocytes. (n) Relative CellROX intensity in oleate treated WT astrocytes. (o) Lactate levels in 6-month mouse cortices. (p) Heatmap of DEGs involved in glycolysis in 6-month mouse hippocampi. (q) Western blots and quantification of HK2 and PFKFB3 expression in 6-month mouse hippocampi. (r) mRNA levels of Hk2 and Glut1 in astrocytes acutely isolated from 6-month mice. (s) Lactate levels in cultured astrocytes from 6-month WT and TfamAKO mice. n = 5 (a, m, o, q), 3 (f, i), or 4 (s) mice; n = 12 independent samples (n); n = 7 (Hk2), 4 (Glut1-WT), or 3 (Glut1-AKO) mice (r). Bar graphs are presented as mean ± SEM. Two-sided unpaired t-test was used for all comparisons. Scale bars, 1000 μm (b), 500 μm (g, m); 100 μm (d, e); 20 μm (c); 15 μm (h).
Extended Data Fig. 5.
Extended Data Fig. 5.. LD accumulation is insufficient to induce astrocyte reactivity.
(a) Representative images and qualification of LD volumes in 6-month WT astrocytes treated with 10 μM atglistatin for 24 h. (b) Representative GFAP staining images and intensity (normalized to cell counts) of 6-month WT astrocytes treated with 10 μM atglistatin for 24 h. (c) Representative western blots and quantification of p-STAT3Tyr705 in 6-month WT astrocytes treated with 10 μM atglistatin for 24 h. (d) PGE2 levels in the cortex of 6-month WT and TfamAKO mice. (e) Representative images of hippocampal section of 6-month TfamAKO mouse showing that STAT3 is predominantly localized to GFAP+ astrocytes. n = 4 mice (a, b, c); n = 6 (WT) or 5 (AKO) mice (d). Bar graphs are presented as mean ± SEM. Two-sided unpaired t-test was used for all comparisons. Scale bars, 1000 μm (b); 100 μm (e); 15 μm (a).
Extended Data Fig. 6.
Extended Data Fig. 6.. Loss of OxPhos diminishes astrocytic support to neurons and induces neuronal oxidative stress.
(a) Neurite volume of WT neurons cultured alone or with 6-month astrocytes. (b) Basal OCR of WT neurons cultured with 6-month astrocytes. (c) ECAR of WT neurons cocultured with 6-month astrocytes. (d) Increases in LD volume for WT or TfamAKO astrocytes cocultured with WT neurons relative to these astrocytes cultured alone. (e) Design for data in (f). WT neurons pretreated with vehicle, MCTi (AR-C155858) or ACCi (ND630) were cultured with WT or TfamAKO astrocytes. Astrocytes were stained for LD (image created with BioRender.com). (f) Reductions in LD volume in WT or TfamAKO astrocytes induced by neuronal MCTi (left) or neuronal ACCi (right). Presented values were calculated as: LD volume in astrocytes cocultured with vehicle-pretreated neurons – LD volume in genotype-matched astrocytes cocultured with ACCi- or MCTi-pretreated neurons. (g) mRNA levels of Acaca and Fasn in WT neurons cocultured with 6-month astrocytes. (h and i) OCR of WT neurons cocultured with 6-month oleate-BSA-treated WT astrocytes. (j) mRNA levels of genes involved in FA transport and β-oxidation in acute 6-month astrocytes. (k) Protein levels of PPARα in WT neurons cultured with 6-month astrocytes. (l and m) Representative images of hippocampal sections of 6-month mice co-stained for 4-HNE and GFAP or 8-OHdG and GFAP. (n) Relative CellROX intensity in cultured 6-month astrocytes. (o) CellROX positive rate of Glast1+ astrocytes in 6-month brains by flow cytometry analysis. (p and q) Representative images of hippocampal sections of 3-month mice stained for 4-HNE (p) or 8-OHdG (q). n = 3 (no-astrocyte) or 5 (+WT and +AKO) independent samples (a); n = 6 (WT) or 5 (AKO) independent samples (b, c); n = 4 (d, f), 5 (g), 6 (j), 3 (k, o), or 4 (n) independent samples; n = 5 (+WT) or 4 (+Oleate) independent samples (h, i). Bars are presented as mean ± SEM. Two-sided unpaired t-test was used except for a, where one-way ANOVA with post-hoc Tukey test was used. Scale bars, 100 μm (m, p, q); 25 μm (l).
Extended Data Fig. 7.
Extended Data Fig. 7.. Microglial activation and neuroinflammation are induced by astrocytes with OxPhos deficit via IL-3 signaling.
(a) Top 10 GO Biological Processes enriched in 6-month TfamAKO hippocampi compared to WT mice. (b) IBA-1 positive area in cortical sections of 6-month WT and TfamAKO mouse brains. (c) Representative images of hippocampal sections of 3-month WT and TfamAKO mice stained for CD-74 and IBA-1. (d) Representative images of hippocampal and cortical sections of 1.5-month mice stained for IBA-1. (e) Densitometric analysis of NFκB protein levels in 6-month mouse hippocampi (Fig. 6g). (f) Heatmap showing DEGs (FDR-corrected p < 0.05) encoding cytokines in 6-month mouse hippocampi. (g) Representative images of IBA-1 staining of WT primary microglia (on coverslips in 6-well plates) cocultured with WT or TfamAKO astrocytes (in 6-well inserts) for 24 h. (h and i) Quantification (h) and representative images (i) of IBA-1 intensity (normalized to cell count) in WT primary microglia cultured with WT or TfamAKO astrocytes for 48 h. (j) Representative images of cortical sections of 6-month WT and TfamAKO mice stained for IL-3 and GFAP. (k and l) Representative images of hippocampal (k) and cortical (l) sections of 3-month WT and TfamAKO mice stained for IL-3 and GFAP. (m) Representative images of WT primary microglia (on coverslips in 6-well plates) pretreated with vehicle or IL-3Rα neutralizing antibody, cocultured with TfamAKO astrocytes (in 6-well inserts) for 24 h and then stained for IBA-1. n = 4 (b, h) or 5 (e) mice or independent samples. Bar graphs are presented as mean ± SEM. Two-sided unpaired t-test was used for all comparisons. Scale bars, 1000 μm (g, i, m); 100 μm (c, d, j, k, l).
Extended Data Fig. 8.
Extended Data Fig. 8.. Loss of myelin integrity and suppressed lipid synthesis in TfamAKO brains.
(a) Voxel-wise analyses of fractional anisotropy, mean-, axial-, and radial diffusivity of coronal slices on the study specific template. Blue voxels identify statistically significant TfamAKO < WT voxels (family-wise error corrected p < 0.05) for each index. (b) Total brain volume of 6-month WT and TfamAKO mice. (c and d) Representative Montage images of 6-month WT and TfamAKO mouse coronal sections stained for FluoroMyelin and MBP. (e) Representative images and quantification of FluoroMyelin staining of the corpus callosum area of 3-month brain sections. (f) Representative images and quantification of 3-month cortical sections stained for MBP. (g and h) Representative images of the hippocampus (g) or white matter (h) areas of 6-month brain sections stained for CC1 and Olig2. (i and j) Representative images of corpus callosum (CC) of 6-month brain sections stained for TUNEL and Olig2 and dMBP. (k) Heatmap showing DEGs (FDR-corrected p < 0.05) that are positive (Mag, Myrf, Sox10, Nkx6–2, Ckap5) and negative (Omg, Chrm1, and Id4) regulators of myelination in 6-month mouse hippocampi. (l and m) Densitometric analysis of FAS and p-ACC/ACC levels in 6-month mouse hippocampi (Fig. 7e). (n and o) Western blots and quantification showing protein expression of FAS, p-ACC, and ACC in 3-month mouse hippocampi. (p) Densitometric analysis of p-AMPK/AMPK ratio in 6-month mouse hippocampi (Fig. 7e). n = 4 (b, f), 3 (e), or 5 (l, m, o, p) mice. Bar graphs are presented as mean ± SEM. Two-sided unpaired t-test was used for all comparisons. Scale bars, 1000 μm (c and d); 100 μm (e, f, g, h, i, j).
Extended Data Fig. 9.
Extended Data Fig. 9.. Impaired FA degradation, LD accumulation, and TfamAKO-induced transcriptional signatures are resembled in a mouse model of AD.
(a and b) Heatmaps showing AD-related (a) and DAM (b) DEGs (FDR-corrected p < 0.05) in 6-month mouse hippocampi. (c) Western blot and quantification showing protein levels of Plin2 in 4-month WT and 5xFAD mouse cortices. (d and e) Representative images showing the subiculum area of 6-month WT or 5xFAD mouse brain sections stained for LD and IBA-1 (d) or LD and NeuN (e) suggest no localization of LD to neuron or microglia. (f) Representative images of LDs in primary astrocytes isolated from 4-month WT or 5xFAD mouse brains (quantified in Fig. 8f). (g) The ratio of fission to fusion products in cultured astrocytes from 4-month WT or 5xFAD mice by subtype analysis of mitochondria reticulum images. (h and i) Quantification and representative images of BODIPY-C12 localized to mitochondria (MitoTracker+) in primary astrocytes from 6-month WT or 5xFAD mice. n = 4 (c, g) or 3 (h) mice. Bar graphs are presented as mean ± SEM. Two-sided unpaired t-test was used for all comparisons. Scale bars, 100 μm (d, e); 20 μm (f, i).
Fig. 1.
Fig. 1.. Astrocyte-specific Tfam deletion induces cognitive impairment and neurodegeneration.
(a) Protein levels of Tfam in the hippocampus and cortex of 6-month-old WT and TfamAKO mice. (b) mtDNA copy numbers in the hippocampus of 6-month-old mice. (c) Levels of mtDNA-encoded transcripts of complexes I, III, IV and V in the cortex of 6-month-old mice. (d) Discrimination index of 6-month-old mice by the novel object recognition (NOR) test. (e) Representative 5-minute tracks and the time spent in the center area (marked by the orange squares) from the open field test of 6-month-old mice. (f) Recorded fEPSP slopes of hippocampal slices from 6-month-old mice normalized to the pre-tetanus baseline (left) and LTP quantified using %fEPSP for the last 5 min of the response to TBS stimulation (right). n = 10–15 slices from 4 mice per group. (g and h) Representative images and quantifications (positive area %) of 6-month-old mouse hippocampus sections stained for MAP-2 (g) and PSD95 (h). (i) Western blots showing protein expression of MAP-2, PSD95, and SNAP25 in 6-month-old mouse hippocampi (quantified in Extended Data Fig. 2a). (j and k) Heatmap (j) and PCA plot (k) showing the expression of top 500 variant genes in the hippocampus of 6-month WT and TfamAKO mice. (l) Top 10 GO Biological Processes enriched in 6-month WT hippocampus compared to that of TfamAKO mice. n = 5 (a, k) or 4 (g and h) mice; n = 6 (WT) or 5 (AKO) mice (b); n = 9 (WT) or 6 (AKO) mice (c); n = 13 (WT) or 9 (AKO) mice (d, e); n = 10 (WT) or 15 (AKO) slices from 4 mice (f). Bar graphs are presented as mean ± SEM. Two-sided unpaired t-test was used for all comparisons. Scale bars, 100 μm (g and h).
Fig. 2.
Fig. 2.. Aberrant astrocytic OxPhos disrupts brain lipid homeostasis
(a) GSEA identified significantly enriched (enrichment score > 0) or underrepresented (enrichment score < 0) mitochondrial pathways in 6-month TfamAKO mouse hippocampi relative to WT. (b and c) GSEA plots showing enrichment profiles of OXPHOS genes (b) and FAO genes (c). (d) Heatmap showing DEGs (FDR-corrected p < 0.05) related to mitochondrial and peroxisomal β-oxidation in 6-month mouse hippocampi. (e) Western blots showing increased levels of PPARα in 6-month TfamAKO hippocampi (quantified in Extended Data Fig. 3g). (f and g) TLC assay showing altered levels of major lipid classes in 6-month mouse hippocampi (f), which are quantified by normalizing to protein concentrations (g). Std., standard mix. (h) PCA plot of hippocampal lipidomic profile of 6-month WT and TfamAKO mice. (i-o) Heatmaps of the levels of different classes of lipid species that are significantly changed in 6-month TfamAKO vs. WT cortices, including ceramide (i), cardiolipin (j), PS (k), PI (l), PC (m), PE (n), and DAG (o). n = 3 mice (g); n = 10 (WT) or 9 (AKO) mice (h). Bar graphs are presented as mean ± SEM. Two-sided unpaired t-test was used for all comparisons.
Fig. 3.
Fig. 3.. Loss of astrocytic FA degradation leads to LD accumulation and reactive astrogliosis.
(a) Representative images of 6-month hippocampal or cortical staining for Plin2 and LD. (b) Quantification of LD+ area in hippocampal sections. (c) Representative images of hippocampal and cortical sections of 6-month mice. (d) Quantification of GFAP+ area in hippocampal sections. (e) Heatmap of reactive astrocyte DEGs in 6-month hippocampi. (f) Tnfa and Il6 mRNA levels in acute 6-month astrocytes. (g) GFAP intensity of cultured 6-month astrocytes. (h) Relative OCR of 6-month acute hippocampal slices on oleate-BSA. (i) Etomoxir-induced OCR decreases of 6-month acute hippocampal slices. (j) Etomoxir-induced OCR decreases of cultured 6-month astrocytes. (k) FA-induced basal and maximal OCRs in 6-month astrocytes presented as differences in the presence and absence of exogenous FA. (l) LD volume in cultured 6-month astrocytes. (m and n) Quantification and representative images of BODIPY-C12 localized to mitochondria in 6-month astrocytes. (o) 13C enrichment of TCA metabolites in astrocytes incubated with U-13C-oleate. (p) Ratio of mitochondrial fission to fusion products in 6-month astrocytes. (q) Representative images and quantification of LDs in 6-month WT astrocytes treated with oleate-BSA. (r) Representative images and quantification of GFAP intensity of WT astrocytes after oleate-BSA treatment. (s) Levels of p-STAT3Tyr705 in oleate-BSA-treated WT astrocytes. (t) Medium IL-6, TNFα, and PGE2 levels of oleate-BSA-treated WT astrocytes. (u and v) Representative ECAR curves and quantification of acute hippocampal slices before and after FA addition under glycemic or aglycemic conditions. n = 4 (b, d, p, s, t), 7 (f), 3 (g, r), 5 (l, m), 6 (o-WT), 7 (o-AKO), 3 (q-WT), or 4 (q-AKO) mice; n = 13 (h), 28 (i-WT), 22 (i-AKO) slices; n = 8 (j) or 11 (k) independent samples; n = 14 (WT-glucose), 13 (AKO-glucose), 14 (WT-sucrose), 15 (AKO-sucrose) slices (u,v). Bars and plots are presented as mean ± SEM. Two-sided unpaired t-test was used for all comparisons except for the comparisons before and after FA injections in v, where two-sided paired t-test was used. Scale bars, 500 μm (r); 100 μm (a and c); 25 μm (q); 20 μm (n).
Fig. 4.
Fig. 4.. Acetylation of STAT3 mediates FA- and TfamKO-induced astrocyte reactivity
(a) Representative images and qualification of LD volumes in WT astrocytes treated with BSA (vehicle) or 150 μM oleate-BSA for 24 h with or without pretreatment of 10 μM etomoxir (CPT1i). (b) Representative western blots and quantification of p-STAT3Tyr705 in BSA- or oleate-BSA-treated astrocytes with or without CPT1i pretreatment. (c) IL-6, TNFα, and PGE2 levels in culture medium of BSA- or oleate-BSA-treated astrocytes with or without CPT1i pretreatment. (d) Representative western blots and quantification of acetyl-STAT3Lys685 in BSA- or oleate-BSA-treated astrocytes with or without CPT1i pretreatment. (e) Representative western blots and quantification of acetyl-STAT3Lys685 and p-STAT3Tyr705 in astrocytes treated with BSA or 150 μM oleate-BSA for 24 h with or without pretreatment of 50 μM BMS-303141(ACLYi) or 50 μM S3I-201 (STAT3i). (f) IL-6, TNFα, and PGE2 levels in culture medium of BSA- or oleate-BSA-treated astrocytes with or without ACLYi or STAT3i pretreatment. (g) Western blots and quantifications of acetyl-STAT3Lys685 and p-STAT3Tyr705 levels in the hippocampus of 6-month WT and TfamAKO mice. (h) Acetyl-CoA levels in the cortex of 6-month WT and TfamAKO mice. (i) Schematic representation of the mechanism by which Tfam deletion or exogenous FA induce astrocyte reactivity; key components and inhibitors involved are shown (image created with BioRender.com). n = 4 (a, e, g) or 5 (b and d) mice; n = 6 (IL6 and TNFα) or 3 (PGE2) mice (c); n = 8 (IL6 and TNFα) or 6 (PGE2) mice (f); n = 6 (WT) or 5 (AKO) mice (h). Bar graphs are presented as mean ± SEM. Two-sided unpaired t-test (g and h) and one-way ANOVA with post-hoc Tukey test (a-f) was used. Scale bar, 15 μm (a).
Fig. 5.
Fig. 5.. Impaired astrocytic FA degradation diminishes neurotrophic support and triggers neuronal FAO and oxidative stress.
(a) Representative images of WT hippocampal neurons cultured alone (on coverslips in 6-well plates) or cocultured with WT or TfamAKO astrocytes (in 6-well inserts) for 7 days and immunostained for MAP-2 with neurite length quantified. (b) Mito Stress Test of WT neurons (in 24-well Seahorse plate) cultured with WT or TfamAKO astrocytes (in 24-well insert) for 7 days with quantifications of maximal respiration (after FCCP injection) shown. (c) Lactate levels in WT neurons (in 6-well plates) cultured with WT or TfamAKO astrocytes (in 6-well inserts) for 7 days. (d) Representative images and qualification of LD volumes in WT neurons cultured alone or with WT or TfamAKO astrocytes for 7 days. (e) mRNA levels of Ppara in neurons acutely isolated from 6-month mouse brains. (f) mRNA levels of genes involved in FA transport and FAO in neurons acutely isolated from 6-month mouse brains. (g) mRNA levels of Cpt2, Acadvl, and Ppara in WT neurons cultured with WT or TfamAKO astrocytes for 7 days. (h) Relative ROS levels (CellROX intensity) in WT neurons (in 6-well plates) cultured with WT or TfamAKO astrocytes (in 6-well inserts) for 7 days. (i and j) Representative images of hippocampal sections of 6-month WT and TfamAKO mice stained for NeuN and 4-HNE (i) or NeuN and 8-oxo-2’-deoxyguanosine (8-OHdG) (j). n = 3 (no-astrocyte) or 5 (+WT and +AKO) independent samples (a,d); n = 6 (WT) or 5 (AKO) independent samples (b); n =3 (c), 5 (g), or 6 (h) independent samples; n = 4 (WT) or 3 (AKO) mice (e); n = 6 mice (f). Bar graphs are presented as mean ± SEM. Two-sided unpaired Student’s t-test (b,c,e-h) or one-way ANOVA with post-hoc Tukey test (a,d) was used. Scale bars, 100 μm (i, j); 50 μm (a); 20 μm (d).
Fig. 6.
Fig. 6.. Astrocytes with OxPhos deficit promote microglial activation and neuroinflammation via IL-3.
(a) Heatmap showing DEGs (FDR-corrected p < 0.05) related to microglial activation and immune response in 6-month mouse hippocampi. (b) Representative images of hippocampal or cortical sections of 6-month mice stained for IBA-1. (c) IBA-1+ area % in hippocampal sections of 1.5-, 3-, and 6-month WT and TfamAKO mice. (d) MHCII-positive rate in microglia acutely isolated from 6-month mouse brains with anti-CD11b microbeads. (e) Representative images of hippocampal or cortical sections of 6-month mice stained for CD74. (f) TNFα and IL-1β levels in the cortex of 6-month mice. (g) Western blots of NFκB in 6-month mouse hippocampi (quantified in Extended Data Fig. 7e). (h and i) mRNA level of Tnfa, Il1b, Trem2, and Apoe in microglia acutely isolated from 6-month mouse brains. (j) IBA-1 intensity (normalized to cell count) in WT primary microglia (on coverslips in 6-well plates) cocultured with WT or TfamAKO astrocytes (in 6-well inserts) for 24 h. (k) Representative images of hippocampal sections of 6-month mice stained for IL-3 and GFAP. (l) IL-3+ area in the hippocampus of 3- and 6-month mice. (m) Il3ra mRNA levels in microglia acutely isolated from 6-month mouse brains. (n) Il3ra mRNA levels in WT microglia (in 24-well plates) cultured with WT or TfamAKO astrocytes (in 24-well inserts) for 24 h. (o) IBA-1 intensity (normalized to cell count) in WT microglia (on coverslips in 6-well plates) pretreated with vehicle or IL-3Rα neutralizing antibody before being cocultured with TfamAKO astrocytes (in 6-well inserts) for 24 h. n = 4 (c, h), 5 (j), 3 (d, l, n, o), or 8 (m) mice or independent samples; n = 6 (WT) or 5 (AKO) mice (f); n = 7 (Trem2-WT), 8 (Trem2-AKO), or 4 (Apoe) mice (i). Bar graphs and dot plots are presented as mean ± SEM. Two-sided unpaired t-test was used for all comparisons. Scale bars, 100 μm (b, e, and k).
Fig. 7.
Fig. 7.. Loss of astrocytic FA degradation suppresses lipid synthesis and induces demyelination.
(a) Voxel-wise analyses of fractional anisotropy and mean-, axial-, and radial diffusivity. Colors reflect voxels with statistically significant TfamAKO < WT family-wise error corrected 1-p values. (b) Connectometry analysis comparing TfamAKO to WT brains using quantitative anisotropy. Fiber color indicates principal fiber direction (left) and local T-value (right). (c) Representative images and quantification of the corpus callosum area of brain sections of 6-month mice stained for FluoroMyelin. (d) Representative images and quantification of cortical area of 6-month mouse brains stained for MBP. (e) Western blots showing the levels of FAS, p-ACC, ACC, p-AMPK and AMPK in 6-month mouse hippocampi (quantified in Extended Data Fig. 8l, m, p). (f) mRNA levels of genes involved in FA synthesis (Fasn and Acaca), phospholipid synthesis (Chpt1 and Cept1), and cholesterol synthesis (Hmgcr and Hmgcs1) in astrocytes acutely isolated from 6-month mouse brains. (g) mRNA levels of genes involved in FA synthesis (Fasn and Acaca) and phospholipid synthesis (Chpt1 and Cept1) in oligodendrocytes acutely isolated from 6-month mouse brains. n = 3 (c), 4 (d), or 8 (g) mice; n = 8 (Fasn, Acaca, Chpt1 and Cept1) or 4 (Hmgcr and Hmgcs1) mice (f). Bar graphs are presented as mean ± SEM. Two-sided unpaired t-test was used for all comparisons. Scale bars, 100 μm (c and d).
Fig. 8.
Fig. 8.. Impaired FA degradation, LD accumulation, and TfamAKO-induced transcriptional signatures are resembled in a mouse model of AD.
(a) Heatmap showing disease associated astrocyte (DAA)-related DEGs in 6-month WT and TfamAKO mouse hippocampi. (b) Representative images showing subiculum of 6-month WT and 5xFAD brain sections stained for LD and GFAP. (c) Western blots and quantification of Plin2 expression in 6-month WT and 5xFAD mouse cortices. (d) Relative OCR of hippocampal slices from 6-month mice on oleate-BSA. (e) Etomoxir-induced decreases in OCR of acute hippocampal slices from 6-month mice. (f) Quantification of LDs in cultured astrocytes from 4-month mouse brains. (g) FA-induced basal and maximal OCRs in cultured astrocytes from 4-month brains presented as OCR differences in the presence or absence of exogenous FA. (h) Etomoxir-induced decreases in OCR in cultured astrocytes from 4-month WT or 5xFAD mice. (i) Ppara mRNA levels in cultured astrocytes from 4-month WT or 5xFAD brains. (j and k) Quantifications (j) and representative images (k) of BODIPY-C12 localized to mitochondria in primary astrocytes from 4-month WT or 5xFAD mice. (l) Left: Venn diagram of unique and shared DEG counts in 6-month TfamAKO mouse hippocampi (relative to 6-month WT) and in 12-month 5xFAD mouse hippocampi (relative to 12-month WT) with upregulated DEG counts in red and downregulated DEG counts in blue; right: percentage of DEGs that are co-upregulated, co-downregulated, or showing different directions across the two models. (m) Correlation of overlapped DEGs described in panel j plotted by their signed log2(fold change) across the two models. (n) Hierarchical networks of GO BP terms (p < 0.05) enriched in the shared DEG across models using REVIGO with Resnik measurement and 0.5 distance. n = 4 (c, f), 5 (j), or 6 (i) mice; n = 11 slices (d); n = 23 (WT) or 25 (5xFAD) slices (e); n = 7 (g) or 8 (h) independent samples. Bar graphs are presented as mean ± SEM. Two-sided unpaired t-test was used for all comparisons. Scale bars, 50 μm (b); 20 μm (k).

Comment in

References

    1. Cunnane SC et al. Brain energy rescue: an emerging therapeutic concept for neurodegenerative disorders of ageing. Nat Rev Drug Discov 19, 609–633, (2020). - PMC - PubMed
    1. Qi G, Mi Y. & Yin F. Cellular Specificity and Inter-cellular Coordination in the Brain Bioenergetic System: Implications for Aging and Neurodegeneration. Frontiers in physiology 10, 1531, (2019). - PMC - PubMed
    1. Wang W, Zhao F, Ma X, Perry G. & Zhu X. Mitochondria dysfunction in the pathogenesis of Alzheimer’s disease: recent advances. Mol. Neurodegener 15, 30, (2020). - PMC - PubMed
    1. Baik SH et al. A Breakdown in Metabolic Reprogramming Causes Microglia Dysfunction in Alzheimer’s Disease. Cell Metab 30, 493–507 e496, (2019). - PubMed
    1. March-Diaz R. et al. Hypoxia compromises the mitochondrial metabolism of Alzheimer’s disease microglia via HIF1. Nature Aging 1, 385–399, (2021). - PubMed

Publication types