. 2023 May;22(5):e13817.
doi: 10.1111/acel.13817. Epub 2023 Mar 23.

Effect of peripheral cellular senescence on brain aging and cognitive decline

Affiliations

Effect of peripheral cellular senescence on brain aging and cognitive decline

Vivekananda Budamagunta et al. Aging Cell. 2023 May.

Abstract

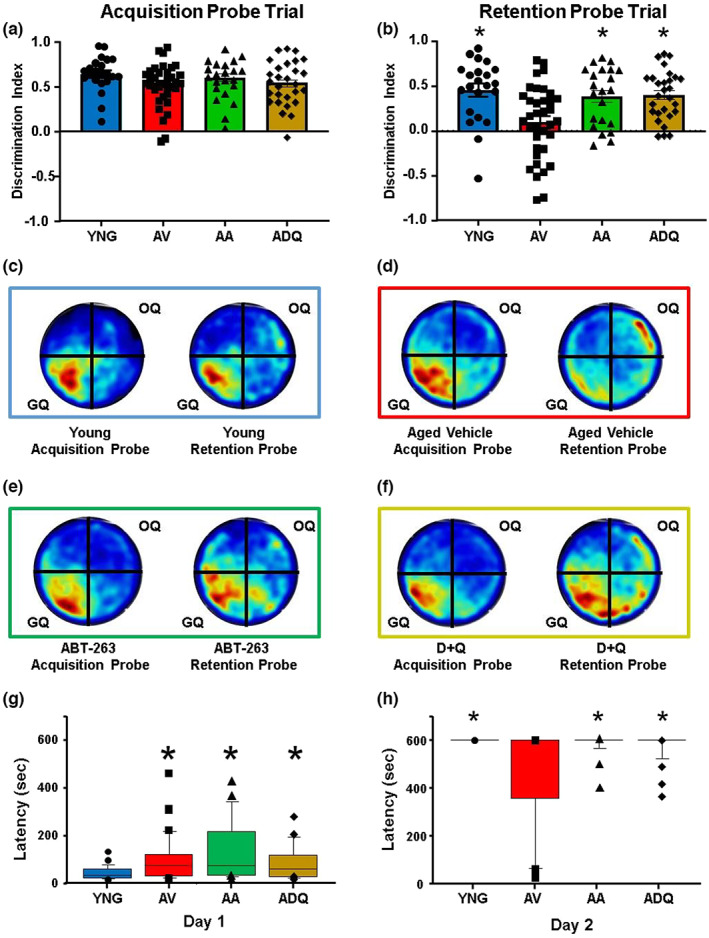
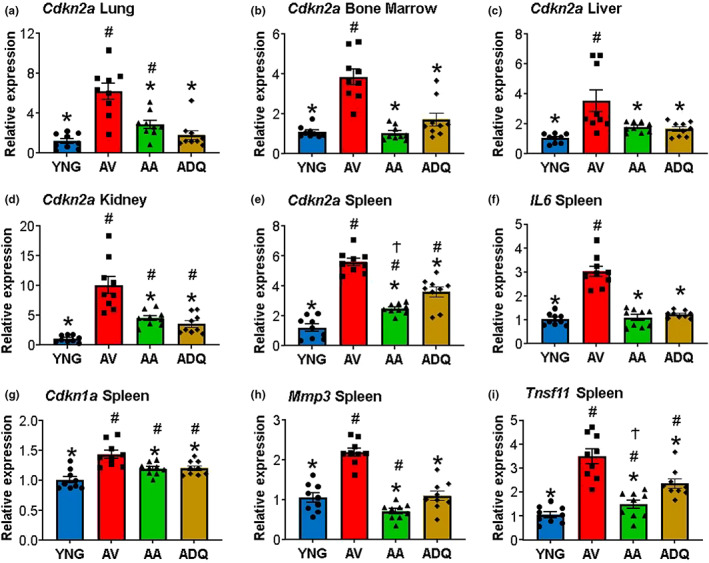
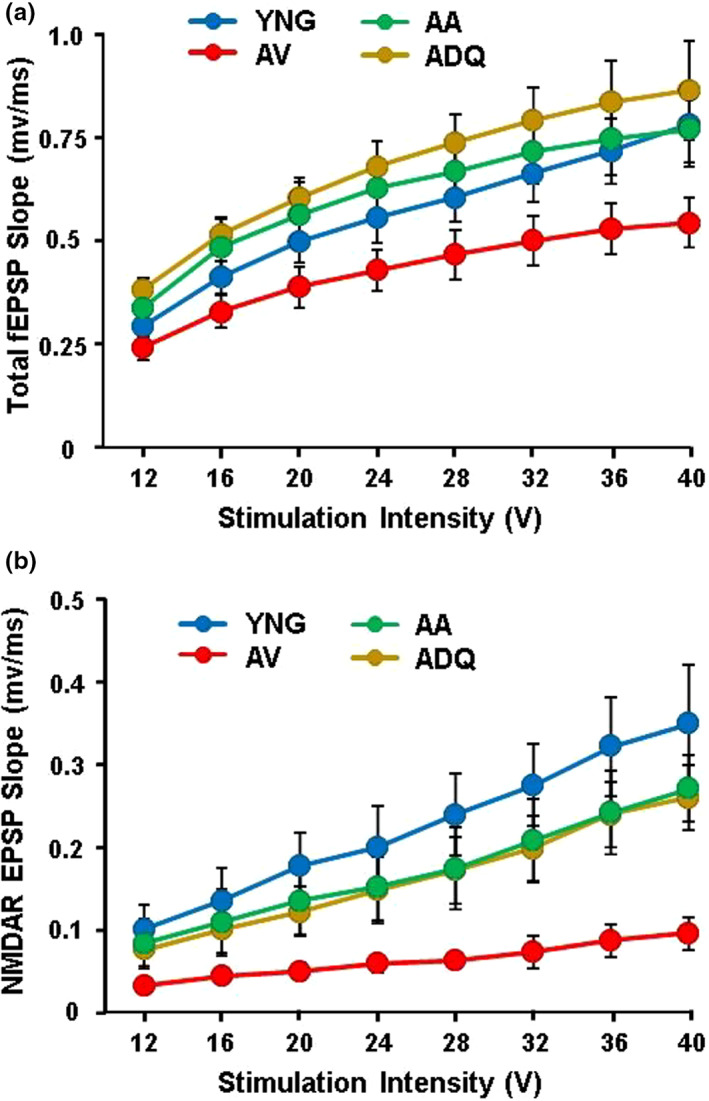
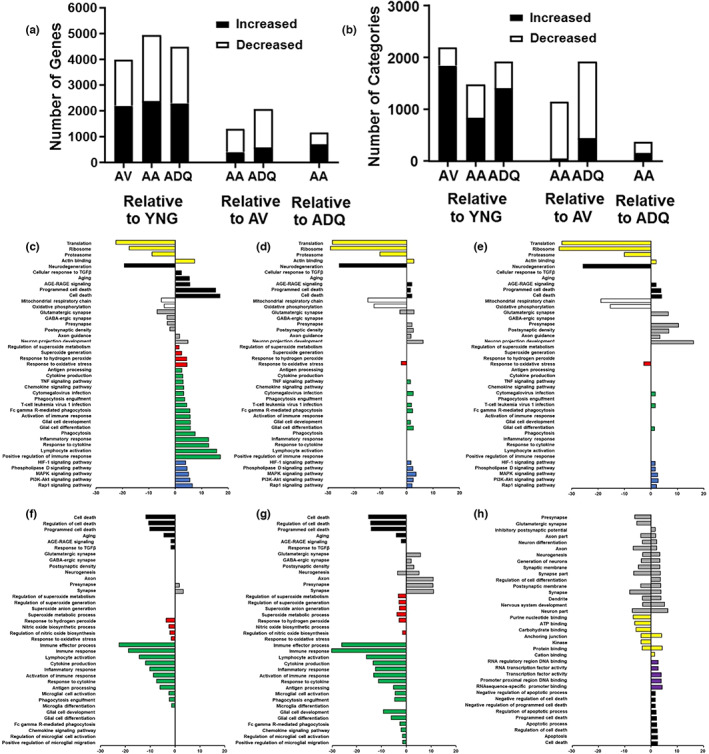
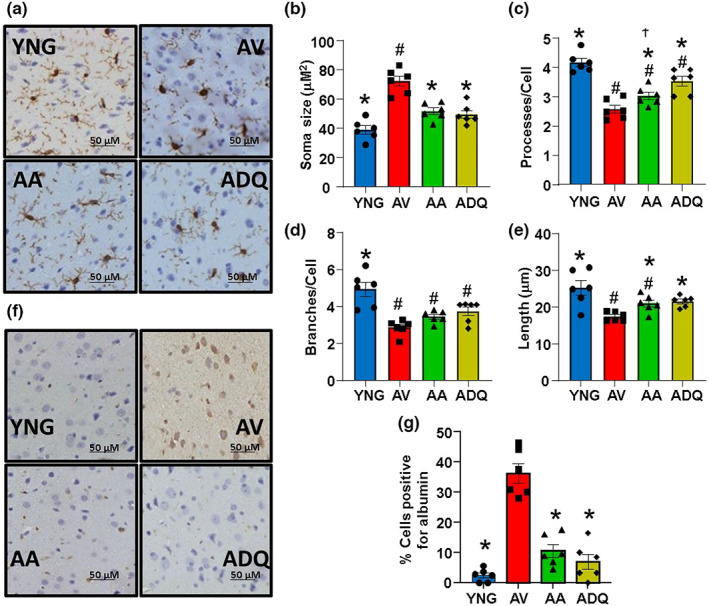
We examine similar and differential effects of two senolytic treatments, ABT-263 and dasatinib + quercetin (D + Q), in preserving cognition, markers of peripheral senescence, and markers of brain aging thought to underlie cognitive decline. Male F344 rats were treated from 12 to 18 months of age with D + Q, ABT-263, or vehicle, and were compared to young (6 months). Both senolytic treatments rescued memory, preserved the blood-brain barrier (BBB) integrity, and prevented the age-related decline in hippocampal N-methyl-D-aspartate receptor (NMDAR) function associated with impaired cognition. Senolytic treatments decreased senescence-associated secretory phenotype (SASP) and inflammatory cytokines/chemokines in the plasma (IL-1β, IP-10, and RANTES), with some markers more responsive to D + Q (TNFα) or ABT-263 (IFNγ, leptin, EGF). ABT-263 was more effective in decreasing senescence genes in the spleen. Both senolytic treatments decreased the expression of immune response and oxidative stress genes and increased the expression of synaptic genes in the dentate gyrus (DG). However, D + Q influenced twice as many genes as ABT-263. Relative to D + Q, the ABT-263 group exhibited increased expression of DG genes linked to cell death and negative regulation of apoptosis and microglial cell activation. Furthermore, D + Q was more effective at decreasing morphological markers of microglial activation. The results indicate that preserved cognition was associated with the removal of peripheral senescent cells, decreasing systemic inflammation that normally drives neuroinflammation, BBB breakdown, and impaired synaptic function. Dissimilarities associated with brain transcription indicate divergence in central mechanisms, possibly due to differential access.

Keywords: aging; cognition; inflammation; oxidative stress; senolytic NMDA receptor; transcription.


Conflict of interest statement

Daohong Zhou is an inventor of two pending patent applications for use of Bcl‐xL PROTACs, synthesized using ABT‐263, as senolytic and antitumor agents. Daohong Zhou is a co‐founder of and has equity in Dialectic Therapeutics, which develops Bcl‐xL PROTACs to treat cancer.

Figures

FIGURE 1
FIGURE 1
Senolytic treatments improve performance on the one‐day watermaze. (a,d) latency, (b,e) swim speed and (c,f) escape distance for each training block for the cue discrimination a‐c and spatial discrimination d and f tasks.
FIGURE 2
FIGURE 2
Senolytic treatments improve memory. Discrimination index (mean + SEM) for the (a) acquisition and (b) retention probe trials on the watermaze. (c–f) Group mean heat maps for the animals position during the acquisition and retention probe trials for (c) YNG, (d) AV, (e) AA, and (f) ADQ. Most animals directed their search to the goal quadrant (GQ). (g and h) Box plots for latency to enter the dark compartment of inhibitory avoidance during (g) Day 1 training and (h) Day 2 retention testing. The symbols indicate the mean (±SEM). Asterisks indicate a difference relative to AV (b, h) or YNG (g).
FIGURE 3
FIGURE 3
Senolytic treatment decreases expression of senescent and SASP genes in the periphery. Relative expression level of Cdkn2a in (a) lung, (b) bone marrow, (c) liver, (d) kidney, and (e) spleen. Relative expression level of (f) IL ‐6, (g) Cdkn1a, (h) Mmp3, and (i) Tnfsf11 in spleen. Error bars denote SEM (n = 9). Asterisks indicate a difference relative to AV, # denotes a difference relative to YNG, and Ϯ indicates a difference relative to ADQ (p < 0.05)
FIGURE 4
FIGURE 4
Senolytic treatment preserves synaptic function in the hippocampus. Slope of excitatory post synaptic field potentials recorded from hippocampal CA3‐CA1 synapses. The initial slope of the (a) total fEPSP and (b) NMDAR‐mediated component of the EPSP was measured for increasing stimulation intensity and input–output curves were generated. Each point represents the mean (±SEM) for the given stimulation intensity.
FIGURE 5
FIGURE 5
Effect of senolytic treatment on gene expression in the DG. (a) Graphic summary of the number of differentially expressed genes, which were either significantly increased (filled) or decreased (open) in relation to other groups. (b) Graphic summary for the number of GO categories identified for differentially expressed genes. (c–g) Bars represent the –log(adj‐p value) and log(adj‐p value) for selected GO term clusters for genes that increased or decreased compared to YNG for (c) AV, (d) AA, and (e) ADQ; and compared to AV for (f) AA and (g) ADQ, and (h) in AA compared to ADQ. GO terms were loosely grouped into categories: protein expression and binding (yellow), aging, age‐related disease, and cell death (black), mitochondria (open), neuronal/synaptic (gray), oxidative stress (red), glial and immune response (green), signaling pathways (blue), and RNA or DNA and molecular binding (purple).
FIGURE 6
FIGURE 6
Senolytic treatment reduces age‐associated microglial activation. (a) Representative cortex sections immunohistologically stained for iba‐1. Mean ± SEM for microglial morphological parameters (b) soma size, (c) processes per cell, (d) branches per cell, and (e) the average length of the process. (f) Representative cortex sections immunohistologically stained for albumin. (g) Bars represent mean ± SEM. Asterisks indicate a difference relative to AV, # denotes a difference relative to YNG, and Ϯ indicates a difference relative to ADQ (p < 0.05).

References

    1. Baker, D. J. , & Petersen, R. C. (2018). Cellular senescence in brain aging and neurodegenerative diseases: Evidence and perspectives. Journal of Clinical Investigation, 128(4), 1208–1216. 10.1172/Jci95145 - DOI - PMC - PubMed
    1. Baker, D. J. , Wijshake, T. , Tchkonia, T. , LeBrasseur, N. K. , Childs, B. G. , van de Sluis, B. , Kirkland, J. L. , & van Deursen, J. (2011). Clearance of p16Ink4a‐positive senescent cells delays ageing‐associated disorders. Nature, 479(7372), 232–236. 10.1038/nature10600 - DOI - PMC - PubMed
    1. Balusu, S. , van Wonterghem, E. , de Rycke, R. , Raemdonck, K. , Stremersch, S. , Gevaert, K. , Brkic, M. , Demeestere, D. , Vanhooren, V. , Hendrix, A. , Libert, C. , & Vandenbroucke, R. E. (2016). Identification of a novel mechanism of blood‐brain communication during peripheral inflammation via choroid plexus‐derived extracellular vesicles. EMBO Molecular Medicine, 8(10), 1162–1183. 10.15252/emmm.201606271 - DOI - PMC - PubMed
    1. Banks, W. A. , Farr, S. A. , & Morley, J. E. (2000). Permeability of the blood‐brain barrier to albumin and insulin in the young and aged SAMP8 mouse. The Journals of Gerontology. Series A, Biological Sciences and Medical Sciences, 55(12), B601–B606. 10.1093/gerona/55.12.b601 - DOI - PubMed
    1. Banks, W. A. , & Kastin, A. J. (1992). The interleukins‐1 alpha, ‐1 beta, and ‐2 do not acutely disrupt the murine blood‐brain barrier. International Journal of Immunopharmacology, 14(4), 629–636. 10.1016/0192-0561(92)90124-4 - DOI - PubMed

Publication types