. 2023 Mar 7:14:1139797.
doi: 10.3389/fimmu.2023.1139797. eCollection 2023.

The prognostic significance of human ovarian aging-related signature in breast cancer after surgery: A multicohort study

Affiliations

The prognostic significance of human ovarian aging-related signature in breast cancer after surgery: A multicohort study

Xin Hua et al. Front Immunol. .

Abstract

Background: Recent studies have shown that ovarian aging is strongly associated with the risk of breast cancer, however, its prognostic impact on breast cancer is not yet fully understood. In this study, we performed a multicohort genetic analysis to explore its prognostic value and biological features in breast cancer.

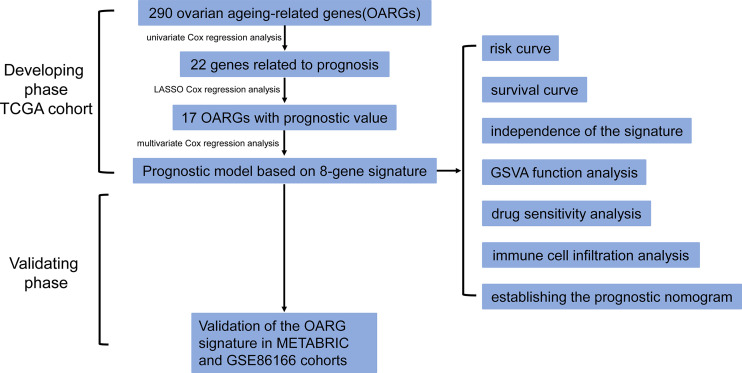
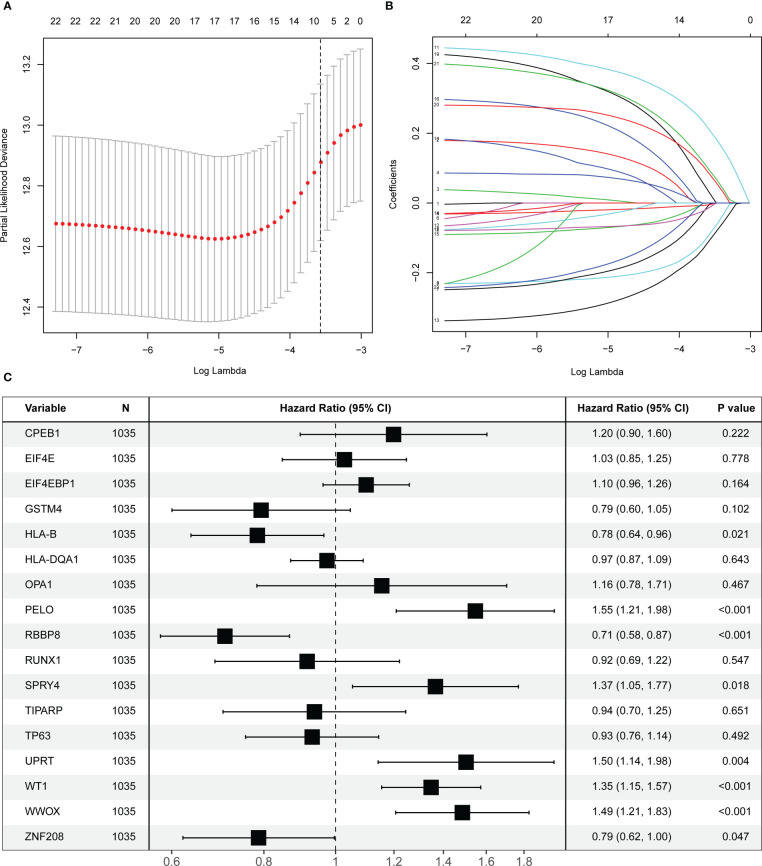
Methods: The gene expression and clinicopathological data of 3366 patients from the The Cancer Genome Atlas (TCGA) cohort, the Molecular Taxonomy of Breast Cancer International Consortium (METABRIC) cohort and the GSE86166 cohort were analyzed. A total of 290 ovarian aging-related genes (OARGs) were included in the establishment of the prognostic model. Furthermore, functional mechanisms analysis, drug sensitivity, and immune cell infiltration were investigated using bioinformatic methods.

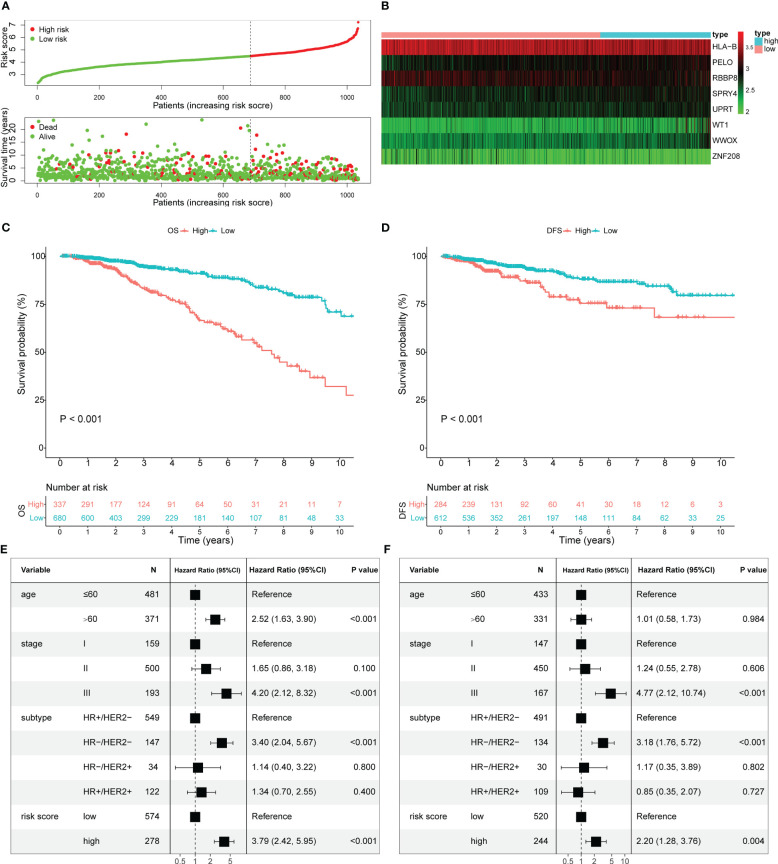
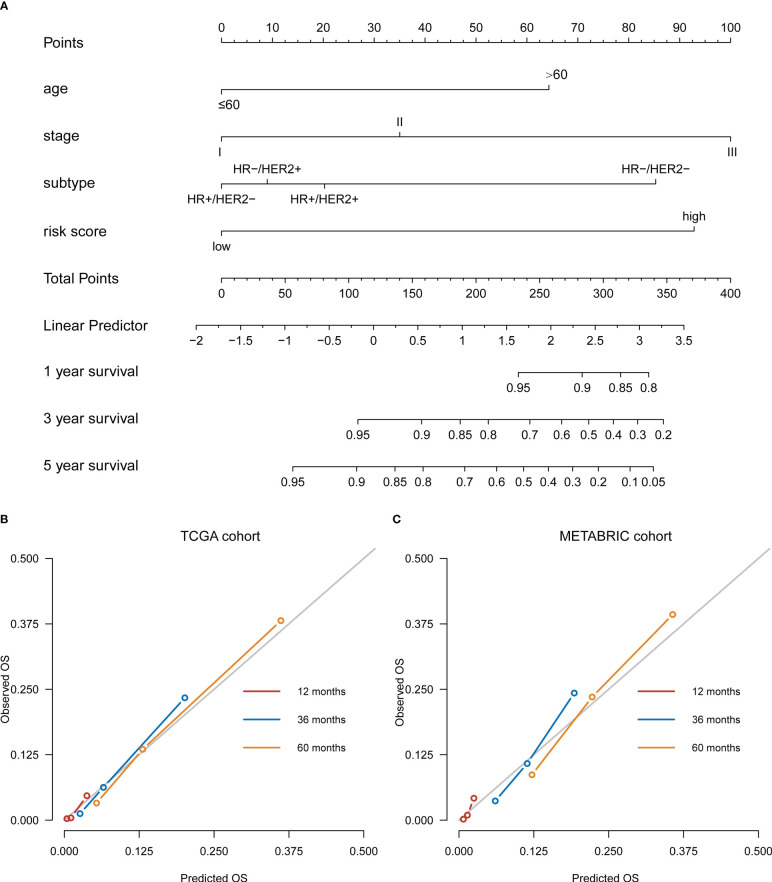
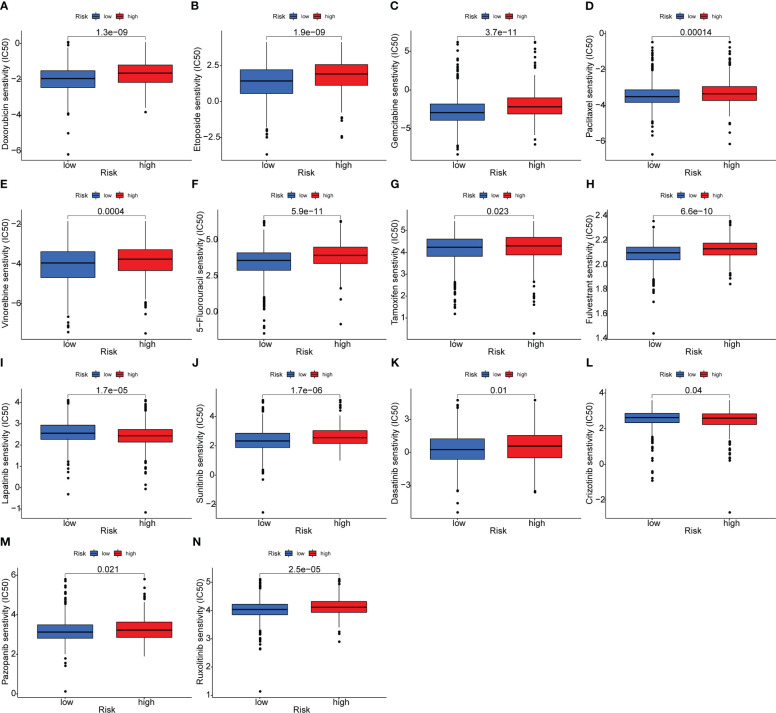
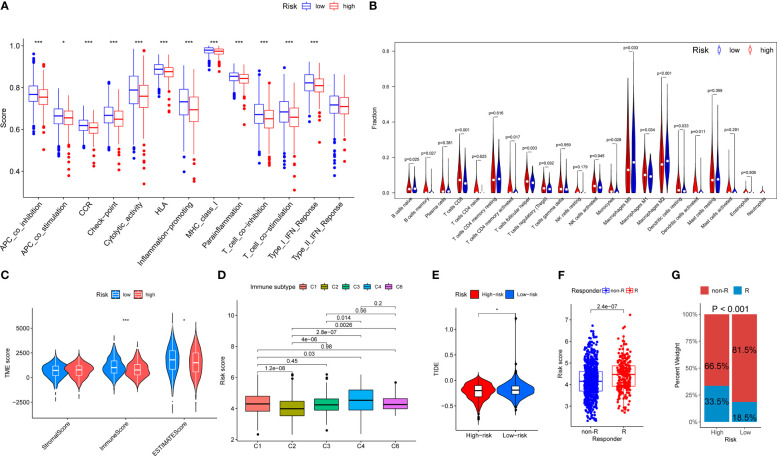
Results: An eight OARG-based signature was established and validated using independent cohorts. Two risk subgroups of patients with distinct survival outcomes were identified by the OARG-based signature. A nomogram with good predictive performance was developed by integrating the OARG risk score with clinicopathological factors. Moreover, the OARG-based signature was correlated with DNA damage repair, immune cell signaling pathways, and immunomodulatory functions. The patients in the low-risk subgroup were found to be sensitive to traditional chemotherapeutic, endocrine, and targeted agents (doxorubicin, tamoxifen, lapatinib, etc.) and some novel targeted drugs (sunitinib, pazopanib, etc.). Moreover, patients in the low-risk subgroup may be more susceptible to immune escape and therefore respond less effectively to immunotherapy.

Conclusions: In this study, we proposed a comprehensive analytical method for breast cancer assessment based on OARG expression patterns, which could precisely predict clinical outcomes and drug sensitivity of breast cancer patients.

Keywords: breast cancer; drug sensitivity; immune infiltration; ovarian ageing; prognosis.


Conflict of interest statement

The authors declare that the research was conducted in the absence of any commercial or financial relationships that could be construed as a potential conflict of interest.

Figures

Figure 1
Figure 1
The flow chart detailing the comprehensive analysis of ovarian aging patterns in postoperative breast cancer patients.
Figure 2
Figure 2
Screening and identification of prognostic ovarian ageing-related genes (OARGs) in the TCGA cohort. (A) Selection of the optimal candidate genes in the LASSO model. (B) LASSO coefficients of prognosis-associated OARGs, each curve represents a gene. (C) Forest plots showing results of univariate Cox regression analysis between the candidate OARGs expression and overall survival.
Figure 3
Figure 3
Estimate the prognostic value of ovarian ageing-related gene (OARG) signature model in TCGA cohort. (A) The distribution of risk scores in the TCGA and patient distribution in the high- and low-risk group according to overall survival (OS) status. (B) The heatmap showing expression profiles of the 8 OARGs. (C) Kaplan-Meier curves for the OS of patients in the high- and low-risk groups. (D) Kaplan-Meier curves for the diseases-free survival (DFS) of patients in the high- and low-risk groups. (E) Multivariate Cox regression analysis of OS. (F) Multivariate Cox regression analysis of DFS.
Figure 4
Figure 4
Development of a nomogram based on ovarian ageing-related genes (OARGs) signature for predicting overall survival (OS) of patients with breast cancer. (A) The nomogram plot integrating OARG risk score, age, stage and subtype in the TCGA training cohort. (B) The calibration plot for the probability of 1-, 3-, and 5-year OS in the TCGA training cohort. (C) The calibration plot for the probability of 1-, 3-, and 5-year OS in the METABRIC validation cohort.
Figure 5
Figure 5
Analysis of the association between the risk model and chemotherapeutics, endocrine therapy, and targeted therapy. (A–F) The model predicting the sensitivity to chemosensitivity. It was estimated that low-risk patients had lower IC50 for chemotherapeutics of doxorubicin, etoposide, gemcitabine, paclitaxel, vinorelbine and 5-fluorouracil. (G, H) The model predicting the sensitivity to endocrine therapy. It was estimated that low-risk patients had lower IC50 of tamoxifen and fulvestrant. (I–N) The model predicting the sensitivity to targeted therapy. It was estimated that low-risk patients had lower IC50 of lapatinib, sunitinib, dasatinib, crizotinib, pazopanib and ruxolitinib.
Figure 6
Figure 6
The landscape of immune function and immune cell infiltration between the high- and low-risk group in the TCGA cohort. Red represents high-risk samples; blue represents low-risk samples. *P < 0.05, **P < 0.01, ***P < 0.001. (A) Barplot showing differences of immune functions between the low- and the high-risk group. (B) Violin plot showing differences of infiltrating immune cell types between the low- and the high-risk group. (C) Comparison of tumor microenvironment scores calculated by ESTIMATE between the low- and the high-risk group. (D) Comparison of risk scores between different immune subgroups. (E) Comparison of tumor microenvironment scores calculated by TIDE between the low- and the high-risk group. (F) Comparison of risk scores between different responder subgroups. (G) Comparison of the immunotherapy responding proportion between the low- and the high-risk group.

Similar articles

References

    1. Loibl S, Poortmans P, Morrow M, Denkert C, Curigliano G. Breast cancer. Lancet (2021) 397(10286):1750–69. doi: 10.1016/S0140-6736(20)32381-3 - DOI - PubMed
    1. Britt KL, Cuzick J, Phillips KA. Key steps for effective breast cancer prevention. Nat Rev Cancer (2020) 20(8):417–36. doi: 10.1038/s41568-020-0266-x - DOI - PubMed
    1. May-Panloup P, Boucret L, Chao de la Barca JM, Desquiret-Dumas V, Ferre-L’Hotellier V, Moriniere C, et al. . Ovarian ageing: the role of mitochondria in oocytes and follicles. Hum Reprod Update (2016) 22(6):725–43. doi: 10.1093/humupd/dmw028 - DOI - PubMed
    1. Collaborative Group on Hormonal Factors in Breast C . Menarche, menopause, and breast cancer risk: individual participant meta-analysis, including 118 964 women with breast cancer from 117 epidemiological studies. Lancet Oncol (2012) 13(11):1141–51. doi: 10.1016/S1470-2045(12)70425-4 - DOI - PMC - PubMed
    1. Ritte R, Lukanova A, Tjonneland A, Olsen A, Overvad K, Mesrine S, et al. . Height, age at menarche and risk of hormone receptor-positive and -negative breast cancer: a cohort study. Int J Cancer (2013) 132(11):2619–29. doi: 10.1002/ijc.27913 - DOI - PubMed

Publication types