

Measuring the efficiency of public hospitals: A multistage data envelopment analysis in Fujian Province, China
- PMID: 36960360
- PMCID: PMC10027719
- DOI: 10.3389/fpubh.2023.1091811
Measuring the efficiency of public hospitals: A multistage data envelopment analysis in Fujian Province, China
Abstract
Objective: The present study aimed to evaluate the operational efficiency of public hospitals in Fujian Province and the factors responsible for the inefficiency of these hospitals and provide relevant suggestions for health policymakers in allocating service resources.
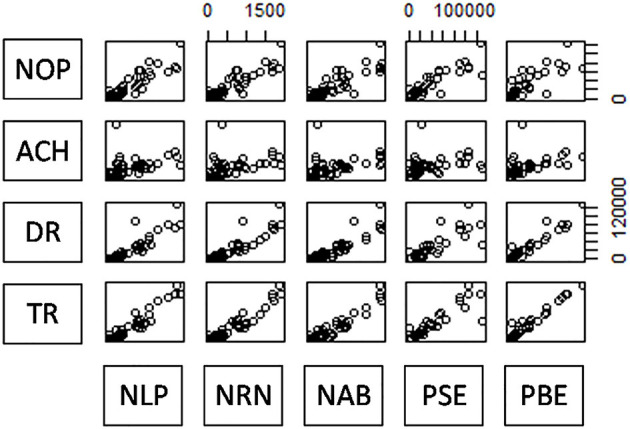
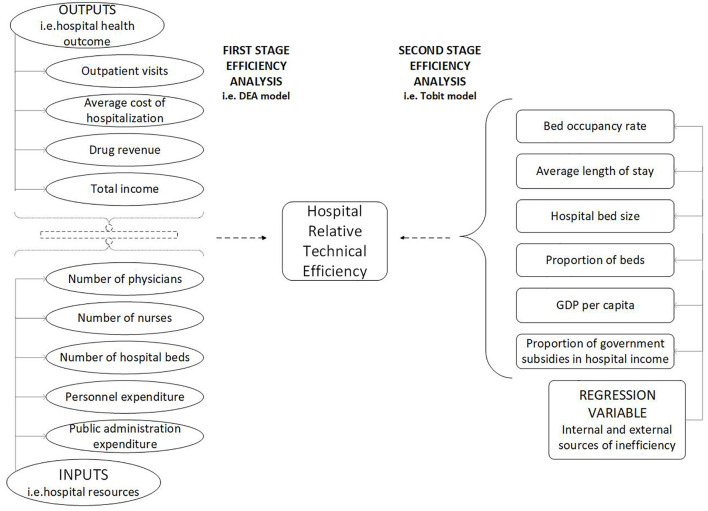
Method: In the first stage of the research, the variables affecting the efficiency of hospitals were extracted by qualitative and quantitative methods, including literature optimization, gray related analysis and gray clustering evaluation. In the second stage, the data envelopment analysis (DEA) method was used to evaluate the operational efficiency of 49 hospitals of different levels and types selected by sampling in 2020. Finally, a Tobit regression model with introduced institutional factors and background factors was established to study the main influencing factors of hospital inefficiency.
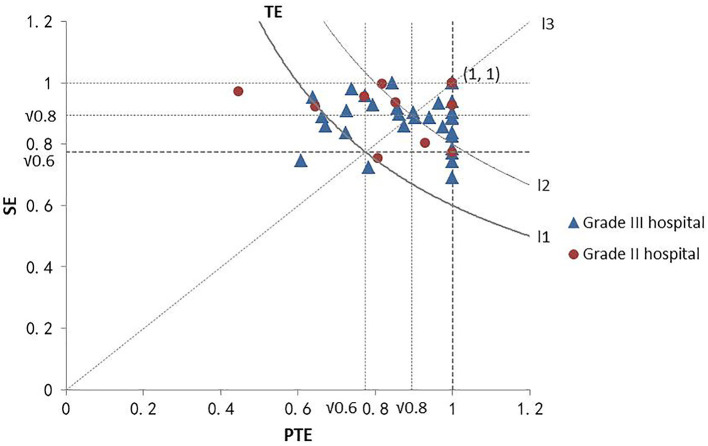
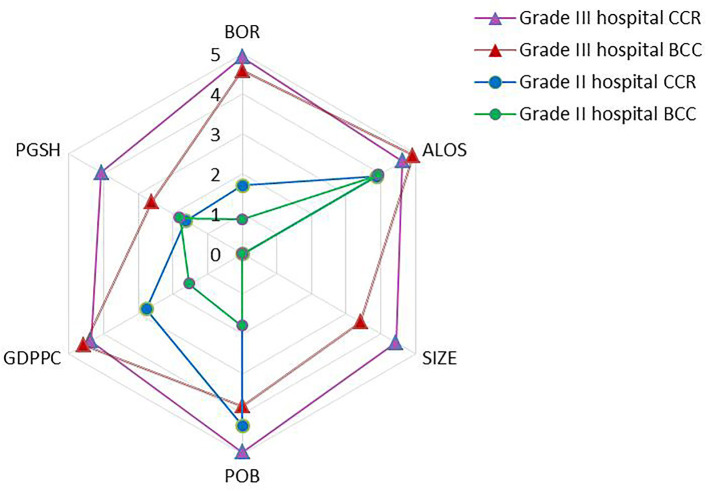
Results: In the first stage, 10 input variables and 10 output variables necessary from the mangers' point of view were identified to test efficiency. In the second stage, the average comprehensive TE, PTE, and SE of 49 sample hospitals was 0.802, 0.888, and 0.902, respectively. 22.45% of these hospitals met the effective criteria, i.e., the overall effective rate was 22.45%. The low SE value of the hospital was the main reason hindering the improvement of the comprehensive efficiency value. The overall effective rate of secondary public hospitals (30.77%) was higher than that of tertiary public hospitals (19.44%), and the overall effective rate of public specialized hospitals (30%) was higher than that of general public hospitals (18.92%). Based on the third stage results, the bed occupancy rate (BOR) and the proportion of beds (POB) were major factors affecting the operation efficiency of grade III hospitals (p < 0.01). However, the operating efficiency of grade II hospitals was significantly affected by POB and regional per capita GDP(GDPPC) (p < 0.05). Moreover, the impact of BOR and GDPPC was positive, and POB was negatively correlated with hospital operation efficiency.
Conclusions: The study results indicated that the overall operation efficiency of public hospitals in Fujian Province is low. This study revealed that intervention should be strengthened from a policy and management perspective to improve the operation efficiency of public hospitals.
Keywords: Tobit regression; data envelopment analysis; gray clustering; gray relational analysis; hospital efficiency.
Copyright © 2023 Sun, Ye, Zhang, Xue and Shang.
Conflict of interest statement
The authors declare that the research was conducted in the absence of any commercial or financial relationships that could be construed as a potential conflict of interest.
Figures
References
-
- Hu R, Zou H, Shen C, Heng F. Health Care System Reform in China-Issues, Challenges and Options. Beijing: China Economics and Management Academy, Central University of Finance and Economics; (2011).
-
- Council GOOTS. Opinions of the General Office of the State Council on Promoting the High Quality Development of Public Hospitals. Beijing: Council GOOTS; (2021).
-
- News H. Fujian: The Main Quality Information of the Hospital is Completely Open. Jiangxi: News Press; (2018).
-
- Aigner DJ, Chu SF. On estimating the industry production function. Am Econ Rev. (1968) 58:826–39.
Publication types
MeSH terms
LinkOut - more resources
Full Text Sources
Research Materials
Miscellaneous