

Review
doi: 10.1016/j.bjae.2022.12.004.
Epub 2023 Feb 8.
Electronics and biological signal processing
Affiliations
- PMID: 36960437
- PMCID: PMC10028393
- DOI: 10.1016/j.bjae.2022.12.004
Item in Clipboard
Review
Electronics and biological signal processing
BJA Educ.
2023 Apr.
No abstract available
Keywords: biological signal processing; electrodes; transducers.
Conflict of interest statement
The author declare that they have no conflict of interest.
Figures

Biological processing block diagram showing the path from electrodes or transducer, to amplifier, filter, process and then converting the signal to digital form. ADC, analogue-to digital-converter. (Figure reproduced with permission from Magee and Tooley.3).
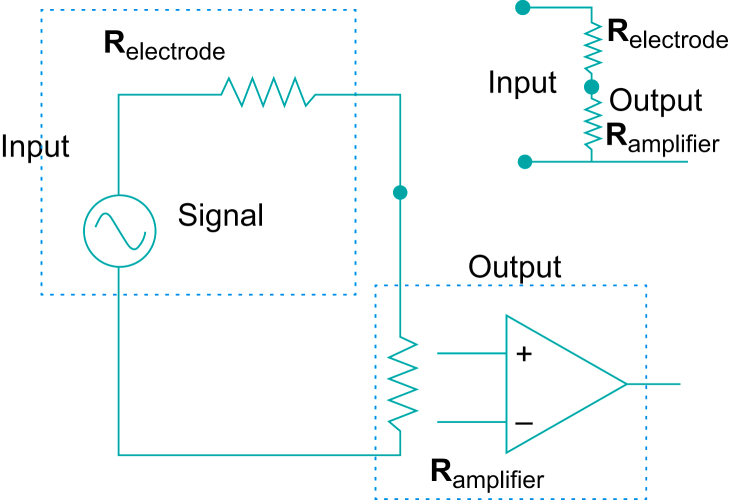
Diagram of a physiological signal generator plus series electrode resistance (Relectrode) plus amplifier input resistance (Ramplifier). The voltage divider is formed by the combination of the two resistances with the signal being the input voltage, and the output voltage being the voltage across the amplifier. This equivalent circuit is also shown in the diagram in the top right. (Figure reproduced with permission from Magee and Tooley.3).

Diagram of a typical blood pressure transducer which uses resistive strain gauges. The pressure moves the diaphragm back and forth, which causes the strain gauges to be compressed or expanded. (Figure reproduced with permission from Magee and Tooley.3).
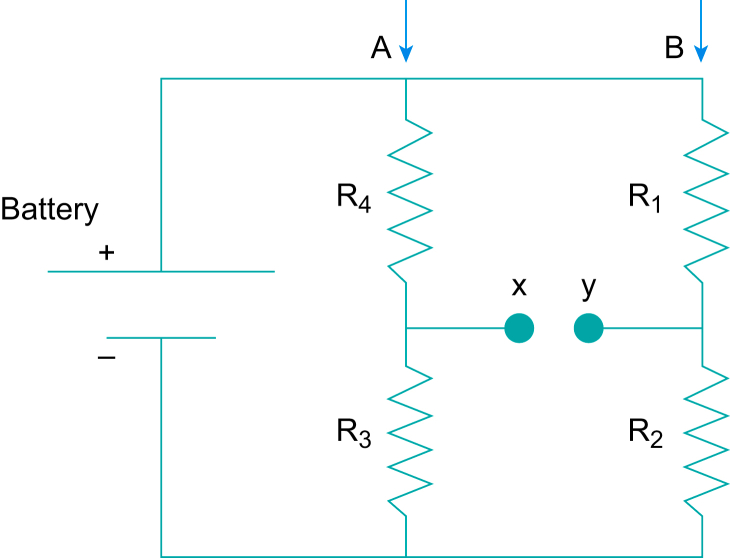
A bridge circuit. (Figure reproduced with permission from Magee and Tooley.3).

A simple low pass filter. This shows a square wave input and resultant output across the capacitor. (Figure reproduced with permission from Magee and Tooley.3).

A single-ended amplifier in which the common ground is both one side of the input and one side of the output. It also shows the system amplifying the domestic mains voltage as well. (Figure reproduced with permission from Magee and Tooley.3).

Patient connected differential amplifier measuring the ECG, showing connection to a patient. RA, right arm; LA, left arm; RL, right leg. (Figure reproduced with permission from Magee and Tooley.3).

Patient isolated differential amplifier showing isolation provided by fibreoptics, and the power supply arrangements for the patient amplifier. LED, light-emitting diode. (Figure reproduced with permission from Magee and Tooley.3).

Conversion of analogue signal to digital values. The diagram shows a sine wave sampled at 10 equally spaced in time points. The open circles represent a sample, and these samples will have a corresponding digital value. For example, the fifth sample in the diagram has a value of 153, the 10th has a value of 204 and the 15th a value of 51. (Figure reproduced with permission from Magee and Tooley.3).
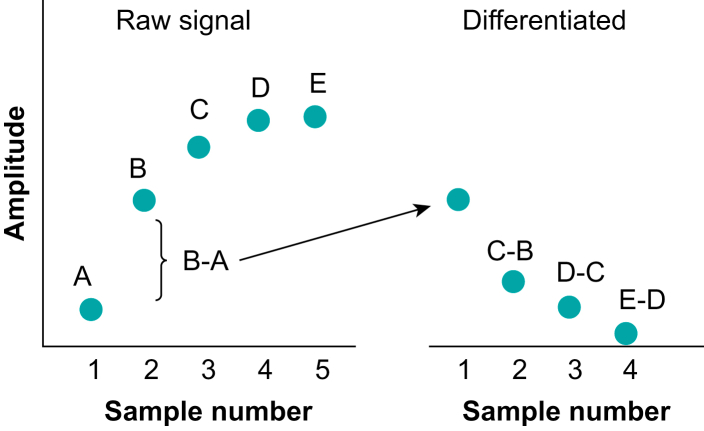
Diagram showing the principle of digital differentiation. The raw signal consists of five samples A–E. The differentiation is carried out by taking B–A, then C–B etc. (Figure reproduced with permission from Magee and Tooley.3).

Diagram showing a sine wave sample at above the Nyquist rate (open circles) and below the rate (closed circles). Aliasing occurs when the sampling is too low and results in an aliased wave – a much lower frequency wave than the sampled sine wave. (Figure reproduced with permission from Magee and Tooley.3).
References
-
- Magee P., Tooley M.A. 2nd Edn. OUP; Oxford: 2011. The physics, clinical measurement and equipment of anaesthetic practice.
-
- Reynolds K.J., De Kock J.P., Tarassenko L., et al. Temperature dependence of the light emitting diode and its theoretical effect on the pulse oximeter. Br J Anaesth. 1991;67:638–643. - PubMed
-
- Manbachi A., Cobbold R.S.C. Development and application of piezoelectric materials for ultrasound generation and detection. Ultrasound. 2011;19:187–196.
Publication types
LinkOut - more resources
Full Text Sources
