. 2023 Jun;114(6):1458-1474.
doi: 10.1111/tpj.16204. Epub 2023 Apr 11.

STN7 is not essential for developmental acclimation of Arabidopsis to light intensity

Affiliations

STN7 is not essential for developmental acclimation of Arabidopsis to light intensity

Sarah E Flannery et al. Plant J. 2023 Jun.

Abstract

Plants respond to changing light intensity in the short term through regulation of light harvesting, electron transfer, and metabolism to mitigate redox stress. A sustained shift in light intensity leads to a long-term acclimation response (LTR). This involves adjustment in the stoichiometry of photosynthetic complexes through de novo synthesis and degradation of specific proteins associated with the thylakoid membrane. The light-harvesting complex II (LHCII) serine/threonine kinase STN7 plays a key role in short-term light harvesting regulation and was also suggested to be crucial to the LTR. Arabidopsis plants lacking STN7 (stn7) shifted to low light experience higher photosystem II (PSII) redox pressure than the wild type or those lacking the cognate phosphatase TAP38 (tap38), while the reverse is true at high light, where tap38 suffers more. In principle, the LTR should allow optimisation of the stoichiometry of photosynthetic complexes to mitigate these effects. We used quantitative label-free proteomics to assess how the relative abundance of photosynthetic proteins varied with growth light intensity in wild-type, stn7, and tap38 plants. All plants were able to adjust photosystem I, LHCII, cytochrome b6 f, and ATP synthase abundance with changing white light intensity, demonstrating neither STN7 nor TAP38 is crucial to the LTR per se. However, stn7 plants grown for several weeks at low light (LL) or moderate light (ML) still showed high PSII redox pressure and correspondingly lower PSII efficiency, CO2 assimilation, and leaf area compared to wild-type and tap38 plants, hence the LTR is unable to fully ameliorate these symptoms. In contrast, under high light growth conditions the mutants and wild type behaved similarly. These data are consistent with the paramount role of STN7-dependent LHCII phosphorylation in tuning PSII redox state for optimal growth in LL and ML conditions.

Keywords: Arabidopsis thaliana; acclimation; electron transfer; light harvesting; photosynthesis; photosystem; proteomics; signalling; thylakoid.


Conflict of interest statement

The authors have no conflict of interest to declare.

Figures

Figure 1
Figure 1
stn7 plants show reduced growth and CO2 assimilation in LL and ML and tap38 plants show enhanced growth at LL compared to WT. (a) Plants were initially grown under moderate light (ML, Step 1) at 150 μmol photons m−2 s−1 and then acclimated (Step 2) under low light (LL) at 25 μmol photons m−2 s−1 or high light (HL) at 500 μmol photons m−2 s−1 (HL) or maintained under ML conditions (see Methods). The plants were photographed at 2 weeks post‐Step 1 and at 7 (LL), 5 (ML), and 4 (HL) weeks post‐Step 2. (b) Leaf area (mm2) of plants following 7 (LL), 5 (ML), or 4 (HL) weeks of growth shown as violin plots (n = 15). Pairwise significant differences between light intensity/genotype experiments, calculated using one‐way anova with Tukey's multiple comparisons post hoc test are: a/b (P ≤ 0.0001), a/c (P = 0.0011), b/c (P ≤ 0.0001), a/d (P = 0.0013), b/d (P = 0.0021), and c/d (P = 0.0022). (c) CO2 assimilation. (d) PSII quantum yield (Y(II)). (e) PSI acceptor side limitation (Y(NA)). All values in panels (c–e) were measured at either 25 or 500 μmol photons m−2 s−1 (PAR) using 635 nm LEDs. In panels (c)–(e), * denotes significant differences with respect to WT at each light intensity as determined by a modified Welch's t‐test (n = 4, q < 0.05).
Figure 2
Figure 2
Relative label‐free quantification of the major photosynthetic complexes by mass spectrometry. (a) Principal component analysis of thylakoid protein iBAQ intensities in WT (blue), stn7 (red), and tap38 (green) plants grown under LL (squares), ML (circles), and HL (triangles). (b) Heatmap showing the abundances of key photosynthesis‐related proteins and complexes expressed as a percentage of the WT under ML and shaded according to the scale on the left. Each pixel represents the mean of three independent biological replicates, each derived from a pooled thylakoid membrane preparation extracted from 15 plants. The 27 samples were analysed by nanoLC‐MS as three technical repeats (81 analyses in total) in randomised order. Each biological replicate is represented by the median of its three technical repeats. Comparisons of the protein complexes (PSII, PSI, cytb 6 f, and ATP synthase) were made using the sum of the normalised abundance scores of their subunits. Significant differences in relative abundance compared to WT in each light condition, calculated using two‐way anova with Tukey's multiple comparisons post hoc test, are indicated as P < 0.05 (*), P < 0.01 (**), P < 0.001 (***), and P < 0.0001 (****).
Figure 3
Figure 3
Analysis of PSI and PSII light‐harvesting antenna protein composition by mass spectrometry. (a) Heatmap of the abundances of photosynthetic antenna proteins, expressed as a percentage of the WT at ML. The pixels are shaded and significant differences compared to WT are indicated by asterisks as described in Figure 2. (b, c) BN‐PAGE of solubilised stromal lamellae (b) and granal thylakoid fractions (c).
Figure 4
Figure 4
Assessment of changes in cyclic electron transfer (CET) and non‐photochemical quenching (NPQ) during developmental acclimation. (a) P700 oxidation half‐time upon illumination with 255 μmol photons m−2 s−1 740 nm light (estimation of CET; Joliot & Joliot, 2002) with pairwise significant differences calculated using one‐way anova with Tukey's multiple comparisons test: a/b (P = 0.011), a/c (P ≤ 0.0001), a/d (P ≤ 0.0001), a/e (P ≤ 0.0001), b/c (P = 0.021), b/d (P ≤ 0.0001), b/e (P ≤ 0.0001), c/d (P = 0.0099), c/e (P ≤ 0.00010, and d/e (P = 0.015). (b) CET estimated as a proportion of total electron transfer using the ECS method (Kramer et al., 2021) with pairwise significant differences calculated using one‐way anova with Tukey's multiple comparisons test: a/b (P = 0.0013), a/c (P ≤ 0.0001), and b/c (P = 0.0099). (c) Heatmap of MS analysis showing the relative abundance of CET‐ and NPQ‐related proteins in WT, stn7, and tap38 acclimated to LL, ML, and HL, expressed as a percentage of the WT at ML. The pixels are shaded and significant differences compared to WT are indicated by asterisks as described in Figure 2. (d) Pearson correlation of the CET activity measured by ECS and P700+ oxidation half‐time methods with protein iBAQ values of CET‐related proteins. (e) qE and qI measured following 5 min of illumination at 500 μmol photons m−2 s−1 635 nm light. (f) Pearson correlation of the maximum qE and qI values with iBAQ values of NPQ‐related proteins. Blue panels indicate a positive correlation while red panels indicate a negative correlation.
Figure 5
Figure 5
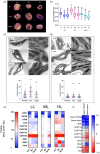
Assessment of changes in thylakoid membrane grana size during developmental acclimation. (a) 3D‐SIM images (shown as Max Projections on the z‐axis with tricubic sharp interpolation) of chloroplasts in WT, stn7, and tap38 plants acclimated to LL, ML, and HL (scale bar: 0.5 μm). (b) Full width at half‐maximum (FWHM) fluorescence intensity of the fluorescent spots (grana) in 3D‐SIM images of chloroplasts in LL (n = 67), ML (n = 84), and HL (n = 71) leaves. Data are presented as mean ± SD. Pairwise significant differences were calculated using one‐way anova with Tukey's multiple comparisons test: a/b (P = 0.034), a/c (P = 0.017), a/d (P = 0.044), b/c (P = 0.009), b/d (P = 0.047), and c/d (P ≤ 0.0001). (c) Thin‐section electron micrographs of chloroplasts in WT, stn7, and tap38 acclimated to LL (scale bar: 0.5 μm). Graph shows the number of membrane layers per grana stack calculated from electron microscopy images of chloroplasts in LL WT (n = 116), stn7 (n = 121), and tap38 (n = 102) (one‐way anova with Tukey's multiple comparisons). ****P < 0.0001. Data are presented as mean ± SD. (d) Thin‐section electron micrographs of chloroplasts in WT, stn7, and tap38 acclimated to HL (scale bar: 0.5 μm). Graph shows the number of membrane layers per grana stack calculated from electron microscopy images of chloroplasts in HL Col‐0 (n = 332), stn7 (n = 192), and tap38 (n = 185) (one‐way anova with Tukey's multiple comparisons). ****P < 0.0001. Data are presented as mean ± SD. (e) Heatmap of MS analysis showing the relative abundance of grana stacking‐related proteins in WT, stn7, and tap38 acclimated to LL, ML, and HL, expressed as a percentage of the WT mean at ML. The pixels are shaded and significant differences compared to WT are indicated by asterisks as described in Figure 2. (f) Pearson correlation of the mean number of membrane layers per granum and grana FWHM with iBAQ values of grana stacking‐related proteins. Blue panels indicate a positive correlation while red panels indicate a negative correlation.

References

    1. Adamiec, M. , Drath, M. & Jackowski, G. (2008) Redox state of plastoquinone pool regulates expression of Arabidopsis thaliana genes in response to elevated irradiance. Acta Biochimica Polonica, 55, 161–174. - PubMed
    1. Albertsson, P.A. , Andreasson, E. , Stefansson, H. & Wollenberger, L. (1994) Fractionation of thylakoid membrane. Methods in Enzymology, 228, 469–482.
    1. Amstutz, C.L. , Fristedt, R. , Schultink, A. , Merchant, S.S. , Niyogi, K.K. & Malnoë, A. (2020) An atypical short‐chain dehydrogenase–reductase functions in the relaxation of photoprotective qH in Arabidopsis. Nature Plants, 6, 154–166. - PMC - PubMed
    1. Anderson, J. , Chow, W. & Goodchild, D. (1988) Thylakoid membrane organisation in sun/shade acclimation. Australian Journal of Plant Physiology, 15, 11–26.
    1. Anderson, J.M. (1986) Photoregulation of the composition, function and structure of thylakoid membranes. Annual Review of Plant Physiology, 37, 93–136.

Publication types

MeSH terms

Substances