

Air Pollution and Mortality at the Intersection of Race and Social Class
- PMID: 36961127
- PMCID: PMC10182569
- DOI: 10.1056/NEJMsa2300523
Air Pollution and Mortality at the Intersection of Race and Social Class
Abstract
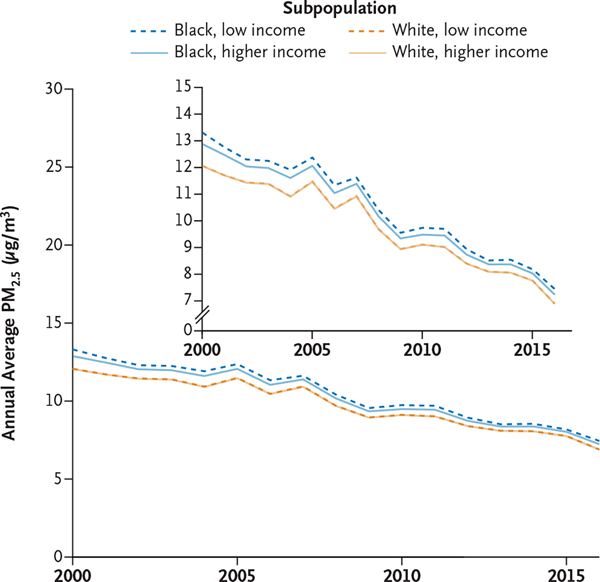
Background: Black Americans are exposed to higher annual levels of air pollution containing fine particulate matter (particles with an aerodynamic diameter of ≤2.5 μm [PM2.5]) than White Americans and may be more susceptible to its health effects. Low-income Americans may also be more susceptible to PM2.5 pollution than high-income Americans. Because information is lacking on exposure-response curves for PM2.5 exposure and mortality among marginalized subpopulations categorized according to both race and socioeconomic position, the Environmental Protection Agency lacks important evidence to inform its regulatory rulemaking for PM2.5 standards.
Methods: We analyzed 623 million person-years of Medicare data from 73 million persons 65 years of age or older from 2000 through 2016 to estimate associations between annual PM2.5 exposure and mortality in subpopulations defined simultaneously by racial identity (Black vs. White) and income level (Medicaid eligible vs. ineligible).
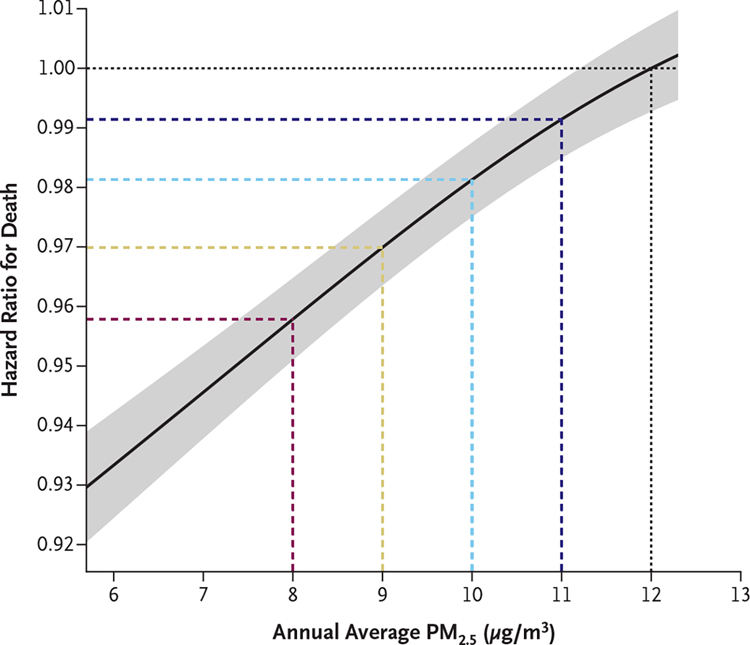
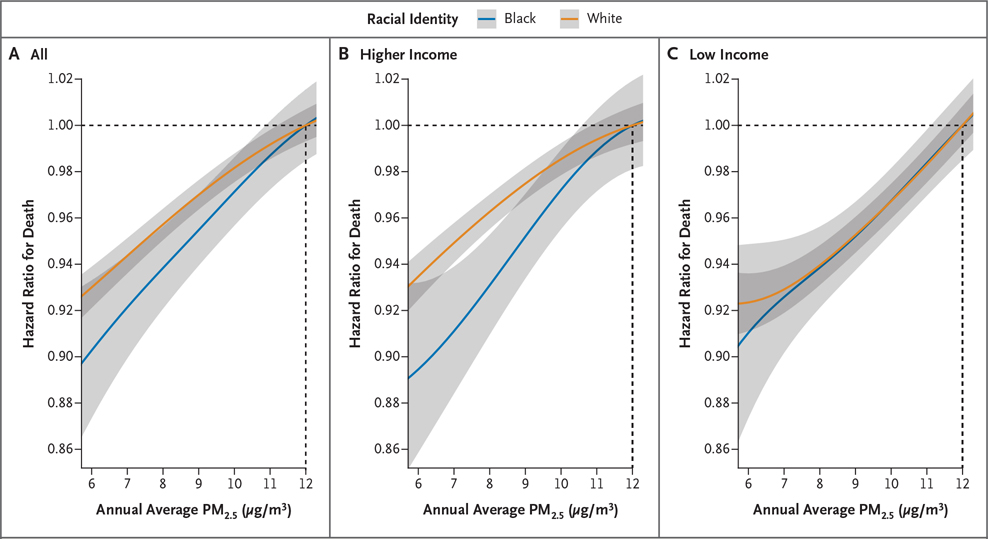
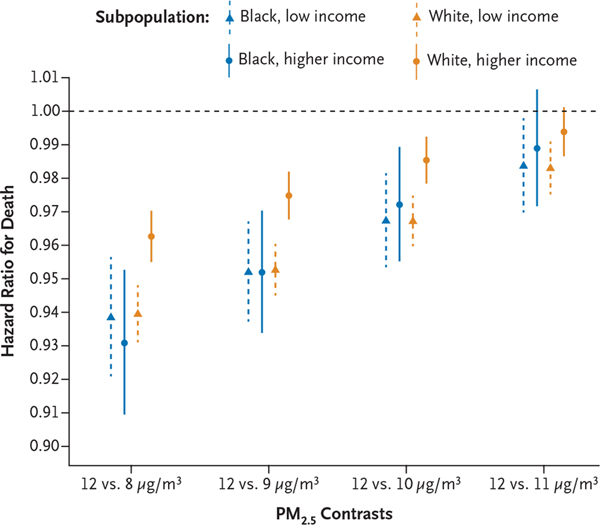
Results: Lower PM2.5 exposure was associated with lower mortality in the full population, but marginalized subpopulations appeared to benefit more as PM2.5 levels decreased. For example, the hazard ratio associated with decreasing PM2.5 from 12 μg per cubic meter to 8 μg per cubic meter for the White higher-income subpopulation was 0.963 (95% confidence interval [CI], 0.955 to 0.970), whereas equivalent hazard ratios for marginalized subpopulations were lower: 0.931 (95% CI, 0.909 to 0.953) for the Black higher-income subpopulation, 0.940 (95% CI, 0.931 to 0.948) for the White low-income subpopulation, and 0.939 (95% CI, 0.921 to 0.957) for the Black low-income subpopulation.
Conclusions: Higher-income Black persons, low-income White persons, and low-income Black persons may benefit more from lower PM2.5 levels than higher-income White persons. These findings underscore the importance of considering racial identity and income together when assessing health inequities. (Funded by the National Institutes of Health and the Alfred P. Sloan Foundation.).
Copyright © 2023 Massachusetts Medical Society.
Figures
References
-
- Chen J, Hoek G. Long-term exposure to PM and all-cause and cause-specific mortality: a systematic review and meta-analysis. Environ Int 2020;143:105974. - PubMed
-
- Advancing the framework for assessing causality of health and welfare effects to inform national ambient air quality standard reviews. Washington, DC: National Academies Press, 2022. - PubMed
-
- Policy assessment for the reconsideration of the national ambient air quality standards for particulate matter. Research Triangle Park, NC: Environmental Protection Agency, 2022. (https://www.epa.gov/system/files/documents/2022-05/Final%20Policy%20Asse...).
-
- Brauer M, Brook JR, Christidis T, et al. Mortality–air pollution associations in low exposure environments (MAPLE): phase 2. Boston: Health Effects Institute, 2022. (https://www.healtheffects.org/publication/mortality-air-pollution-associ...). - PMC - PubMed
-
- Brunekreef B, Strak M, Chen J, et al. Mortality and morbidity effects of long-term exposure to low-level PM2.5, BC, NO2, and O3: an analysis of European cohorts in the ELAPSE project. Boston: Health Effects Institute, 2021. (https://www.healtheffects.org/publication/mortality-and-morbidity-effect...). - PMC - PubMed
Publication types
MeSH terms
Substances
Grants and funding
LinkOut - more resources
Full Text Sources
Medical