

Estimation of species divergence times in presence of cross-species gene flow
- PMID: 36961245
- PMCID: PMC10405360
- DOI: 10.1093/sysbio/syad015
Estimation of species divergence times in presence of cross-species gene flow
Abstract
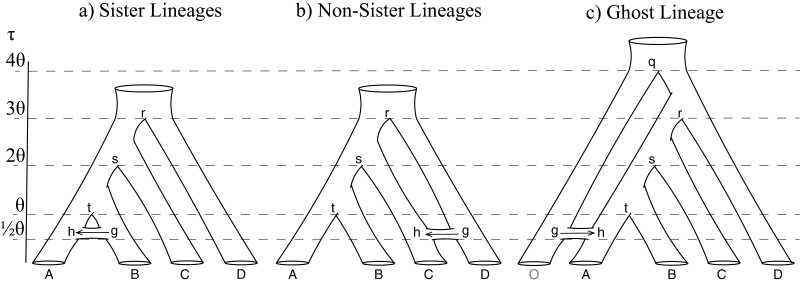
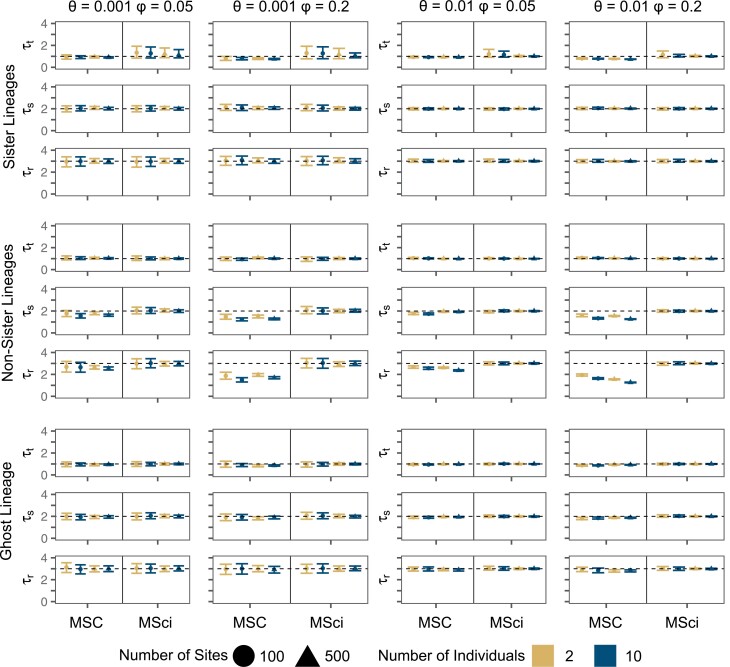
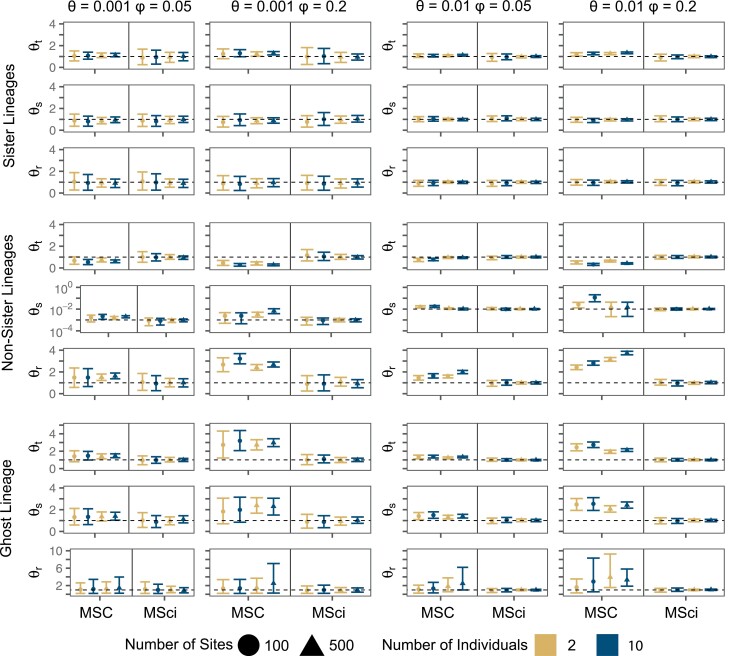
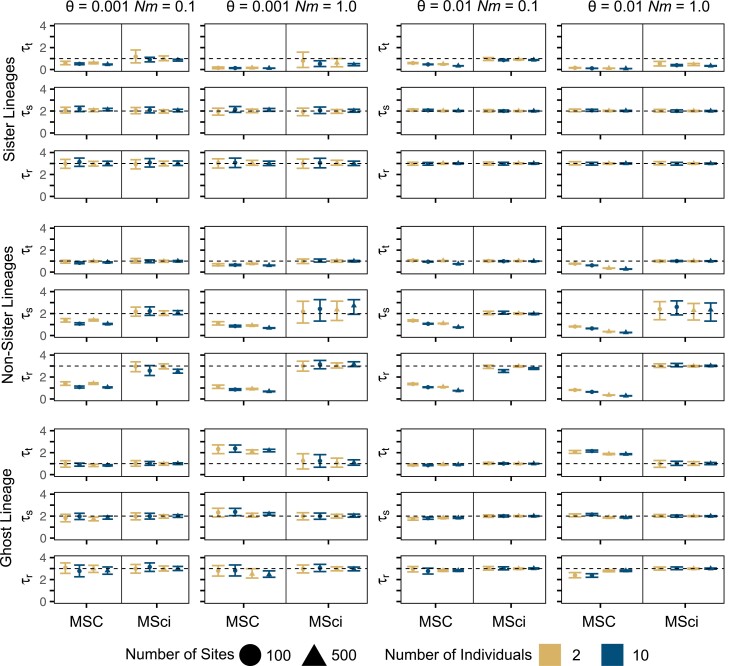
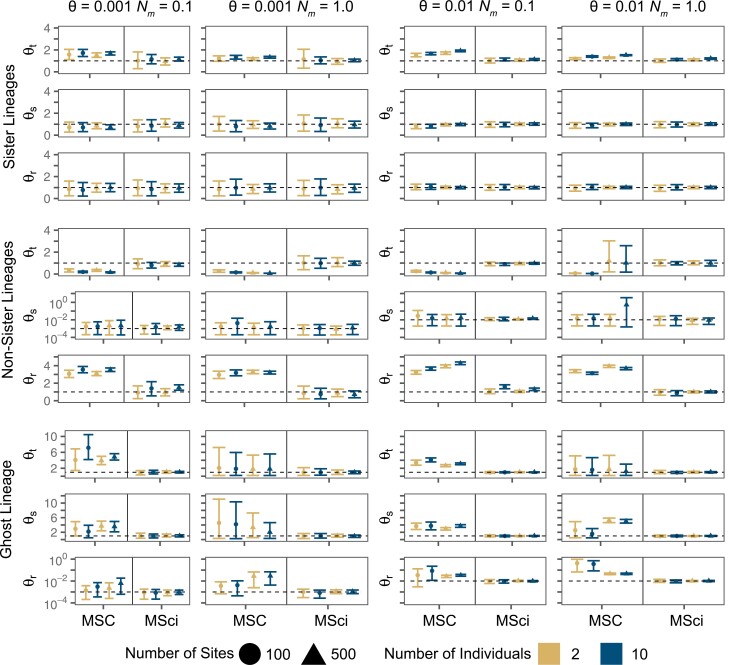
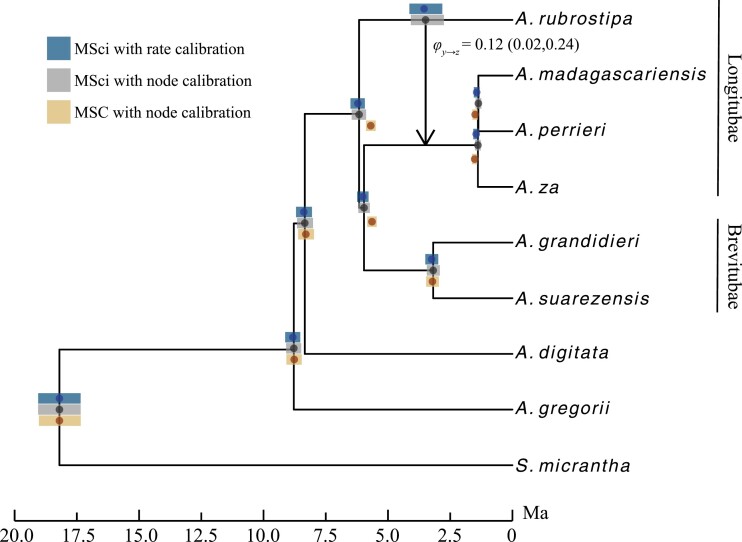
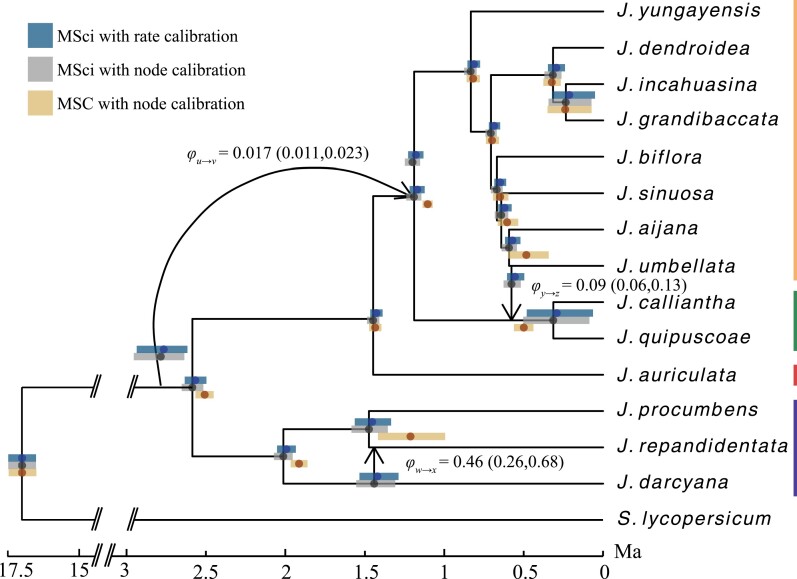
Cross-species introgression can have significant impacts on phylogenomic reconstruction of species divergence events. Here, we used simulations to show how the presence of even a small amount of introgression can bias divergence time estimates when gene flow is ignored in the analysis. Using advances in analytical methods under the multispecies coalescent (MSC) model, we demonstrate that by accounting for incomplete lineage sorting and introgression using large phylogenomic data sets this problem can be avoided. The multispecies-coalescent-with-introgression (MSci) model is capable of accurately estimating both divergence times and ancestral effective population sizes, even when only a single diploid individual per species is sampled. We characterize some general expectations for biases in divergence time estimation under three different scenarios: 1) introgression between sister species, 2) introgression between non-sister species, and 3) introgression from an unsampled (i.e., ghost) outgroup lineage. We also conducted simulations under the isolation-with-migration (IM) model and found that the MSci model assuming episodic gene flow was able to accurately estimate species divergence times despite high levels of continuous gene flow. We estimated divergence times under the MSC and MSci models from two published empirical datasets with previous evidence of introgression, one of 372 target-enrichment loci from baobabs (Adansonia), and another of 1000 transcriptome loci from 14 species of the tomato relative, Jaltomata. The empirical analyses not only confirm our findings from simulations, demonstrating that the MSci model can reliably estimate divergence times but also show that divergence time estimation under the MSC can be robust to the presence of small amounts of introgression in empirical datasets with extensive taxon sampling. [divergence time; gene flow; hybridization; introgression; MSci model; multispecies coalescent].
© The Author(s) 2023. Published by Oxford University Press on behalf of the Society of Systematic Biologists.
Figures
References
-
- Angelis K., dos Reis M.. 2015. The impact of ancestral population size and incomplete lineage sorting on Bayesian estimation of species divergence times. Cur. Zool. 61:874–885.
-
- Barker M.S., Arrigo N., Baniaga A.E., Li Z., Levin D.A.. 2016. On the relative abundance of autopolyploids and allopolyploids. New Phytol. 210:391–398. - PubMed
-
- Barley A.J., Brown J.M., Thomson R.C.. 2018. Impact of model violations on the inference of species boundaries under the multispecies coalescent. Syst. Biol. 67:269–284. - PubMed
-
- Barley A.J., Nieto-Montes de Oca A., Reeder T.W., Manriquez-Moran N.L., Arenas Monroy J.C., Hernandez-Gallegos O., Thomson R.C.. 2019. Complex patterns of hybridization and introgression across evolutionary timescales in Mexican whiptail lizards (Aspidoscelis). Mol. Phylogenet. Evol. 132:284–295. - PubMed
Publication types
MeSH terms
Associated data
Grants and funding
- BB/N000609/1/BB_/Biotechnology and Biological Sciences Research Council/United Kingdom
- R01 GM123306/GM/NIGMS NIH HHS/United States
- BB/T003502/1/BB_/Biotechnology and Biological Sciences Research Council/United Kingdom
- BB/P006493/1/BB_/Biotechnology and Biological Sciences Research Council/United Kingdom
