. 2023 Jun 2;11(6):747-762.
doi: 10.1158/2326-6066.CIR-22-0621.

The Immunopeptidome from a Genomic Perspective: Establishing the Noncanonical Landscape of MHC Class I-Associated Peptides

Affiliations

The Immunopeptidome from a Genomic Perspective: Establishing the Noncanonical Landscape of MHC Class I-Associated Peptides

Georges Bedran et al. Cancer Immunol Res. .

Abstract

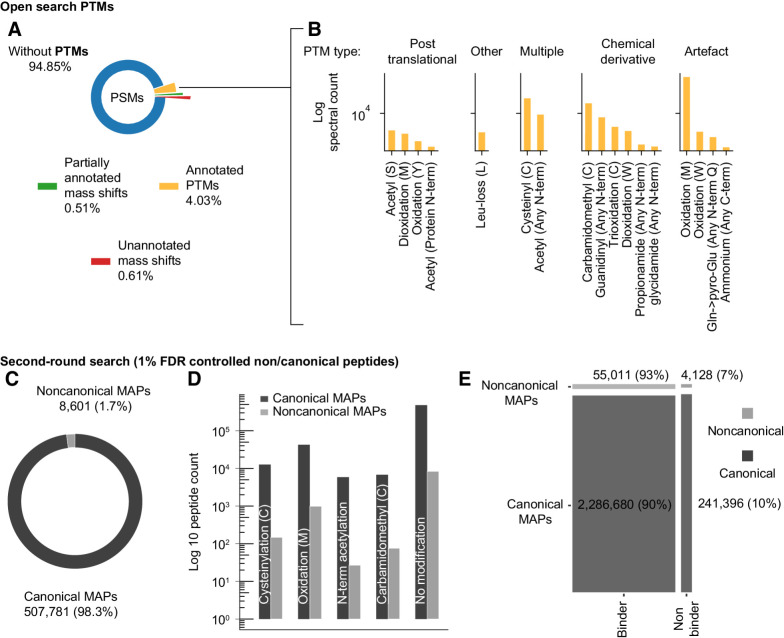
Tumor antigens can emerge through multiple mechanisms, including translation of noncoding genomic regions. This noncanonical category of tumor antigens has recently gained attention; however, our understanding of how they recur within and between cancer types is still in its infancy. Therefore, we developed a proteogenomic pipeline based on deep learning de novo mass spectrometry (MS) to enable the discovery of noncanonical MHC class I-associated peptides (ncMAP) from noncoding regions. Considering that the emergence of tumor antigens can also involve posttranslational modifications (PTM), we included an open search component in our pipeline. Leveraging the wealth of MS-based immunopeptidomics, we analyzed data from 26 MHC class I immunopeptidomic studies across 11 different cancer types. We validated the de novo identified ncMAPs, along with the most abundant PTMs, using spectral matching and controlled their FDR to 1%. The noncanonical presentation appeared to be 5 times enriched for the A03 HLA supertype, with a projected population coverage of 55%. The data reveal an atlas of 8,601 ncMAPs with varying levels of cancer selectivity and suggest 17 cancer-selective ncMAPs as attractive therapeutic targets according to a stringent cutoff. In summary, the combination of the open-source pipeline and the atlas of ncMAPs reported herein could facilitate the identification and screening of ncMAPs as targets for T-cell therapies or vaccine development.


Figures

Figure 1. Infographics of immunopeptidomic datasets included in this study. A, Different types of cancer considered in this study with the number of samples and sample types per cancer type. B, Proportions of different MS instruments used in this study. C, Antibodies used for IP. D, Overall count of HLA alleles per HLA gene. E, Overall count of MS immunopeptidomic samples per HLA allele.
Figure 1.
Infographics of immunopeptidomic datasets included in this study. A, Different types of cancer considered in this study with the number of samples and sample types per cancer type. B, Proportions of different MS instruments used in this study. C, Antibodies used for IP. D, Overall count of HLA alleles per HLA gene. E, Overall count of MS immunopeptidomic samples per HLA allele.
Figure 2. COD-dipp: A new high-throughput pipeline for a deep interrogation of immunopeptidomic datasets. Samples are first analyzed with an open search strategy to detect the landscape of PTMs. An FLR for the PTMs and FDR of 1% are applied. Simultaneously, the samples are analyzed using a novel de novo approach to identify noncanonical peptides. The de novo strategy trains a model per sample using quality-controlled PSMs from the MS-GF+ search engine to learn the direct interpretation of sample-specific mass spectra. The MS-GF+ results are split into three groups: training and testing to tune the hyperparameters and account for overfitting, and a validation group to approximate the accuracy per sample. De novo predicted peptides with an accuracy of at least 90% are sequentially mapped against the Human proteome (HP) then a 3-frame translation (3FT) database of protein-coding genes (1 mismatch allowed between leucine/isoleucine, i.e., Xle). Predicted de novo peptides matching any known protein are labeled “canonical”. Peptides mapping to the 3FT database with at least 3 amino acids mismatches from any known protein sequence are labeled “noncanonical”. Finally, a second-round search is performed as a validation approach. Four of the most abundantly identified PTMs and a custom database consisting of ENSEMBL proteins and noncanonical peptides are considered. The resulting canonical and noncanonical peptides are controlled to an FDR of 1% and aligned to the hg38 human genome.
Figure 2.
COD-dipp: A new high-throughput pipeline for a deep interrogation of immunopeptidomic datasets. Samples are first analyzed with an open search strategy to detect the landscape of PTMs. An FLR for the PTMs and FDR of 1% are applied. Simultaneously, the samples are analyzed using a novel de novo approach to identify noncanonical peptides. The de novo strategy trains a model per sample using quality-controlled PSMs from the MS-GF+ search engine to learn the direct interpretation of sample-specific mass spectra. The MS-GF+ results are split into three groups: training and testing to tune the hyperparameters and account for overfitting, and a validation group to approximate the accuracy per sample. De novo predicted peptides with an accuracy of at least 90% are sequentially mapped against the Human proteome (HP) then a 3-frame translation (3FT) database of protein-coding genes (1 mismatch allowed between leucine/isoleucine, i.e., Xle). Predicted de novo peptides matching any known protein are labeled “canonical”. Peptides mapping to the 3FT database with at least 3 amino acids mismatches from any known protein sequence are labeled “noncanonical”. Finally, a second-round search is performed as a validation approach. Four of the most abundantly identified PTMs and a custom database consisting of ENSEMBL proteins and noncanonical peptides are considered. The resulting canonical and noncanonical peptides are controlled to an FDR of 1% and aligned to the hg38 human genome.
Figure 3. Landscape of posttranslationally modified and ncMAPs. Open search: A, Overview of PTMs identified by open search (blue: spectra without PTMs, orange: spectra with a known UNIMOD PTM localized on a specific amino acid on the peptide. Green: The mass shift is localized, however the known PTM options do not fit the modified residue. Red: Otherwise). B, Most abundant “annotated PTMs” grouped by type. Second-round search: C, Fraction of canonical (dark gray) and noncanonical (light gray) MAPs in the immunopeptidome. D, Proportion of canonical (dark gray) and noncanonical (light gray) MAPs with/without PTMs. E, Fraction of binders versus nonbinders for both canonical and noncanonical MAPs using NetMHCpan 4.1.
Figure 3.
Landscape of posttranslationally modified and ncMAPs. Open search: A, Overview of PTMs identified by open search (blue: spectra without PTMs, orange: spectra with a known UNIMOD PTM localized on a specific amino acid on the peptide. Green: The mass shift is localized, however the known PTM options do not fit the modified residue. Red: Otherwise). B, Most abundant “annotated PTMs” grouped by type. Second-round search: C, Fraction of canonical (dark gray) and noncanonical (light gray) MAPs in the immunopeptidome. D, Proportion of canonical (dark gray) and noncanonical (light gray) MAPs with/without PTMs. E, Fraction of binders versus nonbinders for both canonical and noncanonical MAPs using NetMHCpan 4.1.
Figure 4. Comparison of COD-dipp ncMAPs with other studies. Because the COD-dipp ncMAPs are restricted to the 3-frame translation (3FT) of protein-coding genes, sequences from the literature were aligned to the same 3FT database for comparison purposes. The intersection is based on genomic coordinates to deal with sequences that partially match (i.e., longer, shorter, or partially overlapping). Because the Venn is generated by overlapping genomic coordinates of the ncMAPs, the original counts for each study are listed from left to right (i.e., on the right-hand side of panel C, the notation 29/41 refers to 29 instances for Chong and colleagues 2020 and 41 for COD-dipp). A, Comparison with peptide-PRISM published ncMAPs at a 10% FDR. COD-dipp ncMAPs were restricted to 3 studies in common with Erhard and colleagues 2020. B, Comparison with peptide-PRISM published ncMAPs at a 1% FDR. COD-dipp ncMAPs were restricted to 3 studies in common with Erhard and colleagues 2020. C, Comparison of the atlas of ncMAPs revealed by COD-dipp to 3 previous studies.
Figure 4.
Comparison of COD-dipp ncMAPs with other studies. Because the COD-dipp ncMAPs are restricted to the 3-frame translation (3FT) of protein-coding genes, sequences from the literature were aligned to the same 3FT database for comparison purposes. The intersection is based on genomic coordinates to deal with sequences that partially match (i.e., longer, shorter, or partially overlapping). Because the Venn is generated by overlapping genomic coordinates of the ncMAPs, the original counts for each study are listed from left to right (i.e., on the right-hand side of panel C, the notation 29/41 refers to 29 instances for Chong and colleagues 2020 and 41 for COD-dipp). A, Comparison with peptide-PRISM published ncMAPs at a 10% FDR. COD-dipp ncMAPs were restricted to 3 studies in common with Erhard and colleagues 2020. B, Comparison with peptide-PRISM published ncMAPs at a 1% FDR. COD-dipp ncMAPs were restricted to 3 studies in common with Erhard and colleagues 2020. C, Comparison of the atlas of ncMAPs revealed by COD-dipp to 3 previous studies.
Figure 5. Origins of ncMAPs. A, Peptide length distribution of canonical (dark gray) and noncanonical (light gray) MAPs. B, Annotation of ncMAPs across gene features. C, Analysis of ncMAPs that could originate from nORF. Upstream start codons of noncanonical MAPs are analyzed for their potential to initiate translation and produce ORFs (left-hand side) as a source of ncMAPs. The frequencies of different start codons for positively predicted TIS are shown on the right-hand side. D, Analysis of ncMAPs from intronic regions that may originate from IR events. Translation of MAPs from IR sources should be in-frame with the corresponding upstream exons. E, Analysis of ncMAPs that could originate from frameshift mutations in cancer. ncMAPs are aligned to an in-silico translated protein database of COSMIC somatic frameshift mutations. F, Summary indicating whether the ncMAPs can be accounted for by any of the analyses conducted in panels C, D, or E.
Figure 5.
Origins of ncMAPs. A, Peptide length distribution of canonical (dark gray) and noncanonical (light gray) MAPs. B, Annotation of ncMAPs across gene features. C, Analysis of ncMAPs that could originate from nORF. Upstream start codons of noncanonical MAPs are analyzed for their potential to initiate translation and produce ORFs (left-hand side) as a source of ncMAPs. The frequencies of different start codons for positively predicted TIS are shown on the right-hand side. D, Analysis of ncMAPs from intronic regions that may originate from IR events. Translation of MAPs from IR sources should be in-frame with the corresponding upstream exons. E, Analysis of ncMAPs that could originate from frameshift mutations in cancer. ncMAPs are aligned to an in-silico translated protein database of COSMIC somatic frameshift mutations. F, Summary indicating whether the ncMAPs can be accounted for by any of the analyses conducted in panels C, D, or E.
Figure 6. Cancer selectivity of ncMAPs. A, Percentage of ncMAPs that were solely in healthy and/or tumor samples by MS (blue) and ncMAPs undetected in healthy samples by MS (red). B, Parent gene expression of ncMAPs in TPM in 29 healthy tissues from 17,382 samples (GTEx v8 dataset). ncMAPs are distributed over two groups: ncMAPs detected in healthy samples by MS in blue, and ncMAPs undetected in healthy samples by MS in red. C, Parent gene expression of ncMAPs in TPM in 29 healthy tissues from 17,382 samples (GTEx v8 dataset). A limit on the gene expression (y-axis) of 1.2 TPM was set to visualize cancer-selective ncMAPs in black.
Figure 6.
Cancer selectivity of ncMAPs. A, Percentage of ncMAPs that were solely in healthy and/or tumor samples by MS (blue) and ncMAPs undetected in healthy samples by MS (red). B, Parent gene expression of ncMAPs in TPM in 29 healthy tissues from 17,382 samples (GTEx v8 dataset). ncMAPs are distributed over two groups: ncMAPs detected in healthy samples by MS in blue, and ncMAPs undetected in healthy samples by MS in red. C, Parent gene expression of ncMAPs in TPM in 29 healthy tissues from 17,382 samples (GTEx v8 dataset). A limit on the gene expression (y-axis) of 1.2 TPM was set to visualize cancer-selective ncMAPs in black.

References

    1. Bassani-Sternberg M, Bräunlein E, Klar R, Engleitner T, Sinitcyn P, Audehm S, et al. . Direct identification of clinically relevant neoepitopes presented on native human melanoma tissue by mass spectrometry. Nat Commun 2016;7:1–16. - PMC - PubMed
    1. Newey A, Griffiths B, Michaux J, Pak HS, Stevenson BJ, Woolston A, et al. . Immunopeptidomics of colorectal cancer organoids reveals a sparse HLA class I neoantigen landscape and no increase in neoantigens with interferon or MEK-inhibitor treatment. J Immunother Cancer 2019;7:309. - PMC - PubMed
    1. Ebrahimi-Nik H, Michaux J, Corwin WL, Keller GLJ, Shcheglova T, Pak H, et al. . Mass spectrometry–driven exploration reveals nuances of neoepitope-driven tumor rejection. JCI Insight 2019;4:e129152. - PMC - PubMed
    1. Blass E, Ott PA. Advances in the development of personalized neoantigen-based therapeutic cancer vaccines. Nat Rev Clin Oncol 2021;18:215–29. - PMC - PubMed
    1. Pearlman AH, Hwang MS, Konig MF, Hsiue EH-C, Douglass J, DiNapoli SR, et al. . Targeting public neoantigens for cancer immunotherapy. Nat Cancer 2021;2:487–97. - PMC - PubMed

Publication types