. 2023 Jun 1;324(6):H804-H820.
doi: 10.1152/ajpheart.00614.2022. Epub 2023 Mar 24.

Functional and molecular determinants of right ventricular response to severe pulmonary hypertension in a large animal model

Affiliations

Functional and molecular determinants of right ventricular response to severe pulmonary hypertension in a large animal model

R Dale Brown et al. Am J Physiol Heart Circ Physiol. .

Abstract

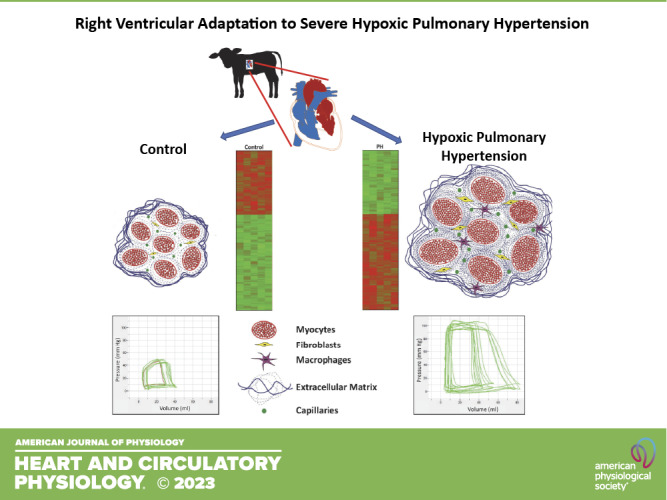
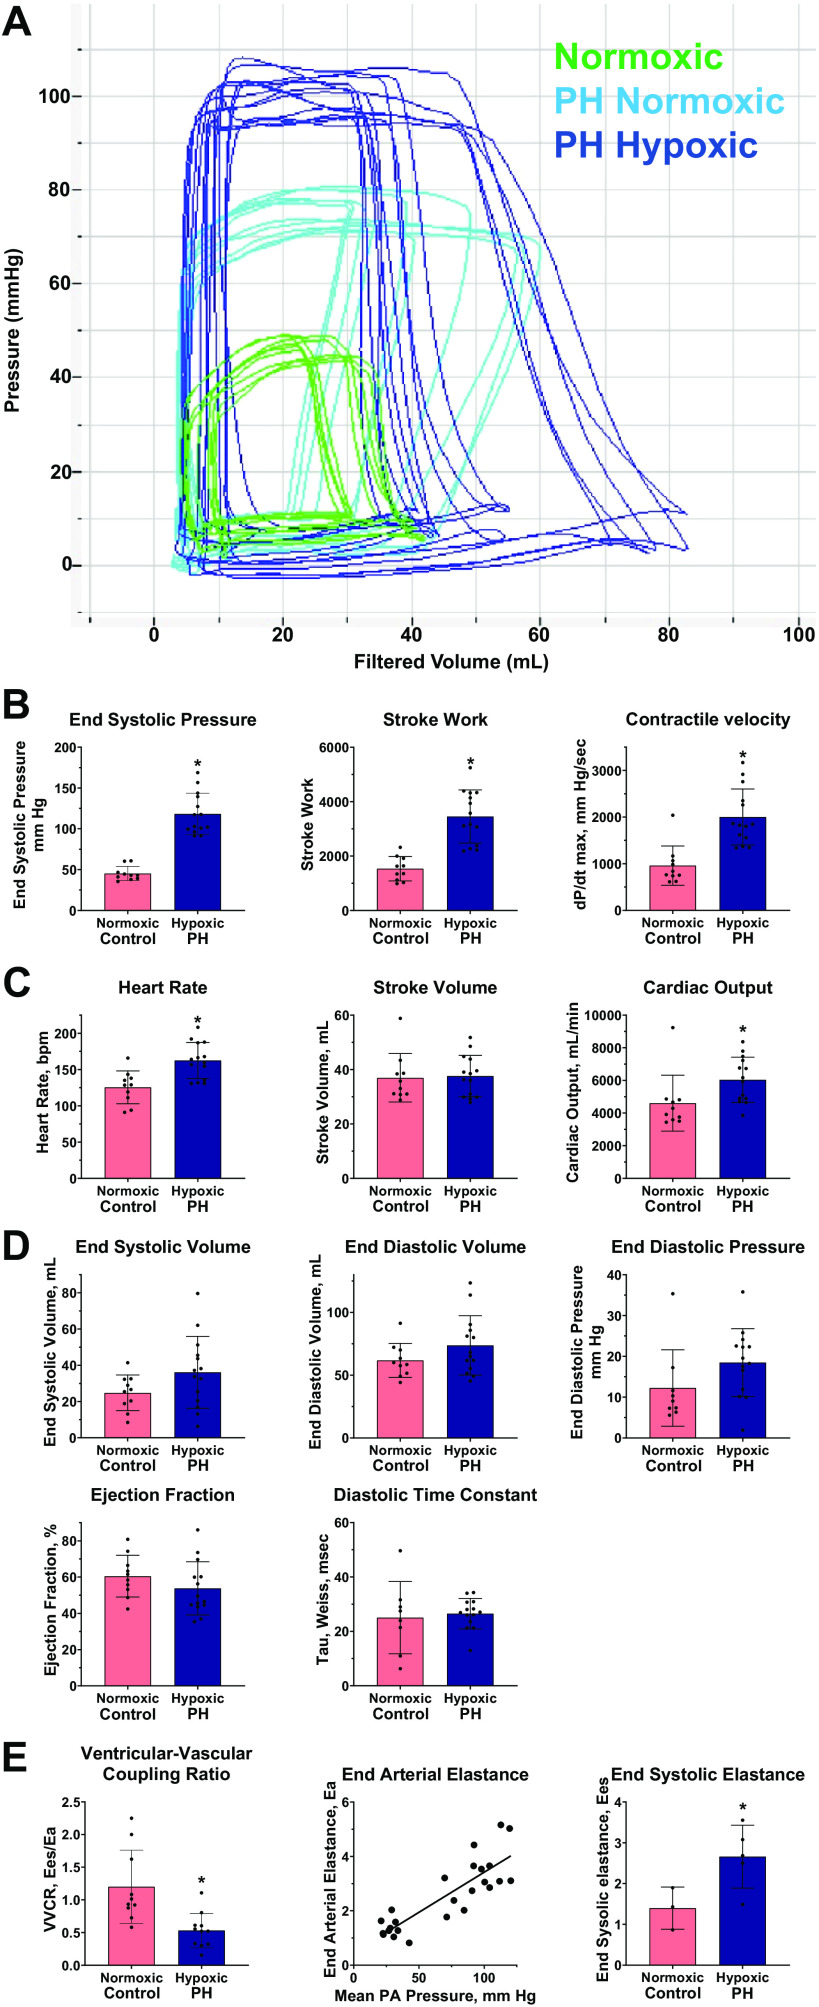
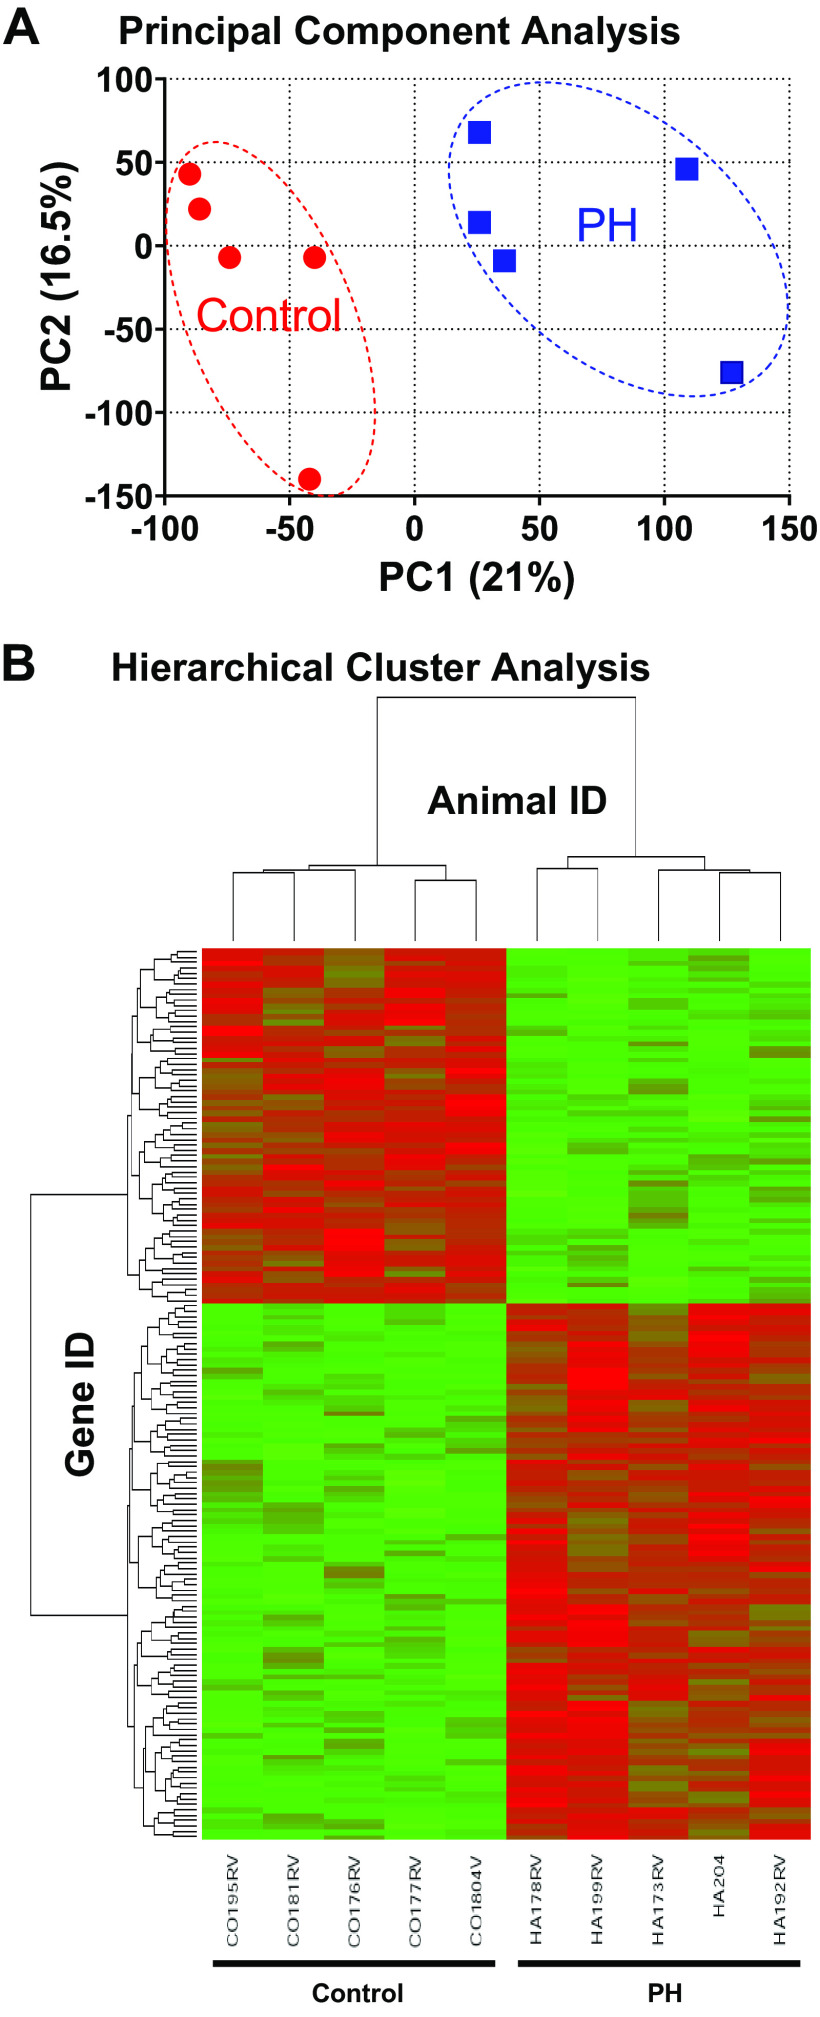
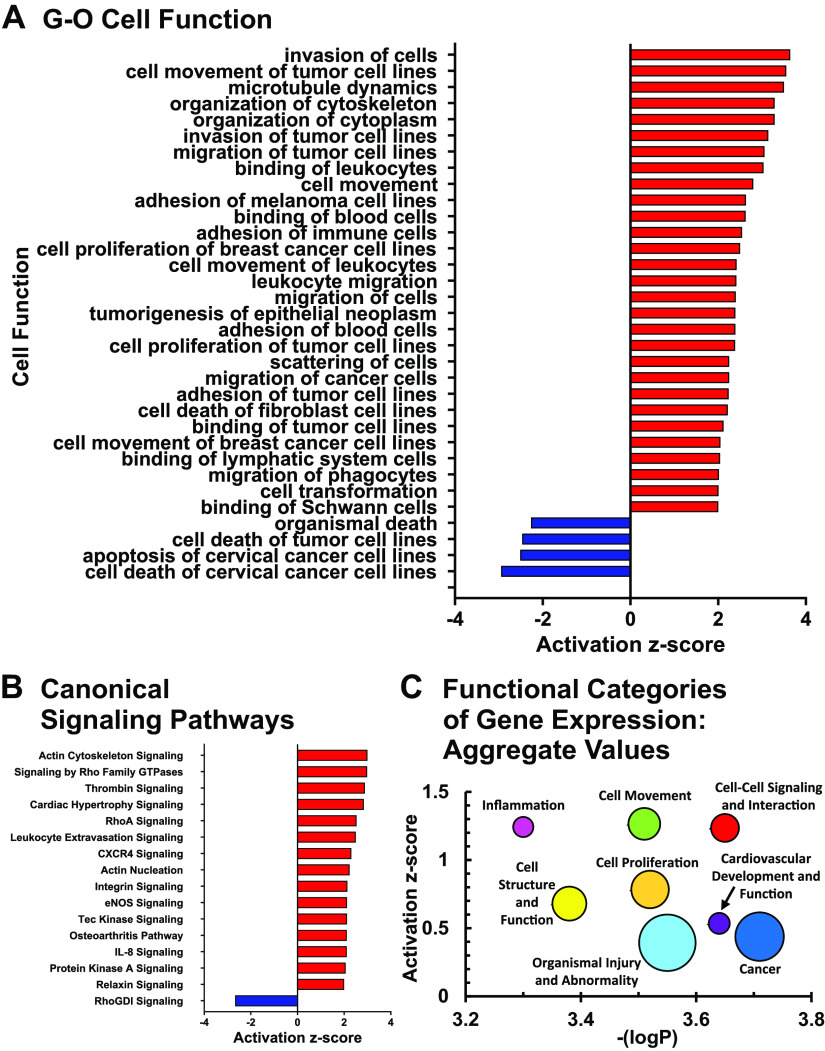
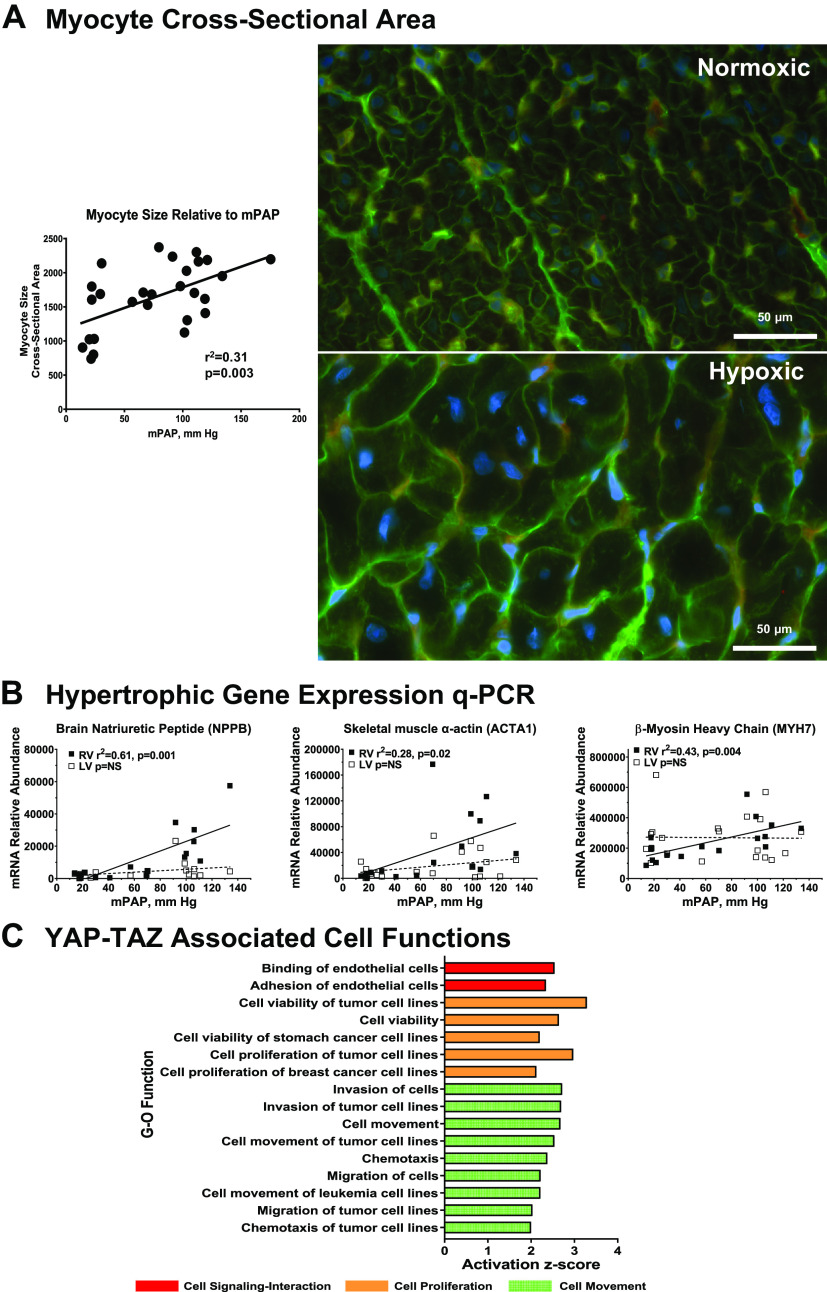
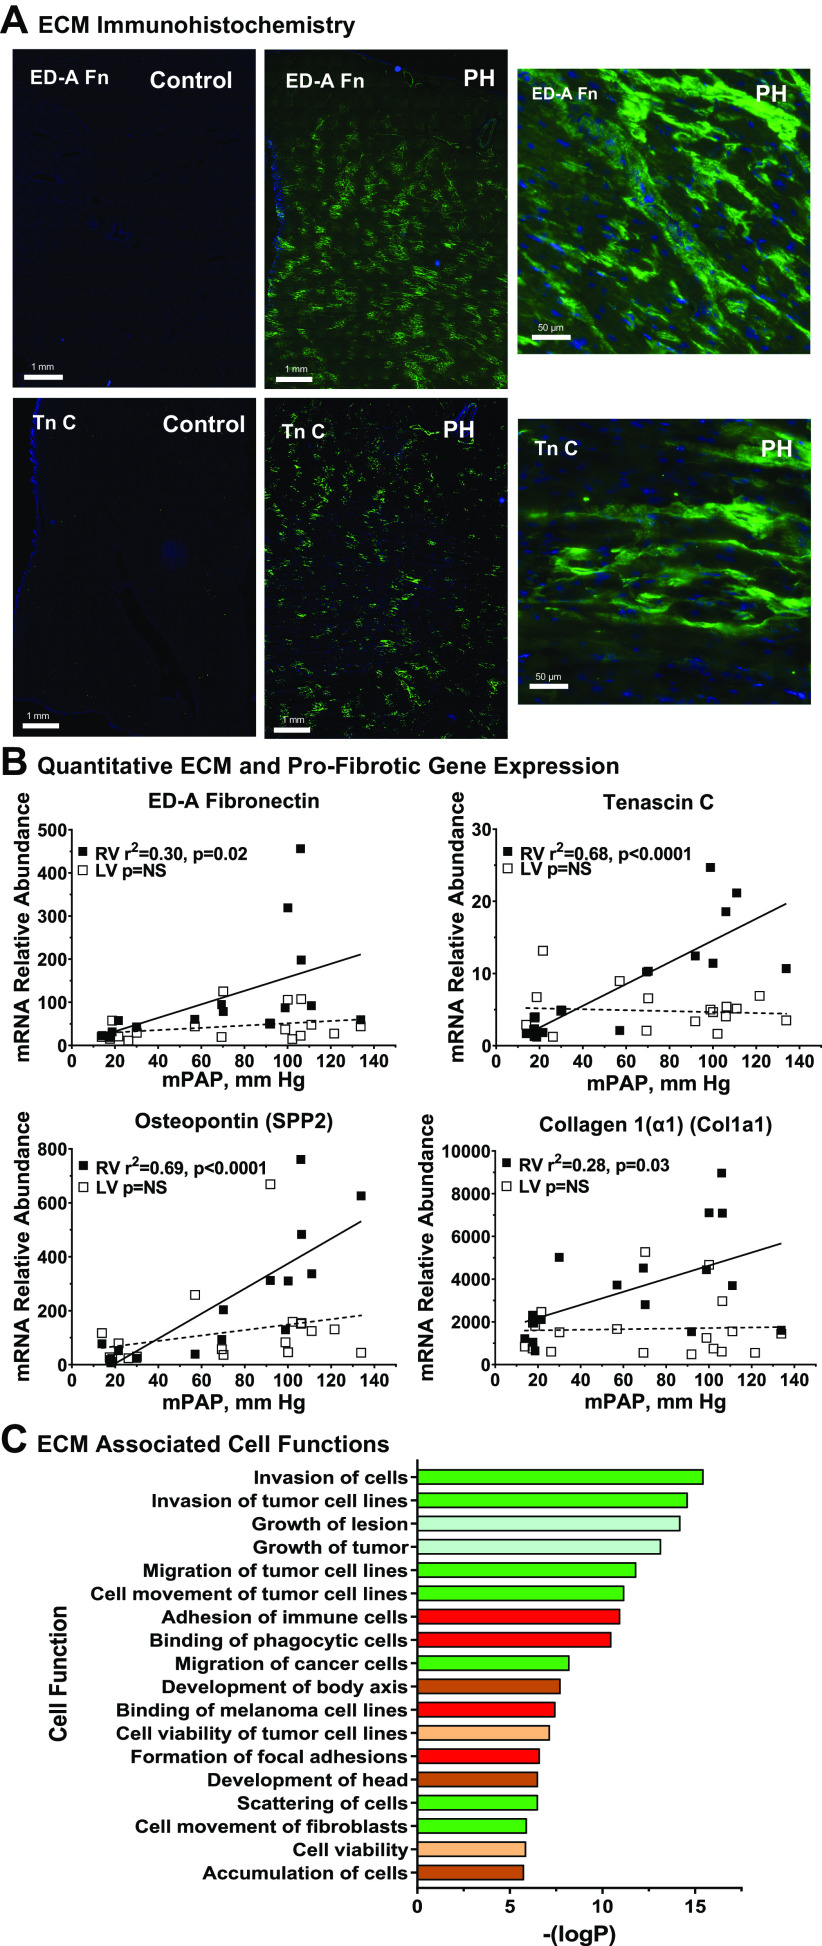
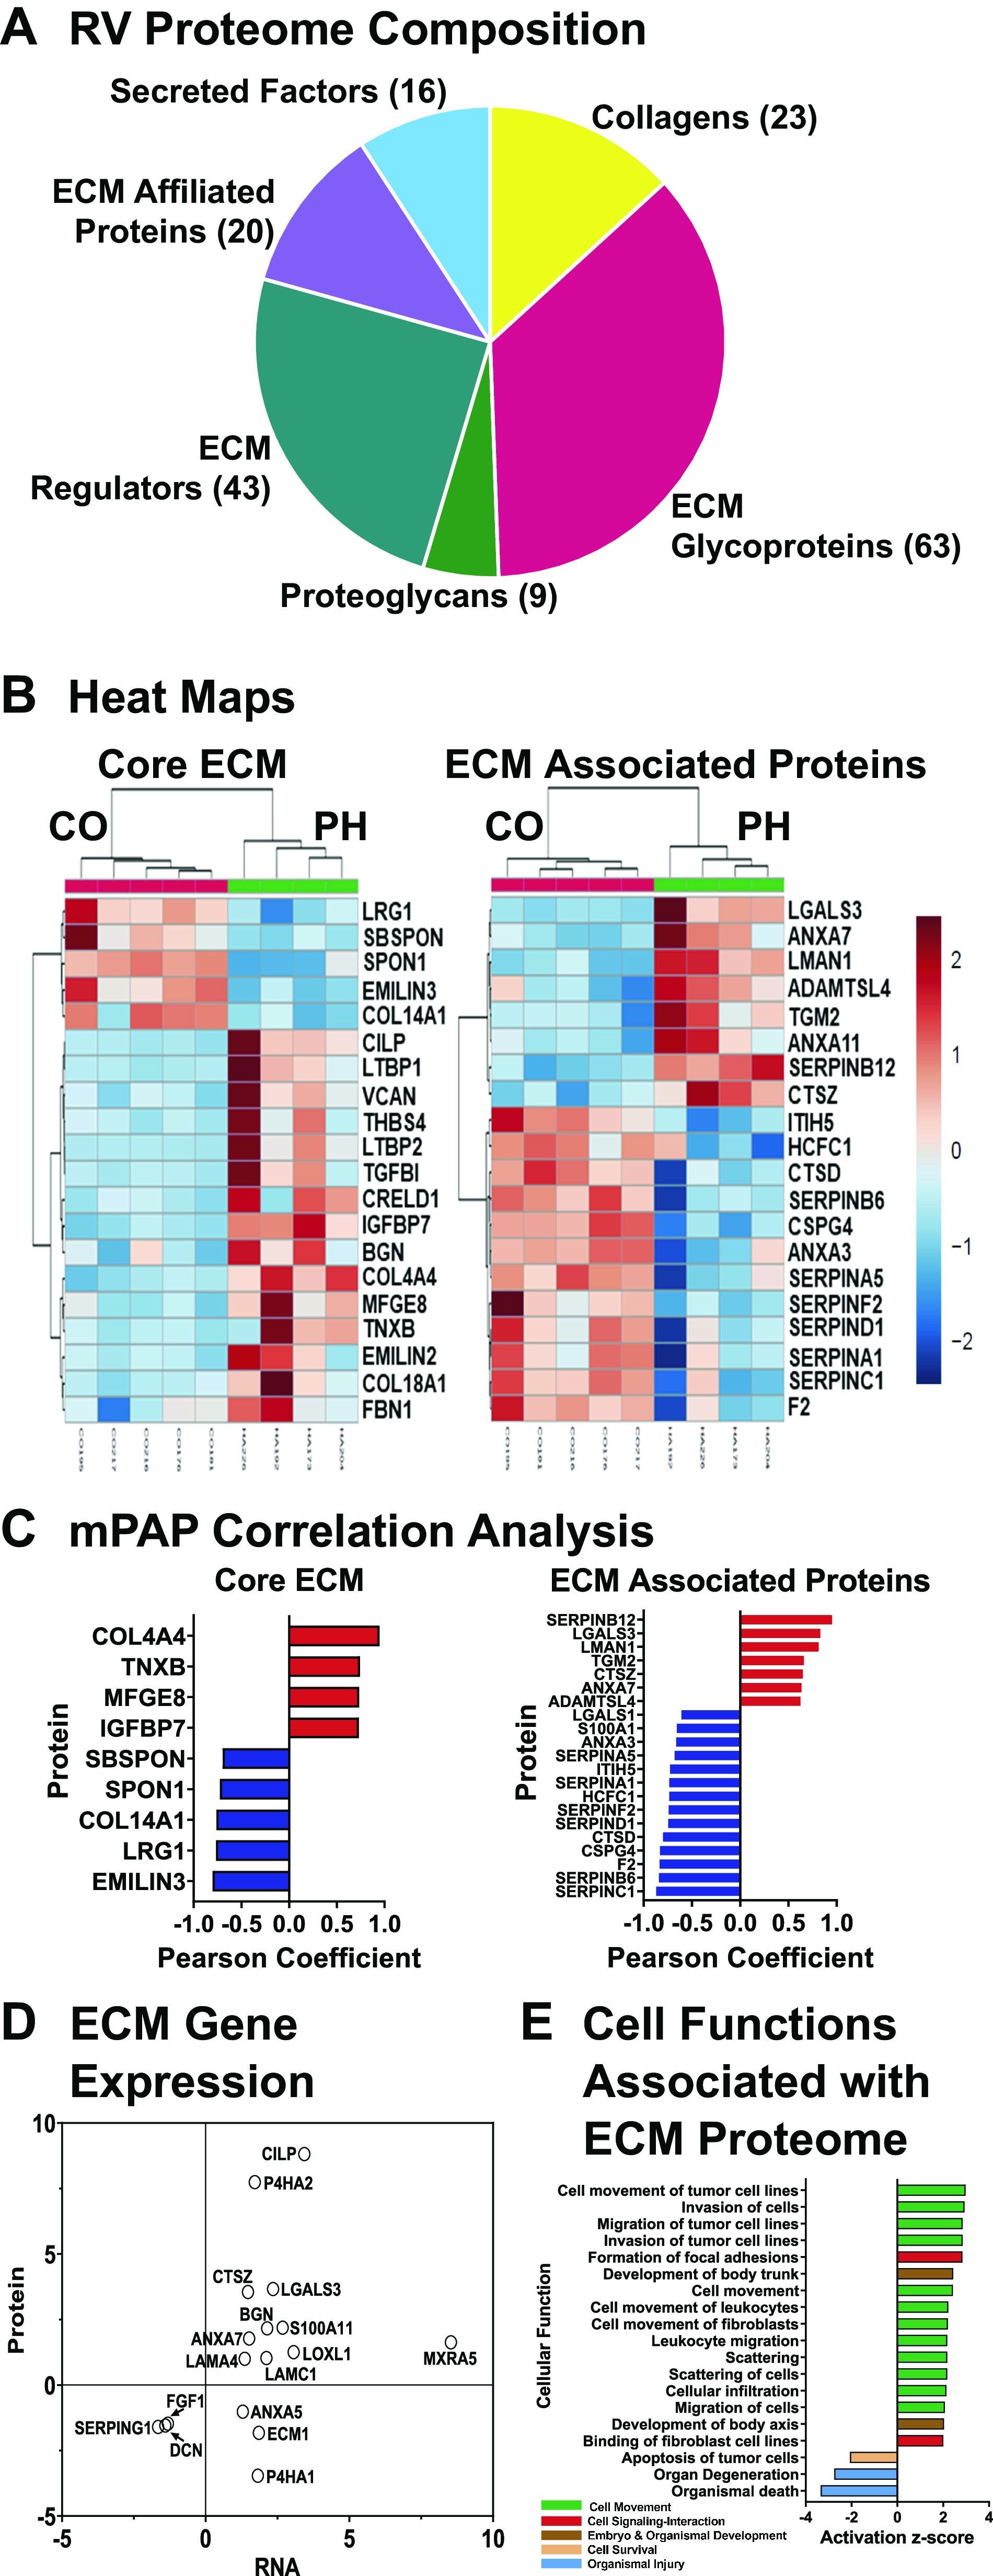
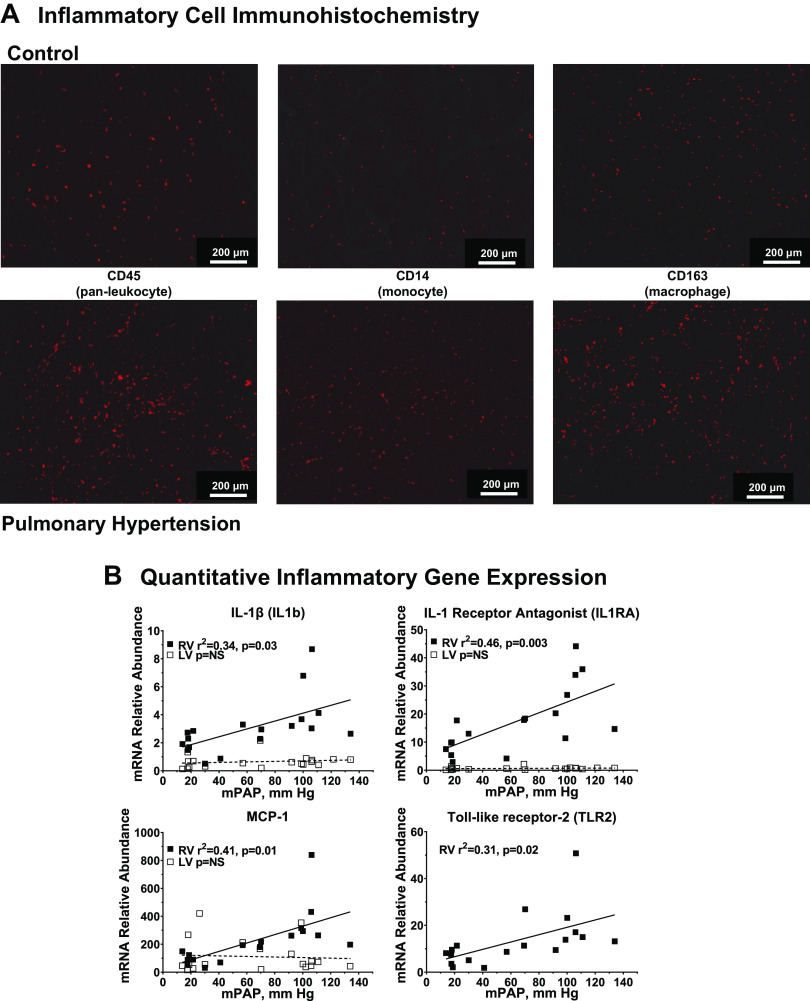
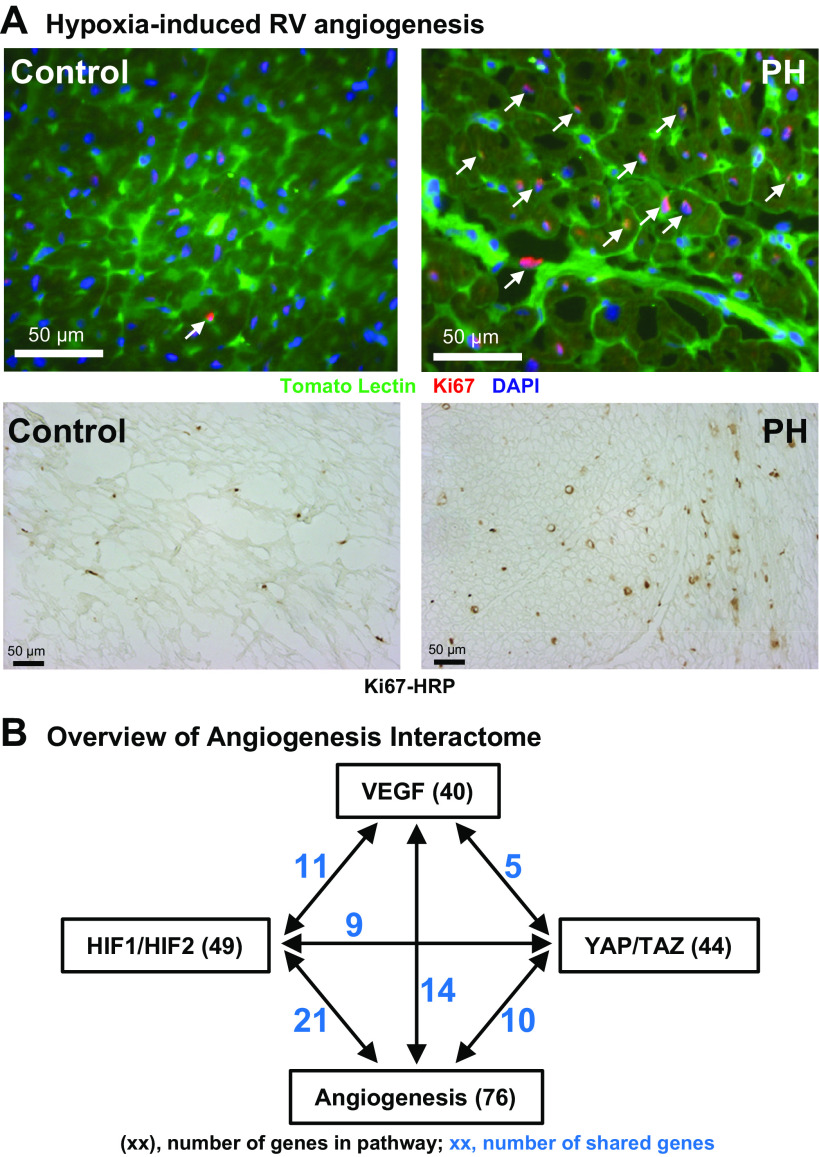
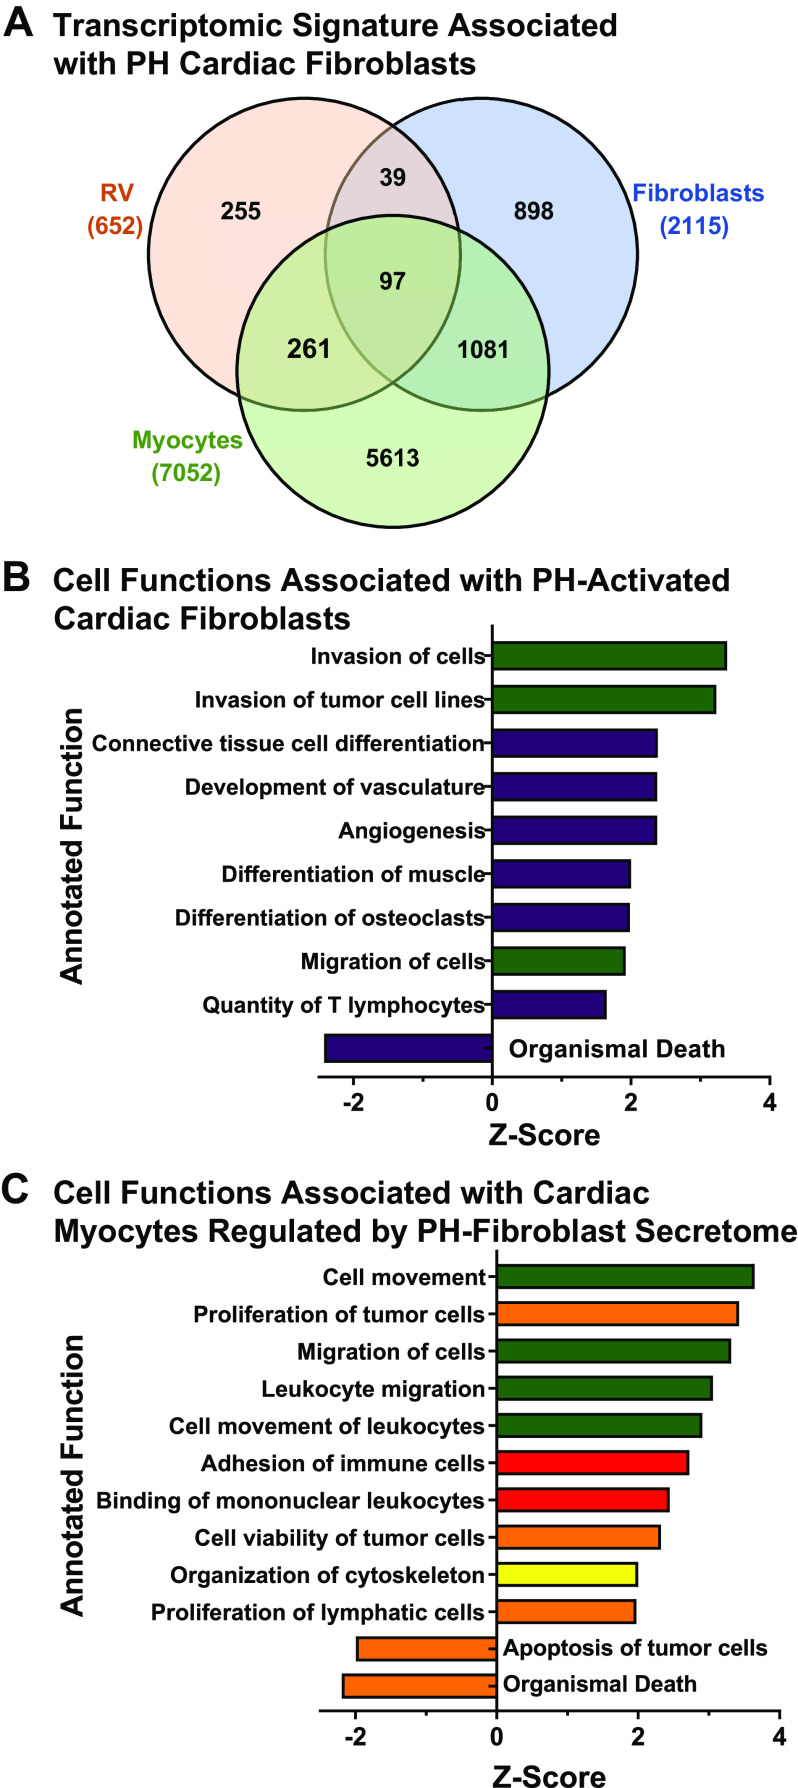
Right ventricular (RV) failure is the major determinant of outcome in pulmonary hypertension (PH). Calves exposed to 2-wk hypoxia develop severe PH and unlike rodents, hypoxia-induced PH in this species can lead to right heart failure. We, therefore, sought to examine the molecular and structural changes in the RV in calves with hypoxia-induced PH, hypothesizing that we could identify mechanisms underlying compensated physiological function in the face of developing severe PH. Calves were exposed to 14 days of environmental hypoxia (equivalent to 4,570 m/15,000 ft elevation, n = 29) or ambient normoxia (1,525 m/5,000 ft, n = 25). Cardiopulmonary function was evaluated by right heart catheterization and pressure volume loops. Molecular and cellular determinants of RV remodeling were analyzed by cDNA microarrays, RealTime PCR, proteomics, and immunochemistry. Hypoxic exposure induced robust PH, with increased RV contractile performance and preserved cardiac output, yet evidence of dysregulated RV-pulmonary artery mechanical coupling as seen in advanced disease. Analysis of gene expression revealed cellular processes associated with structural remodeling, cell signaling, and survival. We further identified specific clusters of gene expression associated with 1) hypertrophic gene expression and prosurvival mechanotransduction through YAP-TAZ signaling, 2) extracellular matrix (ECM) remodeling, 3) inflammatory cell activation, and 4) angiogenesis. A potential transcriptomic signature of cardiac fibroblasts in RV remodeling was detected, enriched in functions related to cell movement, tissue differentiation, and angiogenesis. Proteomic and immunohistochemical analysis confirmed RV myocyte hypertrophy, together with localization of ECM remodeling, inflammatory cell activation, and endothelial cell proliferation within the RV interstitium. In conclusion, hypoxia and hemodynamic load initiate coordinated processes of protective and compensatory RV remodeling to withstand the progression of PH.NEW & NOTEWORTHY Using a large animal model and employing a comprehensive approach integrating hemodynamic, transcriptomic, proteomic, and immunohistochemical analyses, we examined the early (2 wk) effects of severe PH on the RV. We observed that RV remodeling during PH progression represents a continuum of transcriptionally driven processes whereby cardiac myocytes, fibroblasts, endothelial cells, and proremodeling macrophages act to coordinately maintain physiological homeostasis and protect myocyte survival during chronic, severe, and progressive pressure overload.

Keywords: adaptation; pulmonary hypertension; right ventricle.


Conflict of interest statement

G.M.K. is employed by Innotiv/Bolder Biopath, Boulder, CO. M.G.E. is owner of Bioinfo Solutions, LLC, Parker, CO. None of the other authors has any conflicts of interest, financial or otherwise, to disclose.

Figures

None
Graphical abstract
Figure 1.
Figure 1.
Right ventricular (RV) pressure-volume (P-V) analysis. Right heart catheterization and measurement of RV P-V relationships were performed as described in materials and methods. Quantitative values are summarized in Table 1. *P < 0.05 , pulmonary hypertension (PH)-hypoxia vs. control-normoxia. A: representative pressure-volume tracings from a control calf in normoxic conditions (green lines); and from a calf exposed with hypoxia-induced PH, measured in hypoxic conditions (dark blue lines) and following transient return to normoxia (light blue lines). B: RV contractility. C: RV output. bpm, beats/min. D: parameters of RV filling and diastolic function. E: component analysis of RV ventricular-vascular coupling (VVCR). Left: single-beat hemodynamic analysis of ventricular vascular coupling ratio, Ees/Ea. Digital recordings of RV pressures from indicated animals were analyzed to determine Ees/Ea as described in materials and methods. Middle: pulmonary artery (PA) end-arterial elastance. PA end-arterial elastance (Ea) was determined directly from P-V loop relationships. The relationship to mean PA pressure was determined by linear regression. Right: RV end-systolic elastance (Ees) was calculated from animals for which both P-V analysis and determination of ventricular-vascular coupling ratio were performed.
Figure 2.
Figure 2.
cDNA microarray analysis of global gene expression in right ventricle of hypertensive neonatal calves. RNA was isolated from right ventricular tissues of calves with hypoxia-induced pulmonary hypertension (PH) or normoxic controls (n = 5 each) and analyzed by cDNA microarrays as described in materials and methods. A: principal component analysis comparing PH vs. control animals. B: hierarchical cluster map of differentially expressed genes for PH vs. control animals.
Figure 3.
Figure 3.
Transcriptomic landscape of right ventricular (RV) remodeling. Data from cDNA microarrays from pulmonary hypertension (PH) vs. control calves was performed with Ingenuity Pathway Analysis as described in materials and methods. A: gene-ontology (GO) analysis of RV remodeling. Gene networks linked to the indicated cellular functions are shown, filtered for significance by log (enrichment P value) > 1.3 (P < 0.05). B: canonical signaling pathways in RV remodeling. Signaling pathways were filtered by log (enrichment P value > 1.3). Size of the symbol is proportionate to number of genes in the cluster. C: functional categories of gene expression: aggregated analysis. Major gene-ontological categories of gene expression were identified (Supplemental Fig. S3). The average z-scores and P values of all functional gene clusters within the category having enrichment P value < 0.05 are shown. Symbol size is proportionate to the number of functional clusters within each category.
Figure 4.
Figure 4.
Molecular and cellular correlates of right ventricular (RV) hypertrophic remodeling in hypoxia-induced pulmonary hypertension (PH). A: myocyte cross-sectional area determined by quantitative morphometry. Histochemical staining with wheat germ agglutinin and morphometric analysis of myocyte size were performed as described in materials and methods. Right: representative images of RV sections from control (n = 9) and PH (n = 11) calves. Left: relationship between myocyte size and mean pulmonary artery (PA) pressure determined by linear regression. B: quantitative PCR evaluation of hypertrophic gene expression. Abundances of the indicated mRNAs were determined by real-time PCR from RV or left ventricular (LV) tissues of control and PH calves. The relationship of mRNA abundance to mean PA pressure was determined by linear regression. ■, RV; □, LV. C: functional responses mediated by YAP-TAZ signaling. C: predicted functional responses mediated by YAP-TAZ signaling. Differentially expressed genes predicted to interact with YAP-TAZ were identified in the RV microarray dataset (Supplemental Table S2) and gene-ontology analysis of functional responses was performed with Ingenuity Pathway Analysis. The responses shown are filtered at z-score > 2, P < 0.05. Symbols are color coded according to major functional category as indicated (red, cell-cell signaling and interaction; orange, cell proliferation; green, cell movement).
Figure 5.
Figure 5.
Molecular and cellular correlates of right ventricular (RV) extracellular matrix remodeling in hypoxia-induced pulmonary hypertension (PH). A: extracellular matrix (ECM) remodeling in hypertensive calf RV. Cryosections of RV free wall were collected from PH and control calves and stained for extracellular domain-A (ED-A) fibronectin, or tenascin C as described in materials and methods. Representative images from PH and control animals (n = 4 each) are shown with wide field and higher resolution views, scale as indicated. B: quantitative PCR evaluation of ECM gene expression. Abundances of the indicated mRNAs were determined by real-time PCR from RV or left ventricular (LV) tissues of control and PH calves. The relationship of mRNA abundance to mean pulmonary artery pressure was determined by linear regression. Black square, RV; white square, LV. C: functional responses associated with ECM and profibrotic genes. Genes associated with the terms cardiovascular “ECM” or “fibrosis” were identified and their functional associations with gene-ontological categories were determined with Ingenuity Pathway Analysis. Functional subcategories are listed according to –log (enrichment P value), all z-scores > 2.0. Major functional categories are indicated by color: green square, cell movement; red square, cell-cell interaction; blue square, organ injury and abnormality; brown square, embryonic and organismal development; tan square, cell death and survival.
Figure 6.
Figure 6.
Proteomic analysis of the right ventricular (RV) extracellular matrix (ECM) matrisome. Proteomic analysis was performed as described in materials and methods. A: matrisome composition (174 proteins). B: differentially expressed proteins (P < 0.1) in core ECM (n = 20) and ECM-associated matrisomal protein (n = 34) compartments from pulmonary hypertension (PH) Calf RV. Top 20 proteins are shown. C: Pearson correlation analysis of mean PA pressure (mPAP) dependence of differentially expressed proteins. D: correlations between transcriptomic and proteomic determinations in PH RV. E: integrated transcriptomic-proteomic gene ontological analysis of differentially expressed ECM genes.
Figure 7.
Figure 7.
Molecular and cellular correlates of right ventricular (RV) inflammation in hypoxia-induced PH. A: inflammatory cell activation in hypertensive calf RV. Cryosections of RV free wall were collected from pulmonary hypertension (PH) (n = 8) and control (n = 4) calves and stained for the indicated immune-inflammatory cell markers as described in materials and methods. Data show representative images. B: quantitative PCR evaluation of inflammatory gene expression. Abundances of the indicated mRNAs were determined by real-time PCR from RV or left ventricular (LV) tissues of control and PH calves. The relationship of mRNA abundance to mean pulmonary artery pressure was determined by linear regression. Black square, RV; white square, LV.
Figure 8.
Figure 8.
Molecular and cellular correlates of right ventricular (RV) angiogenesis in hypoxia-induced pulmonary hypertension (PH). A: vascular endothelial cell proliferation in hypertensive RV. Top: cryosections of RV free wall were collected from PH (n = 5) and control (n = 4) calves and costained with the cell proliferation marker Ki67, and with fluorescent tomato lectin to visualize the vascular endothelium, as described in materials and methods. Representative images are shown. Arrows indicate colocalization of cell proliferation with RV vasculature. Bottom: formalin-fixed sections were stained with Ki67 antibody and visualized with HRP-DAB histochemistry. B: angiogenesis regulatory gene networks in hypertensive RV. The networks of differentially expressed genes connected with the gene-ontology category, “angiogenesis,” and shared genes with the regulatory gene networks for VEGF, HIF1-HIF2, and TAP-TAZ signaling were identified with Ingenuity Pathway Analysis. Interactions and shared genes among all these networks are indicated, where black text shows the total number of genes in the regulatory network and blue text shows the number of genes shared with the angiogenesis signaling network.
Figure 9.
Figure 9.
Transcriptomic signatures associated with pulmonary hypertension (PH)-activated right ventricular (RV) fibroblasts. A: Venn analysis of shared genes differentially expressed in PH neonatal calf RV, in vitro cultured PH neonatal calf RV fibroblasts, and in vitro cultured rat ventricular myocytes treated with conditioned medium from PH neonatal calf RV fibroblasts (myocytes). RV data from this study; in vitro cell culture data from Bruns et al. (33). B: gene-ontological analysis of concordantly expressed genes in RV and in cultured PH neonatal calf RV fibroblasts. C: gene-ontological analysis of concordantly expressed genes in RV and in cultured rat ventricular myocytes treated with conditioned medium from PH neonatal calf RV fibroblasts. Major functional categories of annotated gene functions are indicated by color: green square, cell movement; yellow square, cell structure, function, development; purple square, cardiovascular system development, function; tan square, cell survival and proliferation; red square, cell signaling and interaction.

Similar articles

Cited by

References

    1. McLaughlin VV, Archer SL, Badesch DB, Barst RJ, Farber HW, Lindner JR, , et al. . ACCF/AHA 2009 expert consensus document on pulmonary hypertension: a report of the American College of Cardiology Foundation Task Force on Expert Consensus Documents and the American Heart Association: developed in collaboration with the American College of Chest Physicians, American Thoracic Society, Inc., and the Pulmonary Hypertension Association. Circulation 119: 2250–2294, 2009. doi:10.1161/CIRCULATIONAHA.109.192230. - DOI - PubMed
    1. Vonk Noordegraaf A, Chin KM, Haddad F, Hassoun PM, Hemnes AR, Hopkins SR, Kawut SM, Langleben D, Lumens J, Naeije R. Pathophysiology of the right ventricle and of the pulmonary circulation in pulmonary hypertension: an update. Eur Respir J 53: 1801900, 2019. doi:10.1183/13993003.01900-2018. - DOI - PMC - PubMed
    1. Vonk-Noordegraaf A, Haddad F, Chin KM, Forfia PR, Kawut SM, Lumens J, Naeije R, Newman J, Oudiz RJ, Provencher S, Torbicki A, Voelkel NF, Hassoun PM. Right heart adaptation to pulmonary arterial hypertension: physiology and pathobiology. J Am Coll Cardiol 62: D22–D33, 2013. doi:10.1016/j.jacc.2013.10.027. - DOI - PubMed
    1. Voelkel NF, Quaife RA, Leinwand LA, Barst RJ, McGoon MD, Meldrum DR, Dupuis J, Long CS, Rubin LJ, Smart FW, Suzuki YJ, Gladwin M, Denholm EM, Gail DB; National Heart L, Blood Institute Working Group on Cellular and Molecular Mechanisms of Right Heart Failure. Right ventricular function and failure: report of a National Heart, Lung, and Blood Institute working group on cellular and molecular mechanisms of right heart failure. Circulation 114: 1883–1891, 2006. doi:10.1161/CIRCULATIONAHA.106.632208. - DOI - PubMed
    1. Cornwell WK, Tran T, Cerbin L, Coe G, Muralidhar A, Hunter K, Altman N, Ambardekar AV, Tompkins C, Zipse M, Schulte M, O'Gean K, Ostertag M, Hoffman J, Pal JD, Lawley JS, Levine BD, Wolfel E, Kohrt WM, Buttrick P. New insights into resting and exertional right ventricular performance in the healthy heart through real-time pressure-volume analysis. J Physiol 598: 2575–2587, 2020. doi:10.1113/JP279759. - DOI - PubMed

Publication types