. 2023 Mar 24:12:e85302.
doi: 10.7554/eLife.85302.

Enterobacterales plasmid sharing amongst human bloodstream infections, livestock, wastewater, and waterway niches in Oxfordshire, UK

Collaborators, Affiliations

Enterobacterales plasmid sharing amongst human bloodstream infections, livestock, wastewater, and waterway niches in Oxfordshire, UK

William Matlock et al. Elife. .

Abstract

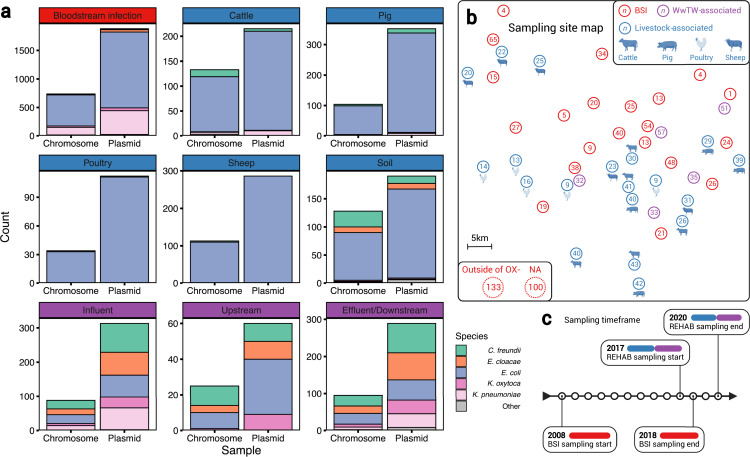
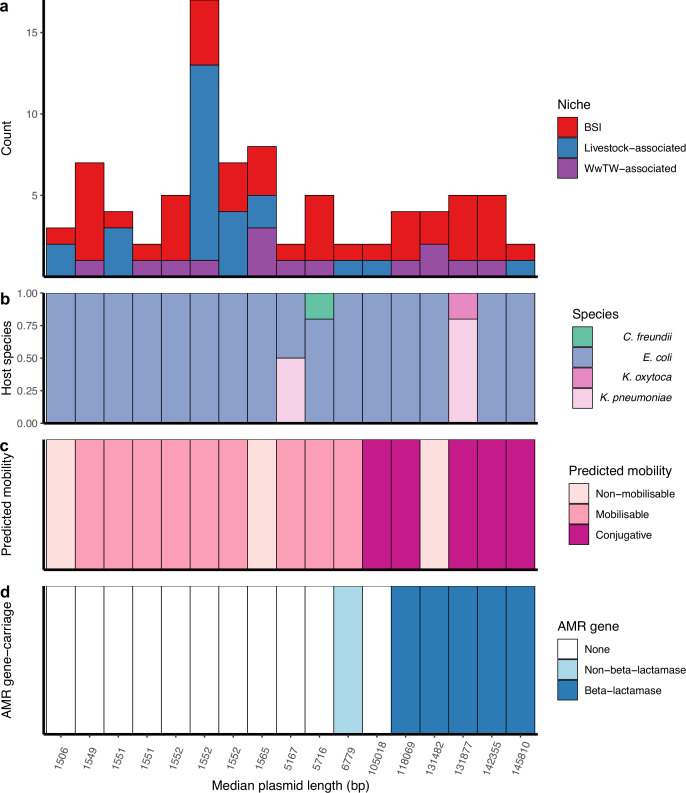
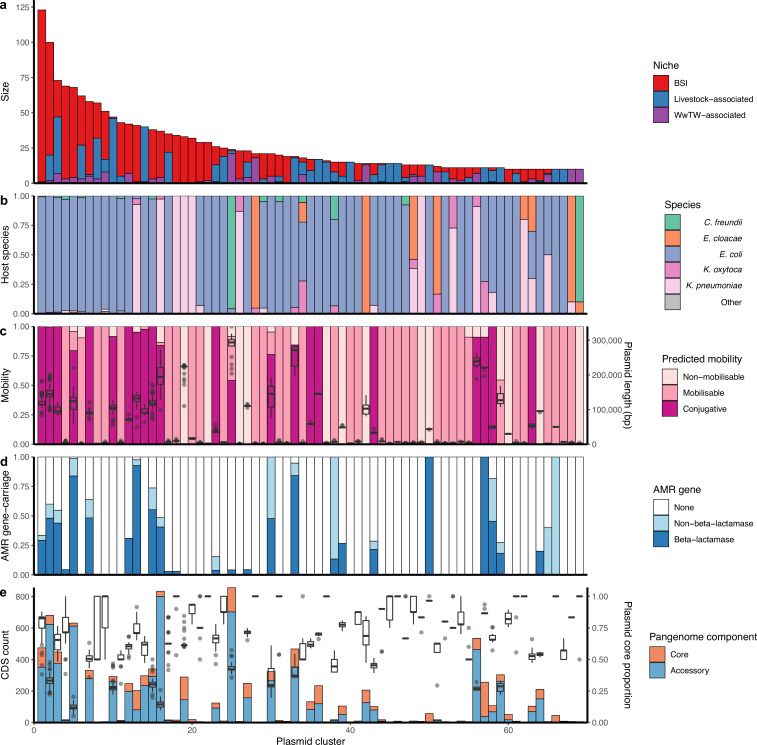
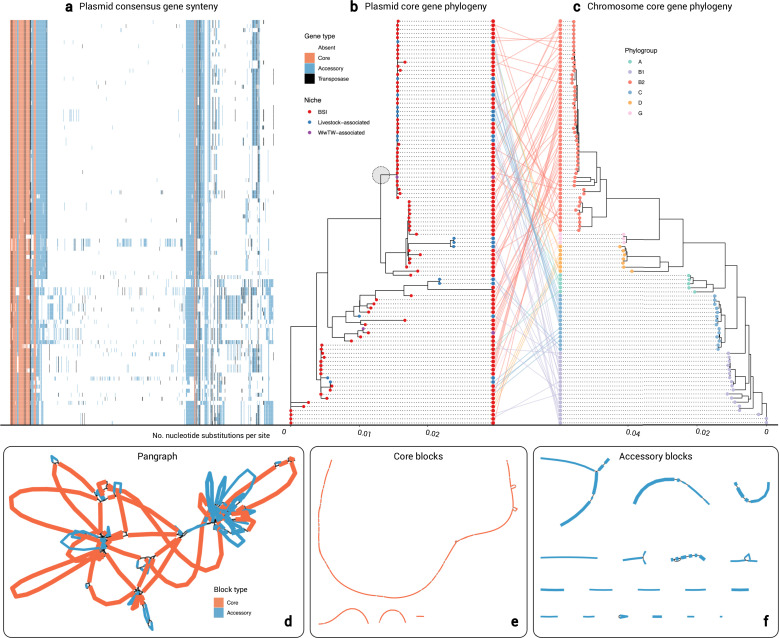
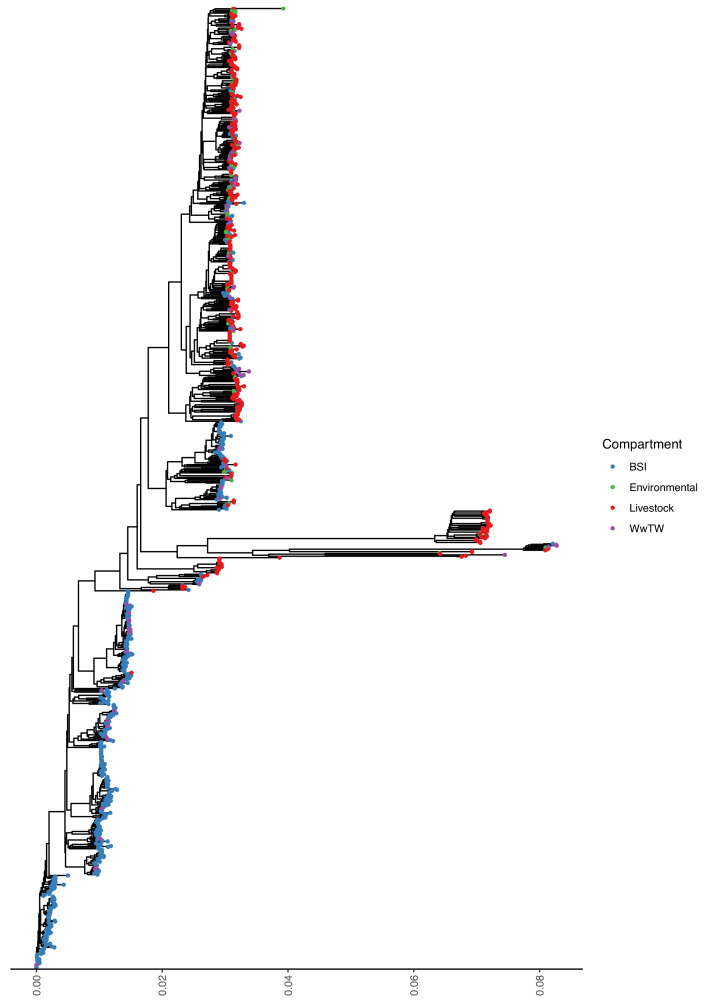
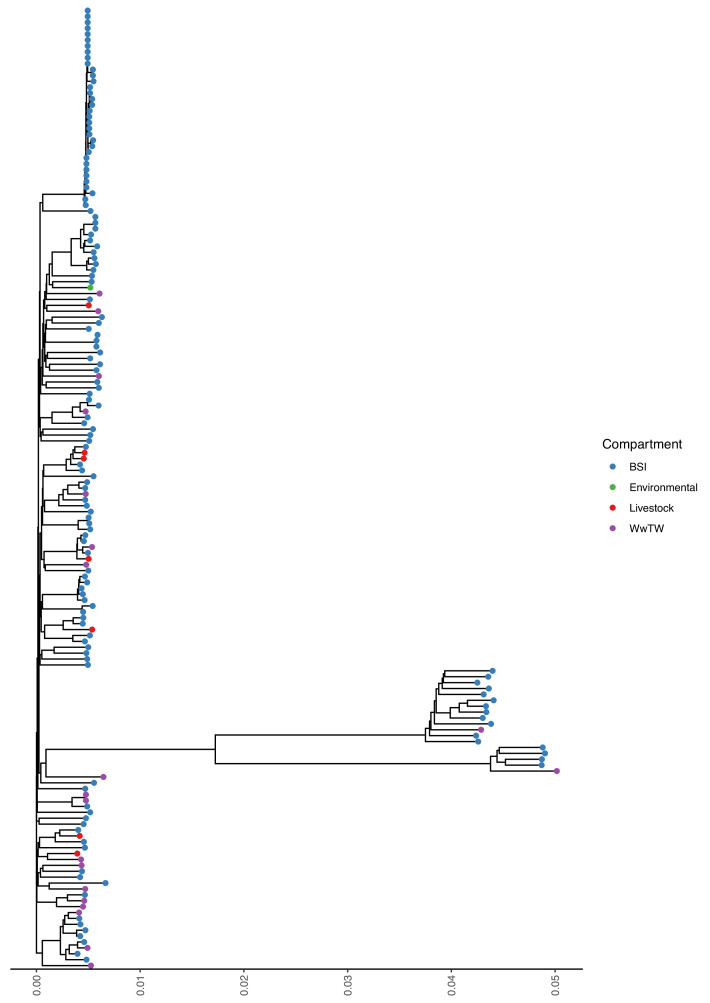
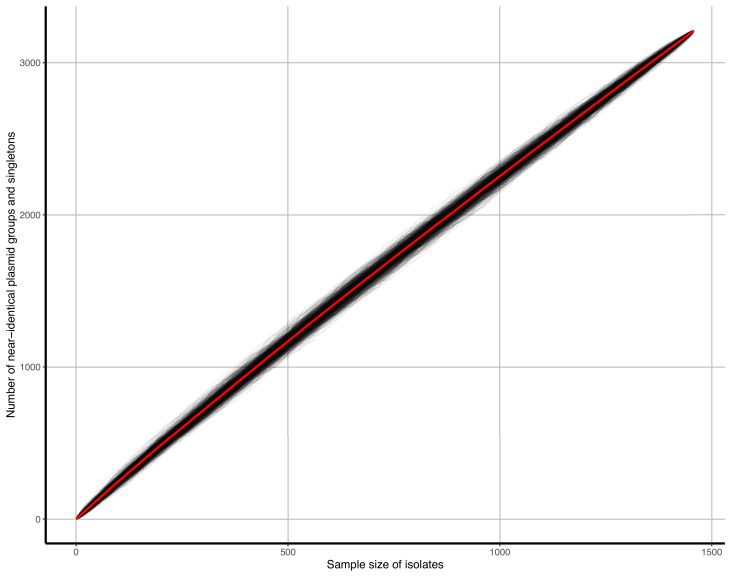
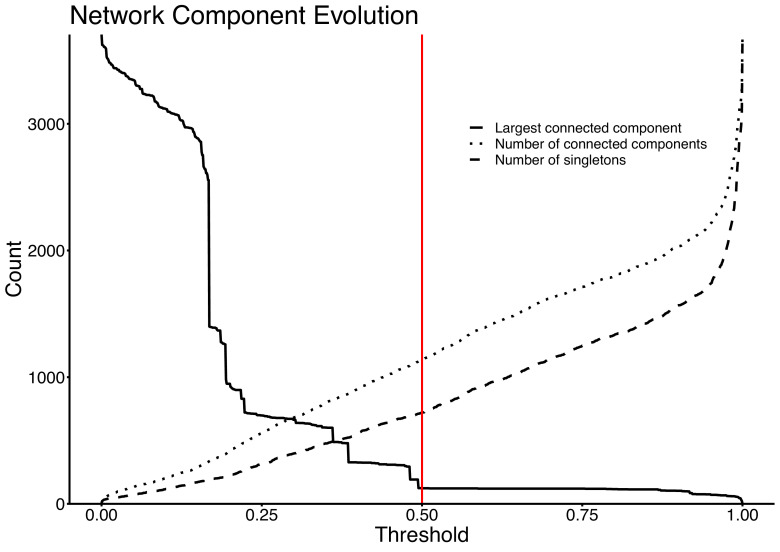
Plasmids enable the dissemination of antimicrobial resistance (AMR) in common Enterobacterales pathogens, representing a major public health challenge. However, the extent of plasmid sharing and evolution between Enterobacterales causing human infections and other niches remains unclear, including the emergence of resistance plasmids. Dense, unselected sampling is essential to developing our understanding of plasmid epidemiology and designing appropriate interventions to limit the emergence and dissemination of plasmid-associated AMR. We established a geographically and temporally restricted collection of human bloodstream infection (BSI)-associated, livestock-associated (cattle, pig, poultry, and sheep faeces, farm soils) and wastewater treatment work (WwTW)-associated (influent, effluent, waterways upstream/downstream of effluent outlets) Enterobacterales. Isolates were collected between 2008 and 2020 from sites <60 km apart in Oxfordshire, UK. Pangenome analysis of plasmid clusters revealed shared 'backbones', with phylogenies suggesting an intertwined ecology where well-conserved plasmid backbones carry diverse accessory functions, including AMR genes. Many plasmid 'backbones' were seen across species and niches, raising the possibility that plasmid movement between these followed by rapid accessory gene change could be relatively common. Overall, the signature of identical plasmid sharing is likely to be a highly transient one, implying that plasmid movement might be occurring at greater rates than previously estimated, raising a challenge for future genomic One Health studies.

Keywords: E. coli; Enterobacterales; K. pneumoniae; One Health; antimicrobial resistance; bloodstream infections; genetics; genomic epidemiology; genomics; infectious disease; microbiology; plasmid.


Conflict of interest statement

WM, SL, KC, MA, LB, JK, MA, SO, MM, DC, DR, MA, LS, NS No competing interests declared

Figures

Figure 1.
Figure 1.. A diverse sample of geographically and temporally restricted Enterobacterales.
(a) Number of chromosomes and plasmids by niche, stratified by isolate genus. (b) Map of approximate, relative distances between sampling sites, coloured by niche (human bloodstream infection [BSI], livestock-associated [cattle, pig, poultry, and sheep faeces, soils nearby livestock sites], and wastewater treatment work [WwTW]-associated sources [influent, effluent, waterways upstream/downstream of effluent outlets]). Number in circles indicates how many of the n=1458 isolates are from that location. (c) Sampling timeframe for BSI and REHAB (non-BSI) isolates.
Figure 2.
Figure 2.. Cross-niche, near-identical plasmids.
(a) Size of cross-niche, near-identical plasmid groups, coloured by niche (total n=84 plasmids). Median length (bp) of plasmids within groups increases from left to right. (b) Proportion of plasmid host species by group. (c) Predicted mobility of plasmid. (d) Antimicrobial resistance (AMR) gene carriage in plasmid. For small plasmids, the stringent distance threshold (d<0.0001) becomes an identical threshold, meaning that plasmids of the same length with a single SNP between them are grouped into different groups (e.g. the three groups with length = 1552 bp; see Materials and methods). From left to right, the near-identical groups are named in Supplementary file 3 as 156, 18, 117, 210, 22, 29, 44, 19, 184, 6, 208, 139, 32, 26, 10, 192, 217.
Figure 3.
Figure 3.. Genetically similar plasmids shared between niches.
(a) Size of plasmid clusters with at least 10 members, coloured by niche. Size of clusters decreases from left to right. (b) Proportion of plasmid host species by cluster. (c) Plasmid mobility class and size: Left-hand axis shows proportion of plasmids with a predicted mobility class by cluster. Right-hand axis shows plasmid length boxplots by cluster. (d) Proportions of antimicrobial resistance (AMR) gene carriage by cluster. (e) Plasmid core and accessory genomes: Left-hand axis shows the count of core and accessory coding sequences (CDS) for the entire cluster as a bar chart. Right-hand axis shows plasmid core-gene proportions (i.e. core CDS/total CDS for each plasmid) as a boxplot.
Figure 4.
Figure 4.. Cluster 2 plasmid and host evolution.
(a) Consensus gene ordering for plasmid cluster 2, coloured by gene type (total n=99 plasmids; n=1 Salmonella enterica isolate omitted). Genes are coloured by core, accessory, or transposase. (b) Plasmid core-gene phylogeny with tips coloured by sampling niche. The grey circle highlights the clade of n=44 plasmids which were further analysed. (c) Plasmid host chromosome core-gene phylogeny with tips coloured by sampling niche. Plasmid and host phylogeny tips are connected in a ‘tanglegram’ which connects pairs of plasmids and chromosomes from the same isolate. (d) Visualisation of the pangraph for n=44 plasmids in the grey-circled clade in (b). Blocks are coloured by presence in plasmids. (e) Core blocks (found in at least 95% of the n=44 plasmids). (f) Accessory blocks (found in less than 95% of the n=44 plasmids).
Appendix 1—figure 1.
Appendix 1—figure 1.. Mash tree for n=1044 E. coli chromosomes.
Tree tips are coloured by sampling compartment, scale is Mash distance.
Appendix 1—figure 2.
Appendix 1—figure 2.. Mash tree for n=163 K. pneumoniae chromosomes.
Tree tips are coloured by sampling compartment, scale is Mash distance.
Appendix 1—figure 3.
Appendix 1—figure 3.. Accumulation curves of near-identical plasmid groups and singletons against isolate sample size.
Black lines represent b=1000 bootstrap simulations, the red line represents their average.
Appendix 1—figure 4.
Appendix 1—figure 4.. Network evolution of largest connected component, number of connected components, and number of singletons, as edges are removed at increasing JI thresholds.
The vertical red line represents the chosen threshold of JI=0.5.
Appendix 1—figure 5.
Appendix 1—figure 5.. Number of clusters detected within the plasmid network at increasing JI thresholds.
Interval bars represent the IQR in cluster number at a given threshold over 50 runs of the Louvain algorithm.
Appendix 1—figure 6.
Appendix 1—figure 6.. Accumulation curves of plasmid clusters, doubletons, and singletons against isolate sample size.
Black lines represent b=1000 bootstrap simulations, red line represents their average.
Appendix 1—figure 7.
Appendix 1—figure 7.. Plasmid clusters containing blaTEM-1 carry more AMR genes.
Each point is one plasmid cluster. n=247 clusters are shown, with panels facetted by the number of niches the plasmid cluster represented. p-values are from the Wilcoxon test.
Appendix 1—figure 8.
Appendix 1—figure 8.. Plasmid accessory gene presence/absence Jaccard distance against core-gene cophenetic distance.
Presented are data points from 27/247 clusters for which (i) all plasmids had at least 1 core gene, and (ii) the cluster contained at least 50 accessory genes. The red line is a statistically significant (p-value <2.2e-16) log-transformed linear regression.
Appendix 1—figure 9.
Appendix 1—figure 9.. Accumulation curves of near-identical plasmid matches with bloodstream infection (BSI) plasmids and singletons against livestock-associated (environmental soils/livestock) isolate sample size.
Black lines represent b=1000 bootstrap simulations, red line represents their average.

Update of

References

    1. AbuOun M, Jones H, Stubberfield E, Gilson D, Shaw LP, Hubbard ATM, Chau KK, Sebra R, Peto TEA, Crook DW, Read DS, Gweon HS, Walker AS, Stoesser N, Smith RP, Anjum MF, On Behalf Of The Rehab Consortium A genomic epidemiological study shows that prevalence of antimicrobial resistance in enterobacterales is associated with the livestock host, as well as antimicrobial usage. Microbial Genomics. 2021;7:000630. doi: 10.1099/mgen.0.000630. - DOI - PMC - PubMed
    1. Acman M, van Dorp L, Santini JM, Balloux F. Large-Scale network analysis captures biological features of bacterial plasmids. Nature Communications. 2020;11:2452. doi: 10.1038/s41467-020-16282-w. - DOI - PMC - PubMed
    1. Arcilla MS, van Hattem JM, Matamoros S, Melles DC, Penders J, de Jong MD, Schultsz C, COMBAT consortium Dissemination of the mcr-1 colistin resistance gene. The Lancet. Infectious Diseases. 2016;16:147–149. doi: 10.1016/S1473-3099(15)00541-1. - DOI - PubMed
    1. Bastidas-Caldes C, de Waard JH, Salgado MS, Villacís MJ, Coral-Almeida M, Yamamoto Y, Calvopiña M. Worldwide prevalence of mcr-mediated colistin-resistance Escherichia coli in isolates of clinical samples, healthy humans, and livestock-A systematic review and meta-analysis. Pathogens. 2022;11:659. doi: 10.3390/pathogens11060659. - DOI - PMC - PubMed
    1. Blondel VD, Guillaume JL, Lambiotte R, Lefebvre E. Fast unfolding of communities in large networks. Journal of Statistical Mechanics. 2008;2008:10008. doi: 10.1088/1742-5468/2008/10/P10008. - DOI

Publication types