. 2023 Mar 24;9(12):eadf7175.
doi: 10.1126/sciadv.adf7175. Epub 2023 Mar 24.

Clinical PARP inhibitors allosterically induce PARP2 retention on DNA

Affiliations

Clinical PARP inhibitors allosterically induce PARP2 retention on DNA

Marie-France Langelier et al. Sci Adv. .

Abstract

PARP1 and PARP2 detect DNA breaks, which activates their catalytic production of poly(ADP-ribose) that recruits repair factors and contributes to PARP1/2 release from DNA. PARP inhibitors (PARPi) are used in cancer treatment and target PARP1/2 catalytic activity, interfering with repair and increasing PARP1/2 persistence on DNA damage. In addition, certain PARPi exert allosteric effects that increase PARP1 retention on DNA. However, no clinical PARPi exhibit this allosteric behavior toward PARP1. In contrast, we show that certain clinical PARPi exhibit an allosteric effect that retains PARP2 on DNA breaks in a manner that depends on communication between the catalytic and DNA binding regions. Using a PARP2 mutant that mimics an allosteric inhibitor effect, we observed increased PARP2 retention at cellular damage sites. The PARPi AZD5305 also exhibited a clear reverse allosteric effect on PARP2. Our results can help explain the toxicity of clinical PARPi and suggest ways to improve PARPi moving forward.


Figures

Fig. 1.
Fig. 1.. PARPi classification based on reverse allostery in PARP1.
PARPi classify in three different types based on their ability to modulate PARP1 retention on DNA through allosteric effects. Type I inhibitors have a proretentioneffect, type II have no effect or mild proretention effect, and type III have a prorelease effect (35). The length of the arrows indicate the distribution toward DNA retained PARP1 on the left and released PARP1 on the right.
Fig. 2.
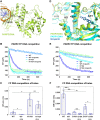
Fig. 2.. FP DNA competition experiments comparing the effect of PARPi on reverse allostery in PARP2 and PARP1.
(A) PARP2 (40 nM) was incubated with a dumbbell DNA probe containing a central 5′P nick (5 nM) for 30 min at room temperature in the presence of DMSO or inhibitors (100 μM). A competitor unlabeled DNA (2 μM) was added, and FP was measured over time. A single exponential was fit to the data in MATLAB to obtain an off-rate. (B) Same analysis as in (A) but using PARP1. (C) Off-rates shown for PARP2 are an average of three to six independent experiments performed as in (A). Each bar represents the mean value, and the error bar corresponds to the SD. The points represent the off-rate value for each individual experiment. (D) Same analysis as in (C) but using PARP1. Two-sample two-sided t tests were used to compare the off-rate values between PARPi treatments and control samples with DMSO (none). *P < 0.05 and ***P < 0.0005; ns, not significant.
Fig. 3.
Fig. 3.. SPR experiments showing the effect of PARPi on reverse allostery in PARP2.
(A to C) A streptavidin-coated chip was used to capture a biotinylated dumbbell DNA containing a central 5′P nick (20 to 40 nM). PARP2 was flowed on the chip at various concentrations in the presence of DMSO or PARPi (5 μM). A 1:1 binding model was fit to the data in TraceDrawer (Reichert) to yield an association constant (kon) (A), a dissociation constant (koff) (B), and an equilibrium dissociation constant (KD: koff/kon) (C). The bars represent an average of three independent experiments, and the error bars represent the associated SDs. The points represent the value obtained for each individual experiment. (D) PARP2 was flowed at 60 nM on a streptavidin-coated chip coupled to biotinylated DNA in the presence of DMSO or PARPi (5 μM). At the time of dissociation, an external valve was used to inject nonbiotinylated competitor DNA with DMSO or PARPi (5 μM). Off-rates were calculated in MATLAB using a single exponential. The bars represent the average of three independent experiments, and the error bars represent the associated SDs. The points represent the values obtained for each individual experiment. Two-sample two-sided t tests were used to compare the ka, kd, and KD values between samples with PARPi and samples with DMSO. *P < 0.05, **P < 0.005, and ***P < 0.0005; ns, not significant.
Fig. 4.
Fig. 4.. PARP2 mutants alter PARPi reverse allosteric effect.
(A) The cryo-EM structure of PARP2/HPF1/DNA complex (6X0L) is shown. HPF1 has been omitted for clarity. The location of WGR residue N116 is indicated. (B) FP DNA competition experiment with PARP2 WT and mutant N116A with or without niraparib (100 μM). (C) Off-rates were determined by fitting a single exponential to the data in (B). Averages of three independent experiments are shown, and the error bars represent the associated SDs. The points represent the value obtained for each individual experiment. (D) The crystal structure of PARP1/DNA complex (4DQY) and the crystal structure of PARP1 CAT bound to niraparib (4R6E, only niraparib shown) were aligned to the cryo-EM structure of PARP2/HPF1/DNA complex (6X0L, HPF1 was omitted for clarity). The positions of I318 in PARP2 and A/V762 in PARP1 are shown. (E and F) Same as in (C) and (D) for I318A and I318V mutants. Two-sample two-sided t tests were used to compare the off-rates between samples as indicated. *P < 0.05, **P < 0.005, and ***P < 0.0005; ns, not significant.
Fig. 5.
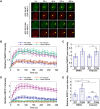
Fig. 5.. PARP2 I318A accumulates more efficiently than PARP2 WT at DNA damage sites in cells.
(A) Representative images of laser-induced GFP-PARP2 WT or I318A mutant foci and RFP-XRCC1 foci in PARP1/2 knockout RPE-1 cells. The arrowheads point to the site of micro-irradiation. (B) The relative intensity of PARP2 at DNA damage sites (normalized to the intensity before irradiation) in the presence of DMSO or veliparib. The points and error bars represent the averages and SEs, respectively. (C) The maximum relative intensity of GFP-PARP2 from (B). The bars represent the average of the maximum relative intensity obtained for the cells in one representative experiment of three consistent biological repeats. Each point shown represents the maximum relative intensity obtained for one of seven to eight cells. The error bars correspond to the SDs. Two-sample two-sided t tests were used to compare the relative PARP2 foci intensity between samples as indicated. *P < 0.05, **P < 0.005, and ***P < 0.0005; ns, not significant. (D and E) are the same analysis as in (B) and (C) but using XRCC1.
Fig. 6.
Fig. 6.. Effect of AZD5305 on PARP2 retention on DNA.
(A) The crystal structure of PARP1 CAT bound to niraparib (4R6E) was aligned to the crystal structure of PARP2 CAT bound to olaparib (4TVJ) and the crystal structure of PARP1 CAT bound to an analog of AZD5305 (7ONT). (B) FP DNA competition experiment with PARP2 WT in the presence of niraparib, olaparib, or AZD5305 (100 μM). (C and D) Off-rates were determined by fitting a single exponential to the FP DNA competition data at various concentrations of AZD5305 (C) or olaparib (D). The bars represent averages of three independent experiments, and the error bars represent the associated SDs. The points represent the value obtained for each individual experiment. Two-sample two-sided t tests were used to compare the relative off-rates between samples with PARPi and samples with DMSO. *P < 0.05, **P < 0.005, and ***P < 0.0005.
Fig. 7.
Fig. 7.. AZD5305 reduces PARP2 mobility at cellular sites of DNA damage.
(A) Representative images of laser-induced GFP-PARP2 and RFP-XRCC1 foci in PARP1/2 KO RPE-1 cells at the indicated time points and inhibitor concentrations. Yellow arrowheads point to the site of micro-irradiation. (B) The relative intensity of PARP2 at DNA damage sites normalized to the intensity before irradiation and quantified in the presence of DMSO or AZD5305 at 1, 10, and 100 μM. The points and error bars represent the averages and SEs, respectively. (C) The maximum relative intensity of GFP-PARP2 from (B). The bars represent the average of the maximum relative intensity obtained for the cells in one representative experiment of three consistent biological repeats. Each point shown represents the maximum relative intensity obtained for one of eight to nine cells. The error bars correspond to the SDs. Two-sample two-sided t tests were used to compare the relative PARP2 foci intensity between samples as indicated. *P < 0.05 and ***P < 0.0005.
Description

References

    1. B. Lüscher, I. Ahel, M. Altmeyer, A. Ashworth, P. Bai, P. Chang, M. Cohen, D. Corda, F. Dantzer, M. D. Daugherty, T. M. Dawson, V. L. Dawson, S. Deindl, A. R. Fehr, K. L. H. Feijs, D. V. Filippov, J. P. Gagné, G. Grimaldi, S. Guettler, N. C. Hoch, M. O. Hottiger, P. Korn, W. L. Kraus, A. Ladurner, L. Lehtiö, A. K. L. Leung, C. J. Lord, A. Mangerich, I. Matic, J. Matthews, G. L. Moldovan, J. Moss, G. Natoli, M. L. Nielsen, M. Niepel, F. Nolte, J. Pascal, B. M. Paschal, K. Pawłowski, G. G. Poirier, S. Smith, G. Timinszky, Z. Q. Wang, J. Yélamos, X. Yu, R. Zaja, M. Ziegler, ADP-ribosyltransferases, an update on function and nomenclature. FEBS J. 289, 7399–7410 (2022). - PMC - PubMed
    1. N. Pandey, B. E. Black, Rapid Detection and Signaling of DNA Damage by PARP-1. Trends Biochem. Sci. 46, 744–757 (2021). - PMC - PubMed
    1. I. Gibbs-Seymour, P. Fontana, J. G. M. Rack, I. Ahel, HPF1/C4orf27 Is a PARP-1-Interacting Protein that Regulates PARP-1 ADP-Ribosylation Activity. Mol. Cell 62, 432–442 (2016). - PMC - PubMed
    1. J. J. Bonfiglio, P. Fontana, Q. Zhang, T. Colby, I. Gibbs-Seymour, I. Atanassov, E. Bartlett, R. Zaja, I. Ahel, I. Matic, Serine ADP-Ribosylation Depends on HPF1. Mol. Cell. 65, 932–940.e6 (2017). - PMC - PubMed
    1. L. Palazzo, A. Mikoč, I. Ahel, ADP-ribosylation: New facets of an ancient modification. FEBS J. 284, 2932–2946 (2017). - PMC - PubMed