. 2023 Mar 31;8(81):eadf2248.
doi: 10.1126/sciimmunol.adf2248. Epub 2023 Mar 24.

The transcription factor Mef2d regulates B:T synapse-dependent GC-TFH differentiation and IL-21-mediated humoral immunity

Affiliations

The transcription factor Mef2d regulates B:T synapse-dependent GC-TFH differentiation and IL-21-mediated humoral immunity

Ye-Ji Kim et al. Sci Immunol. .

Abstract

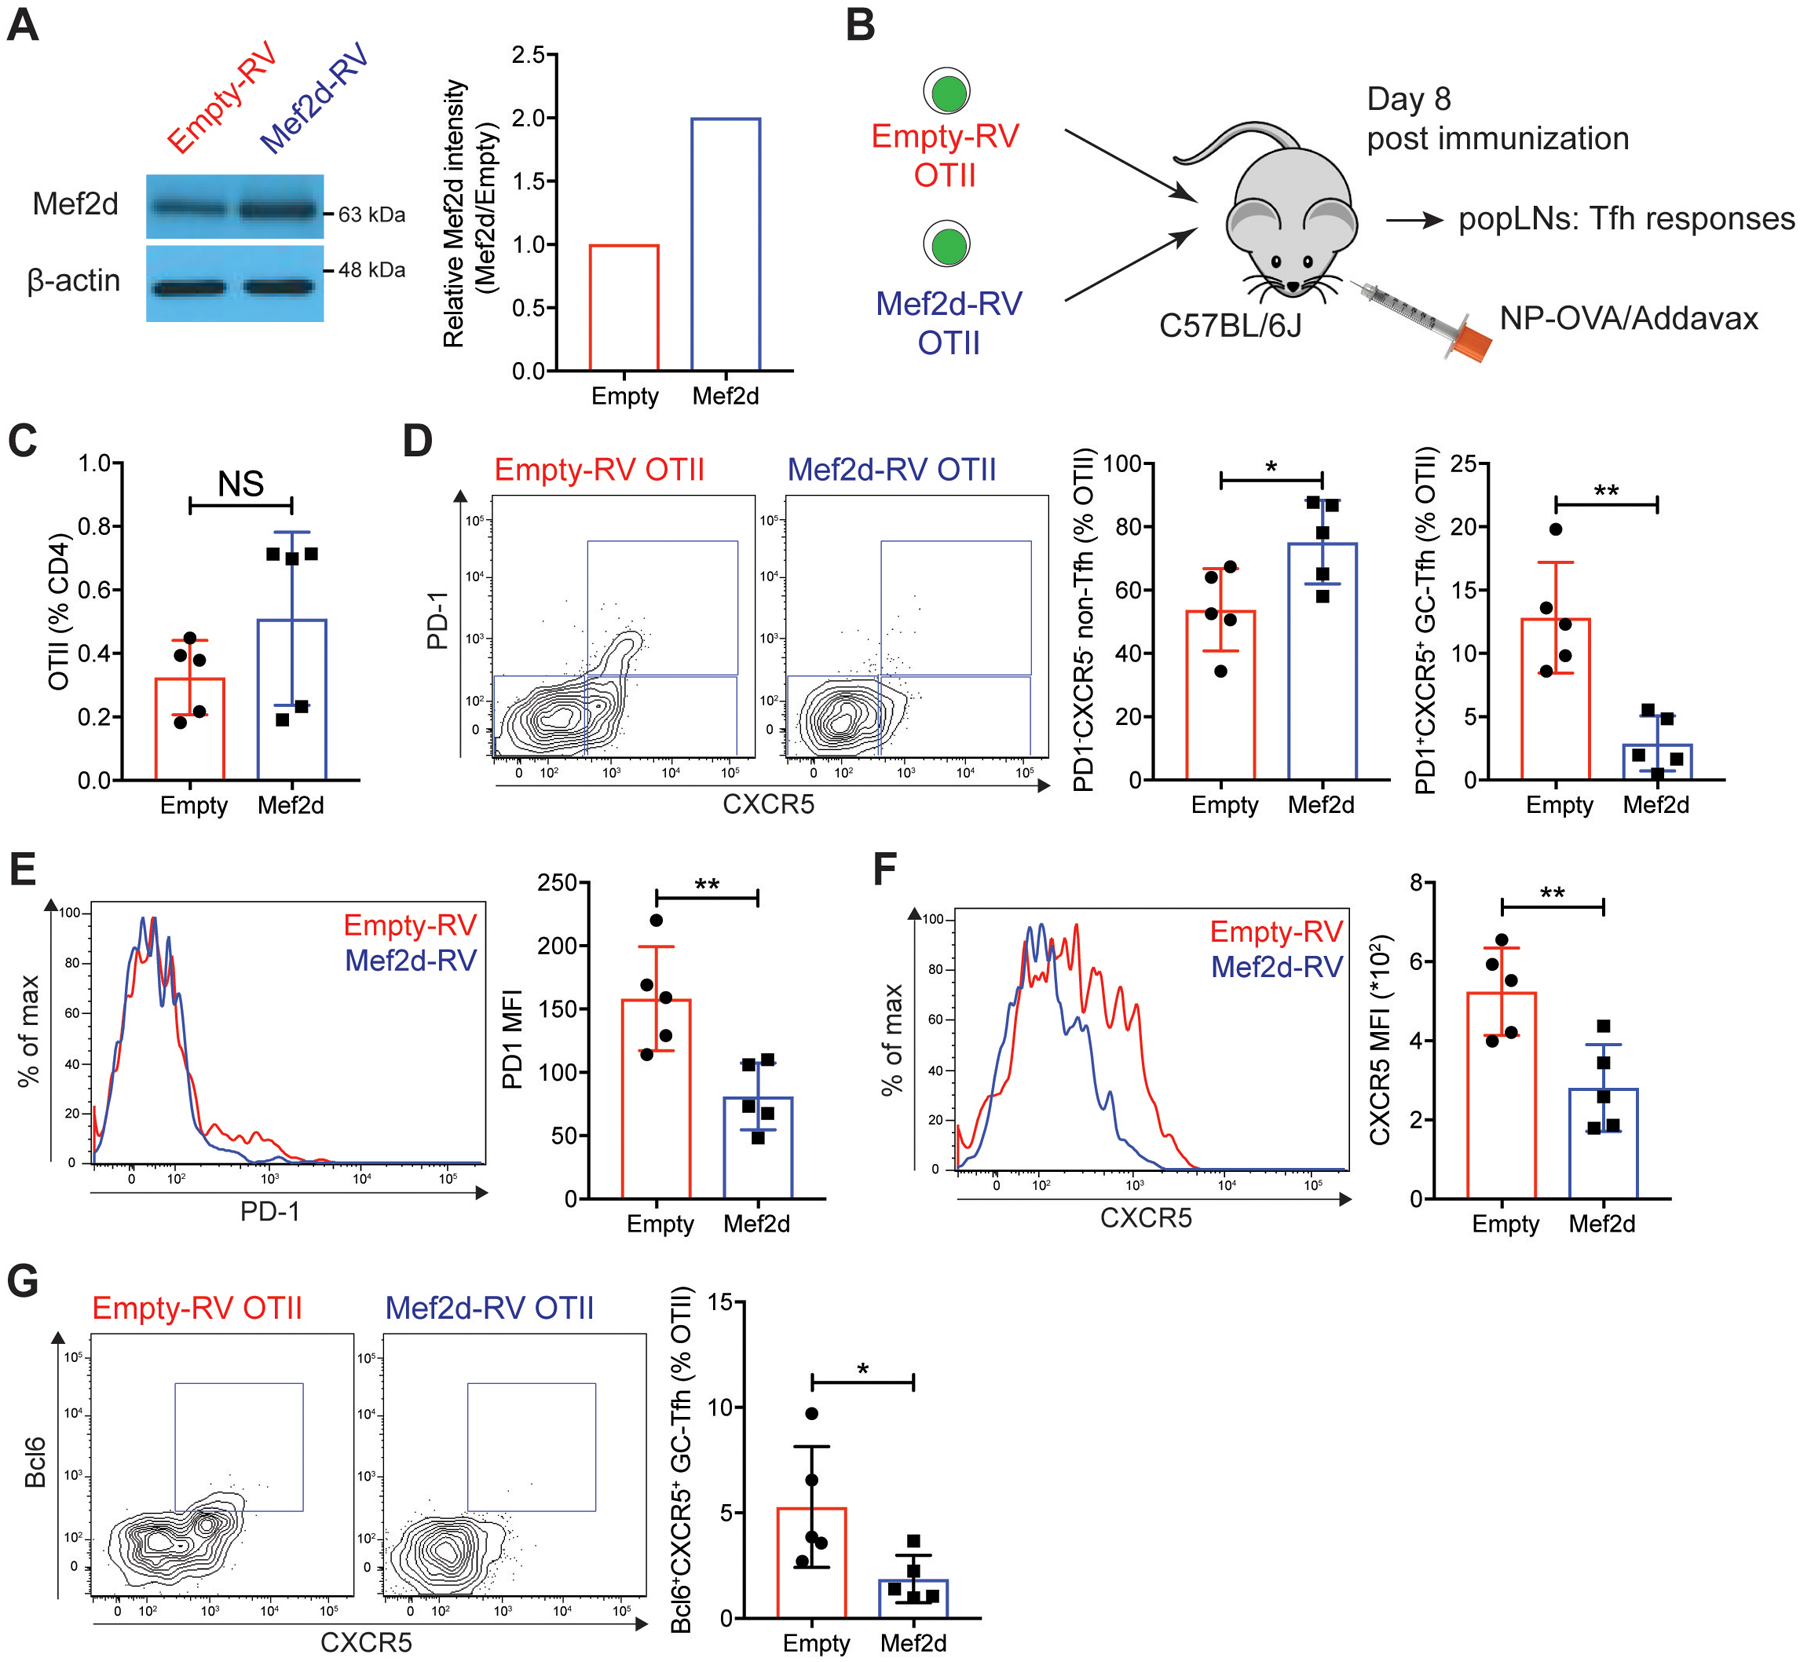
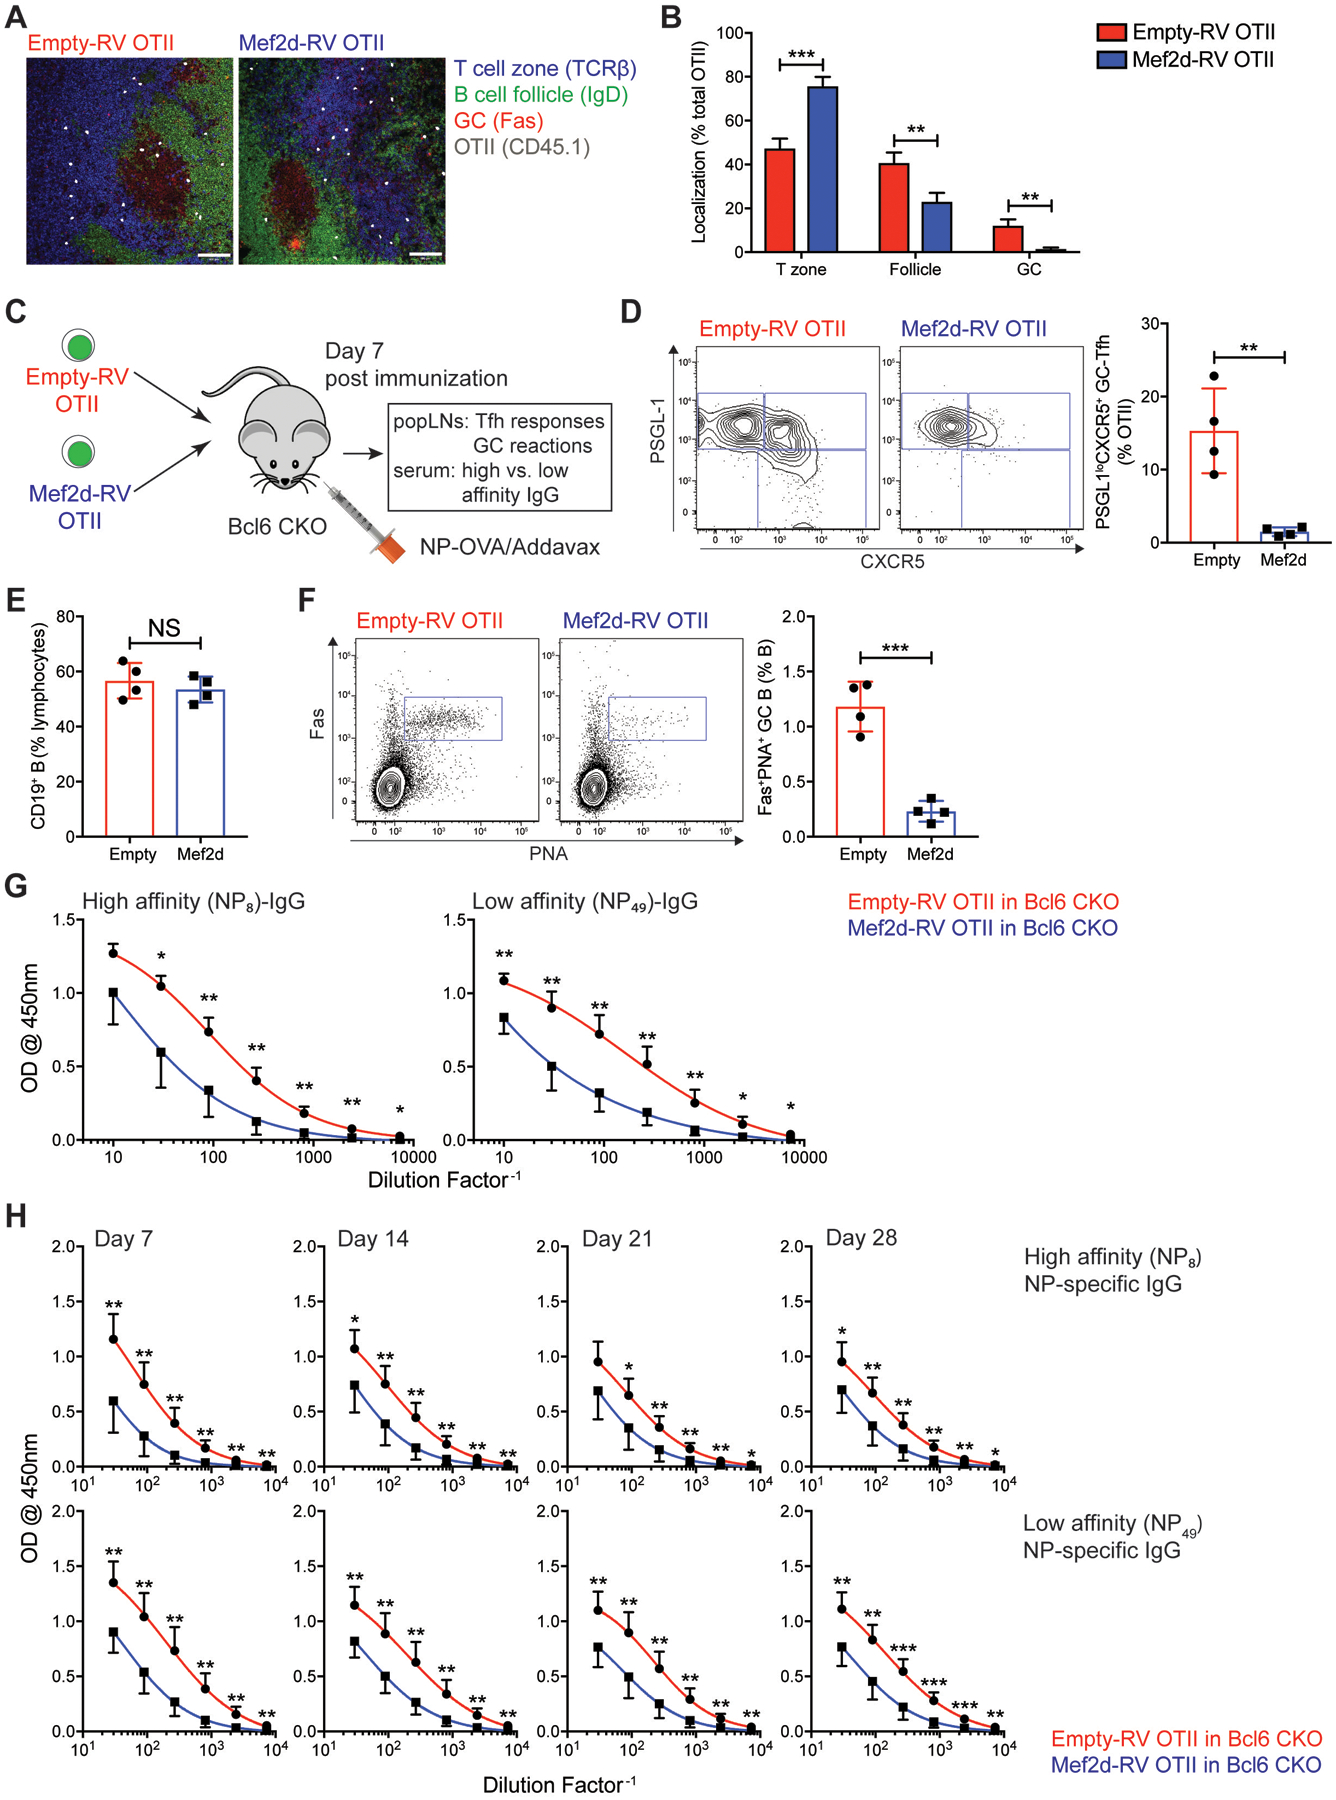
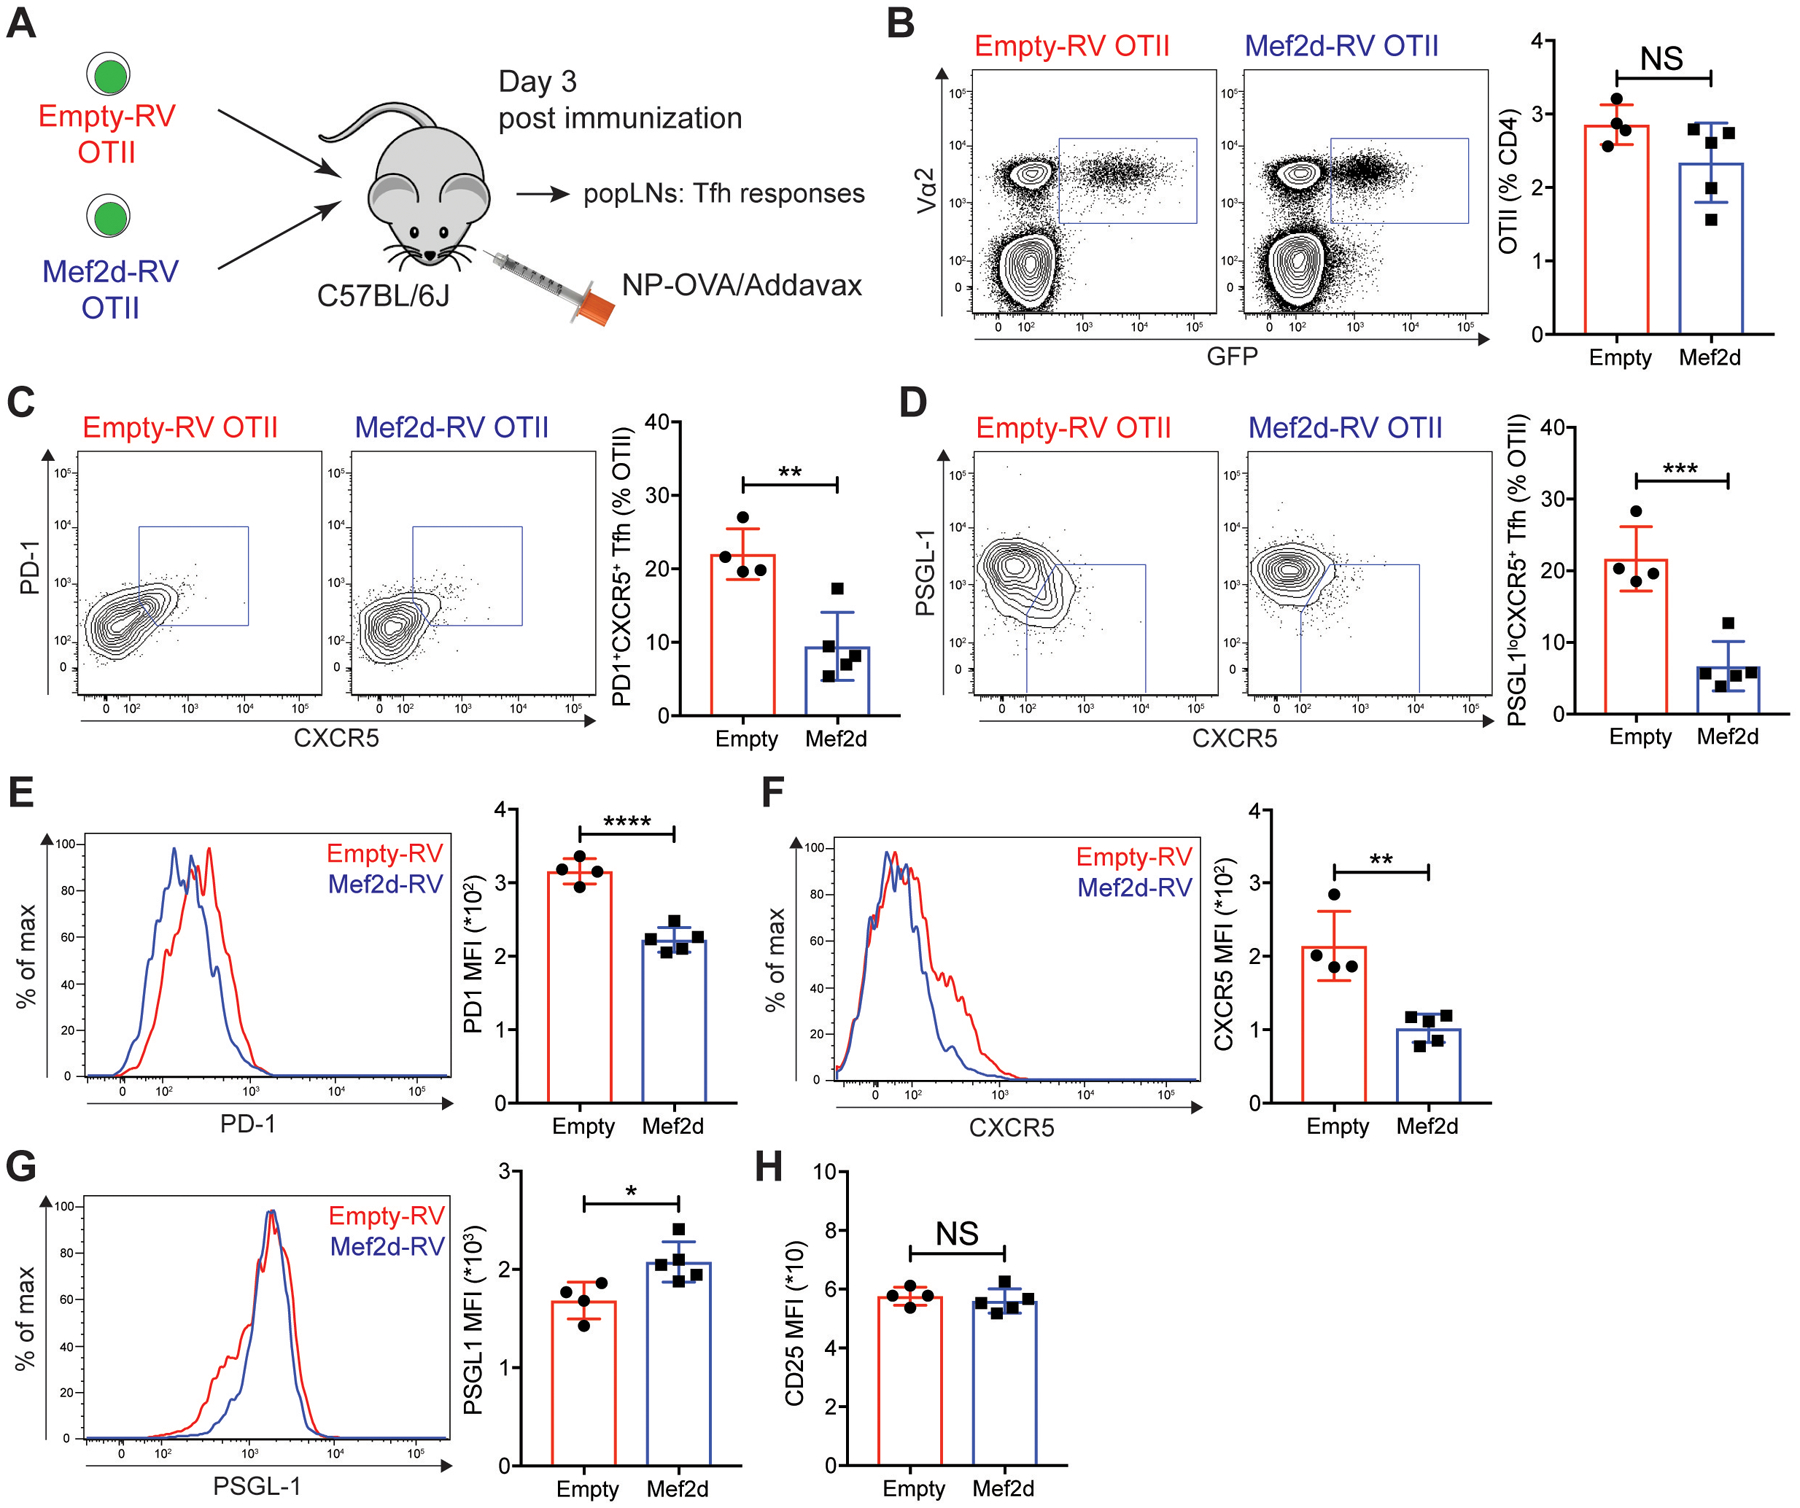
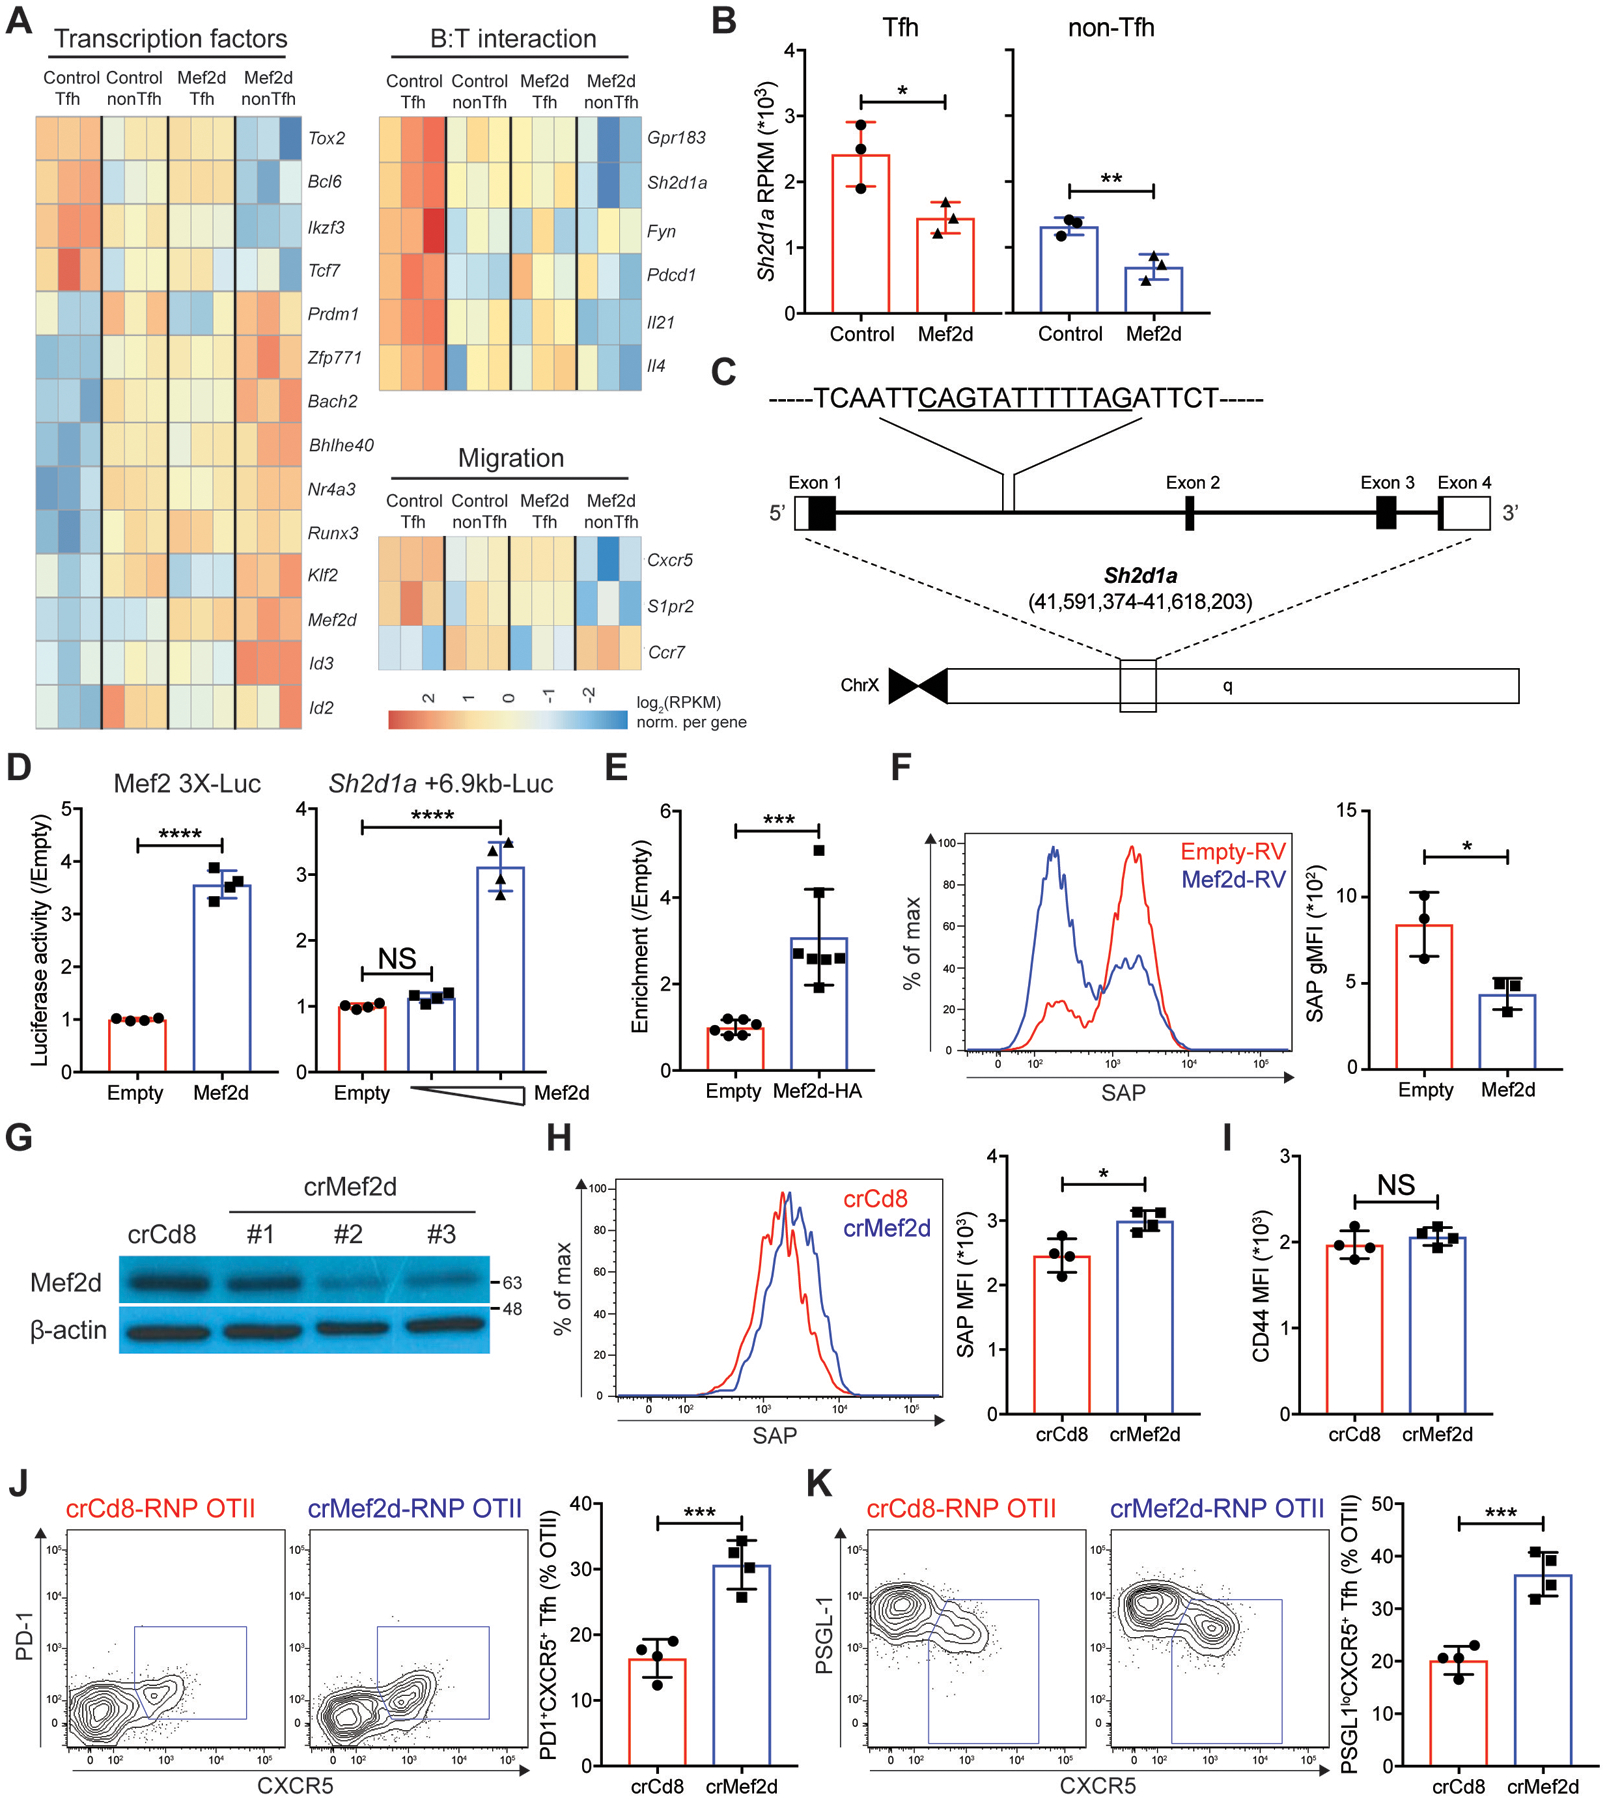
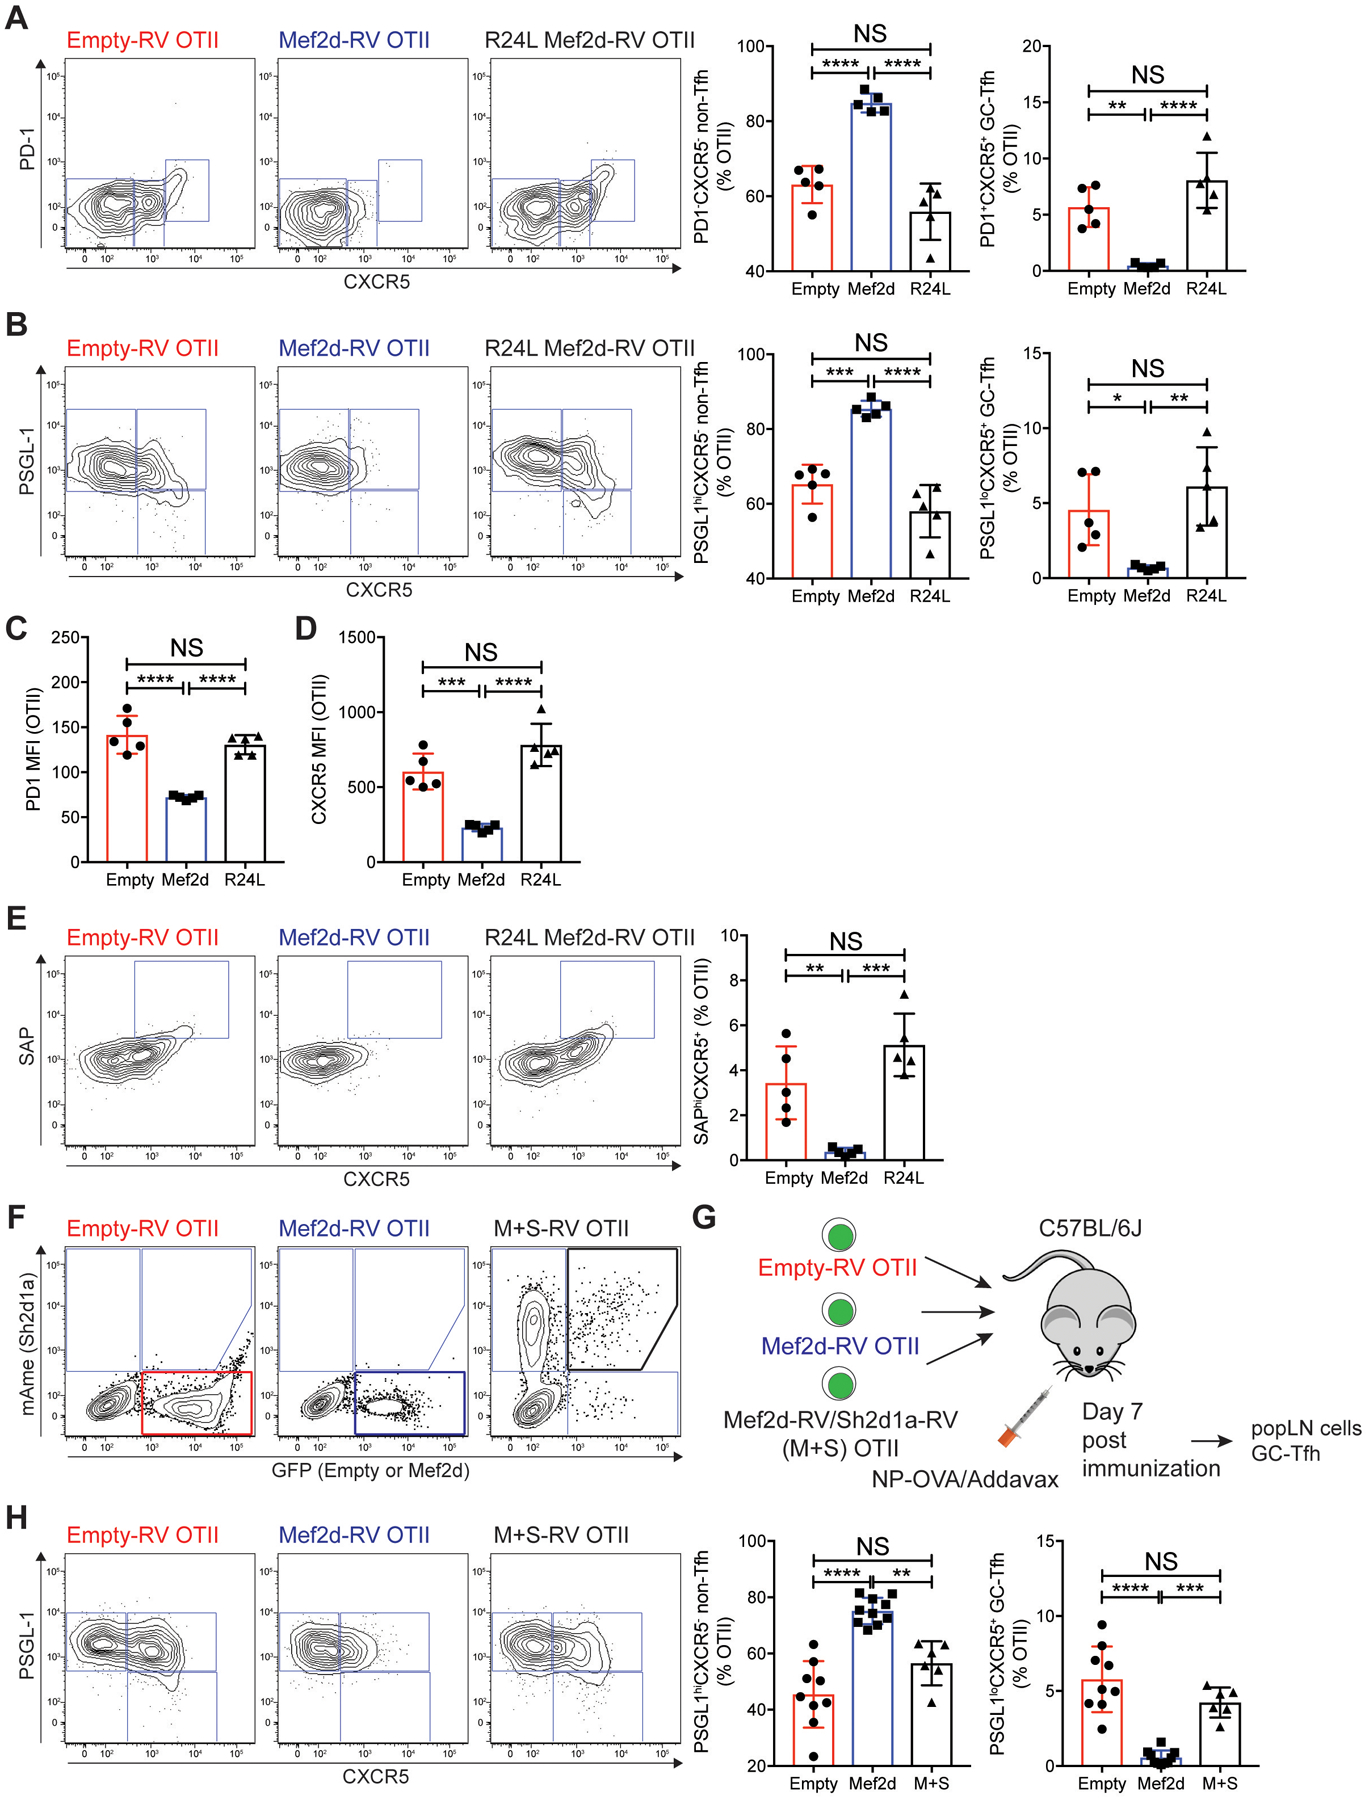
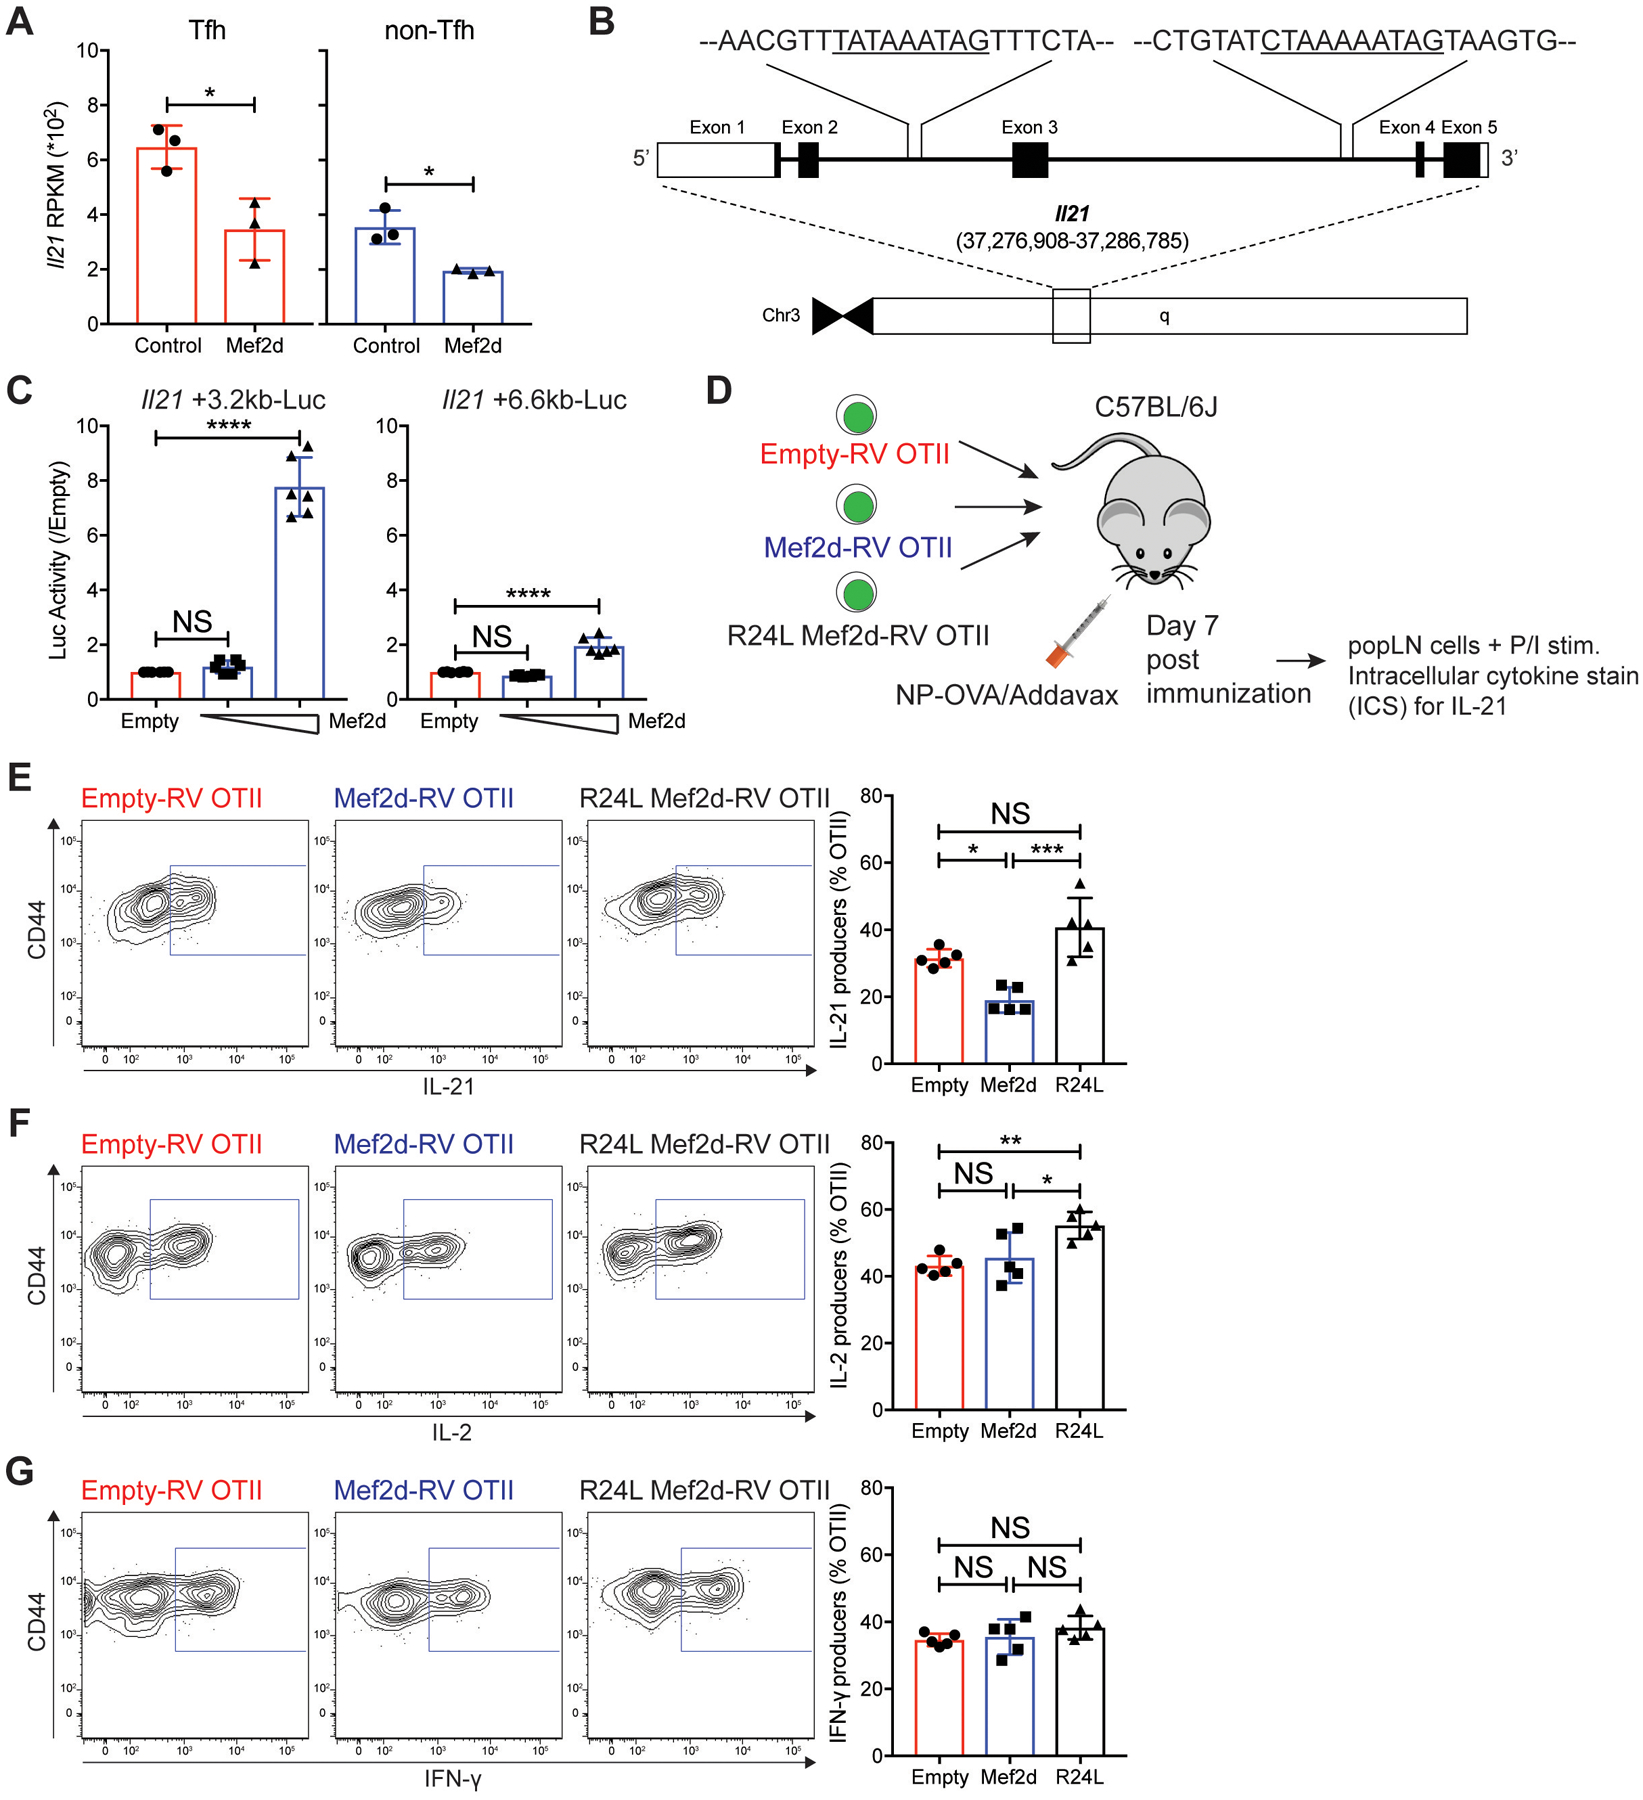
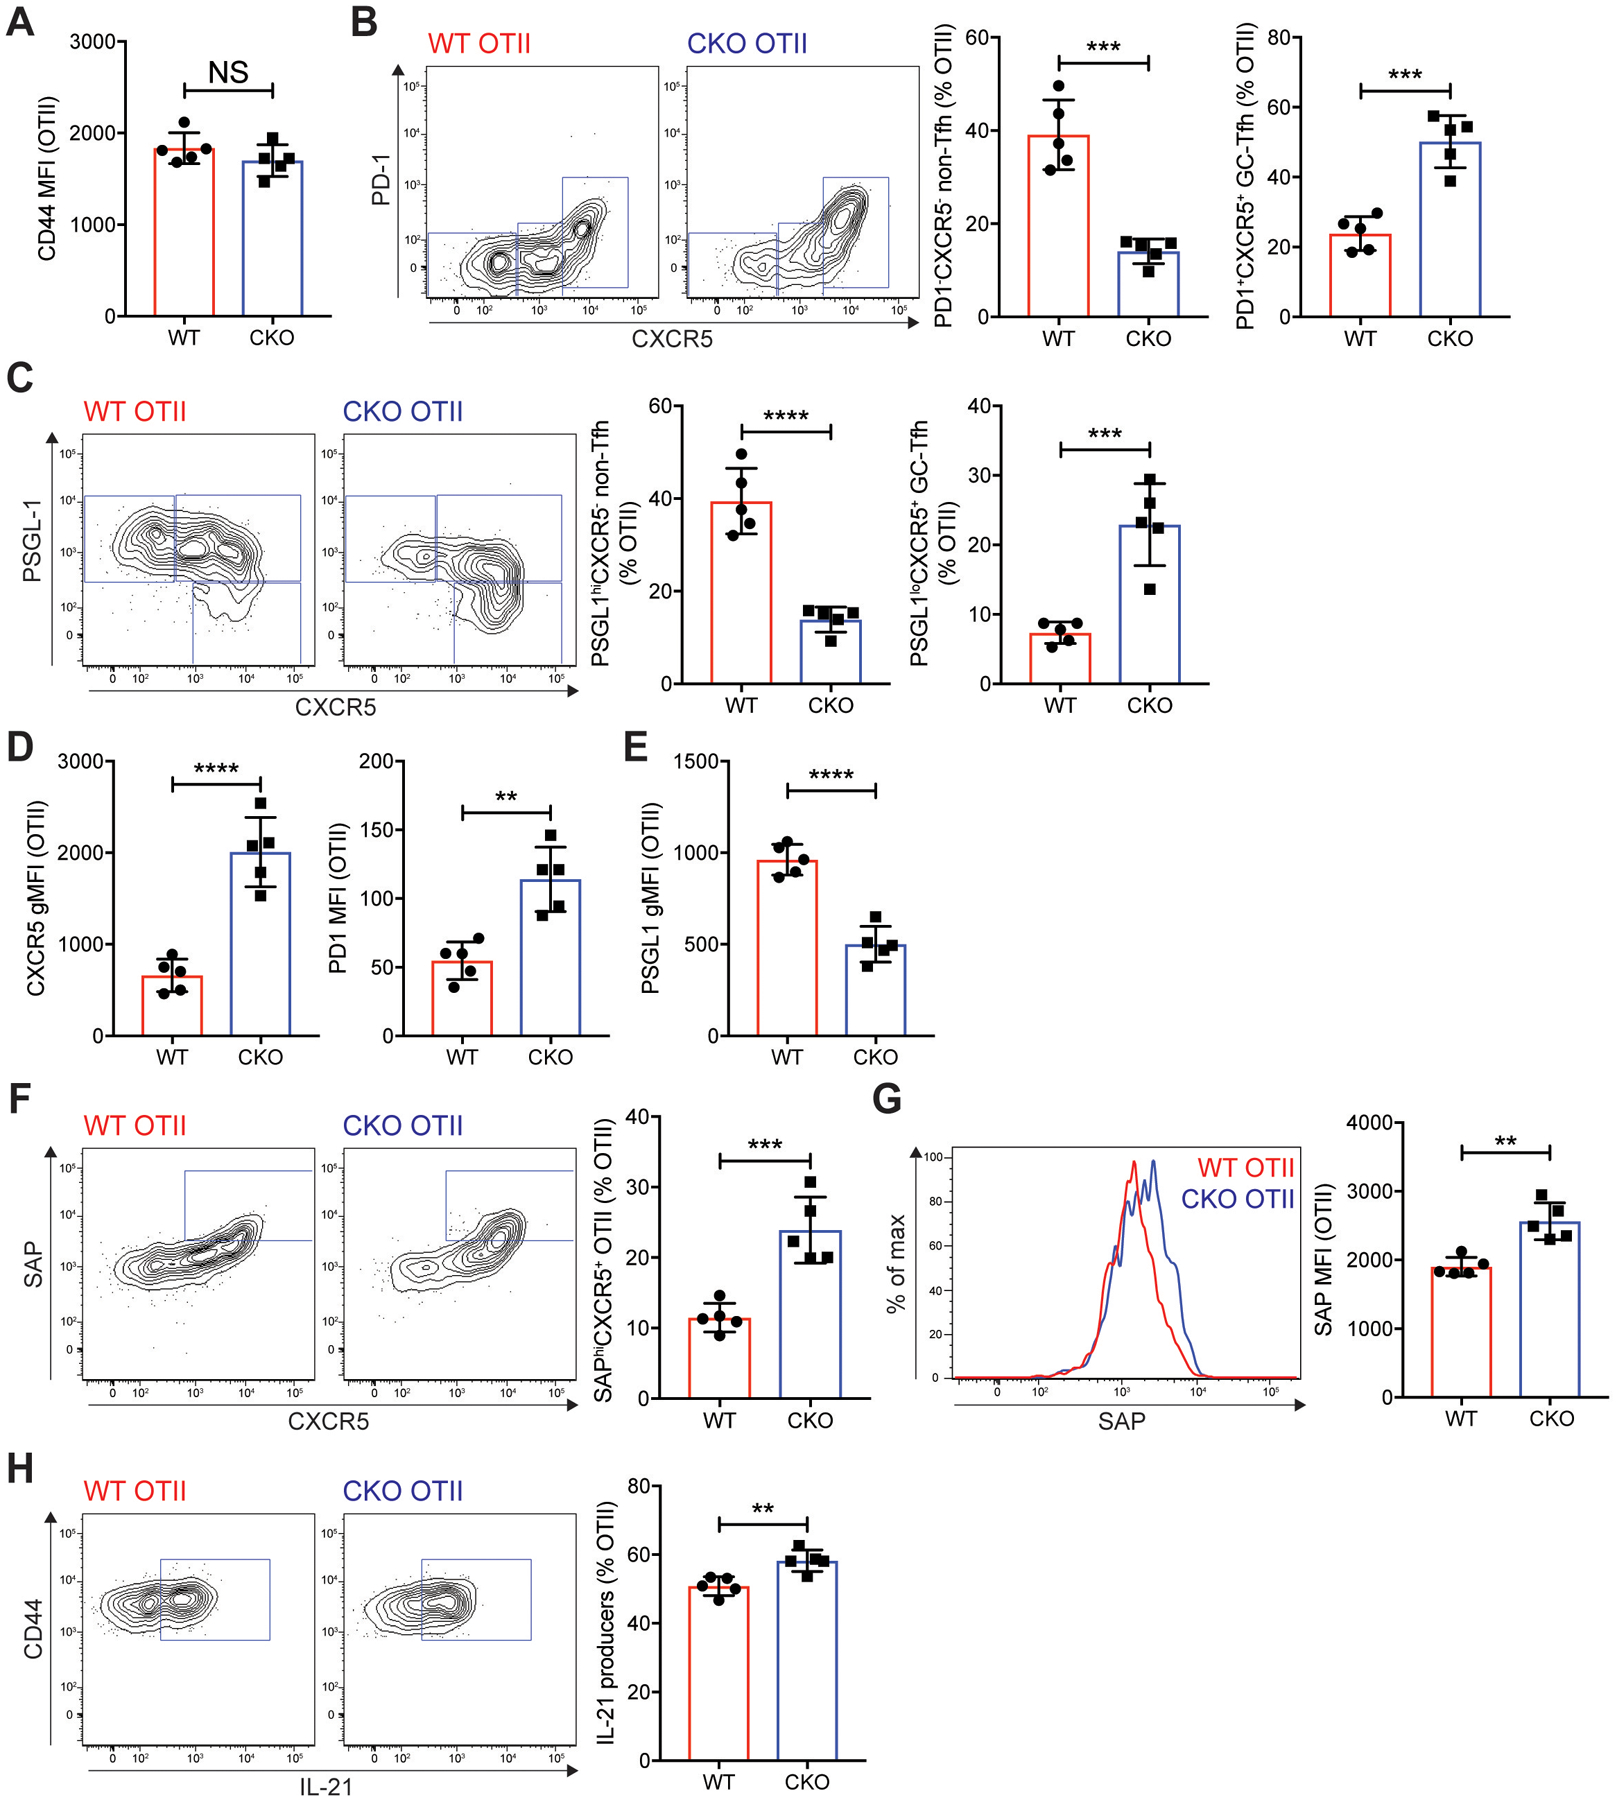
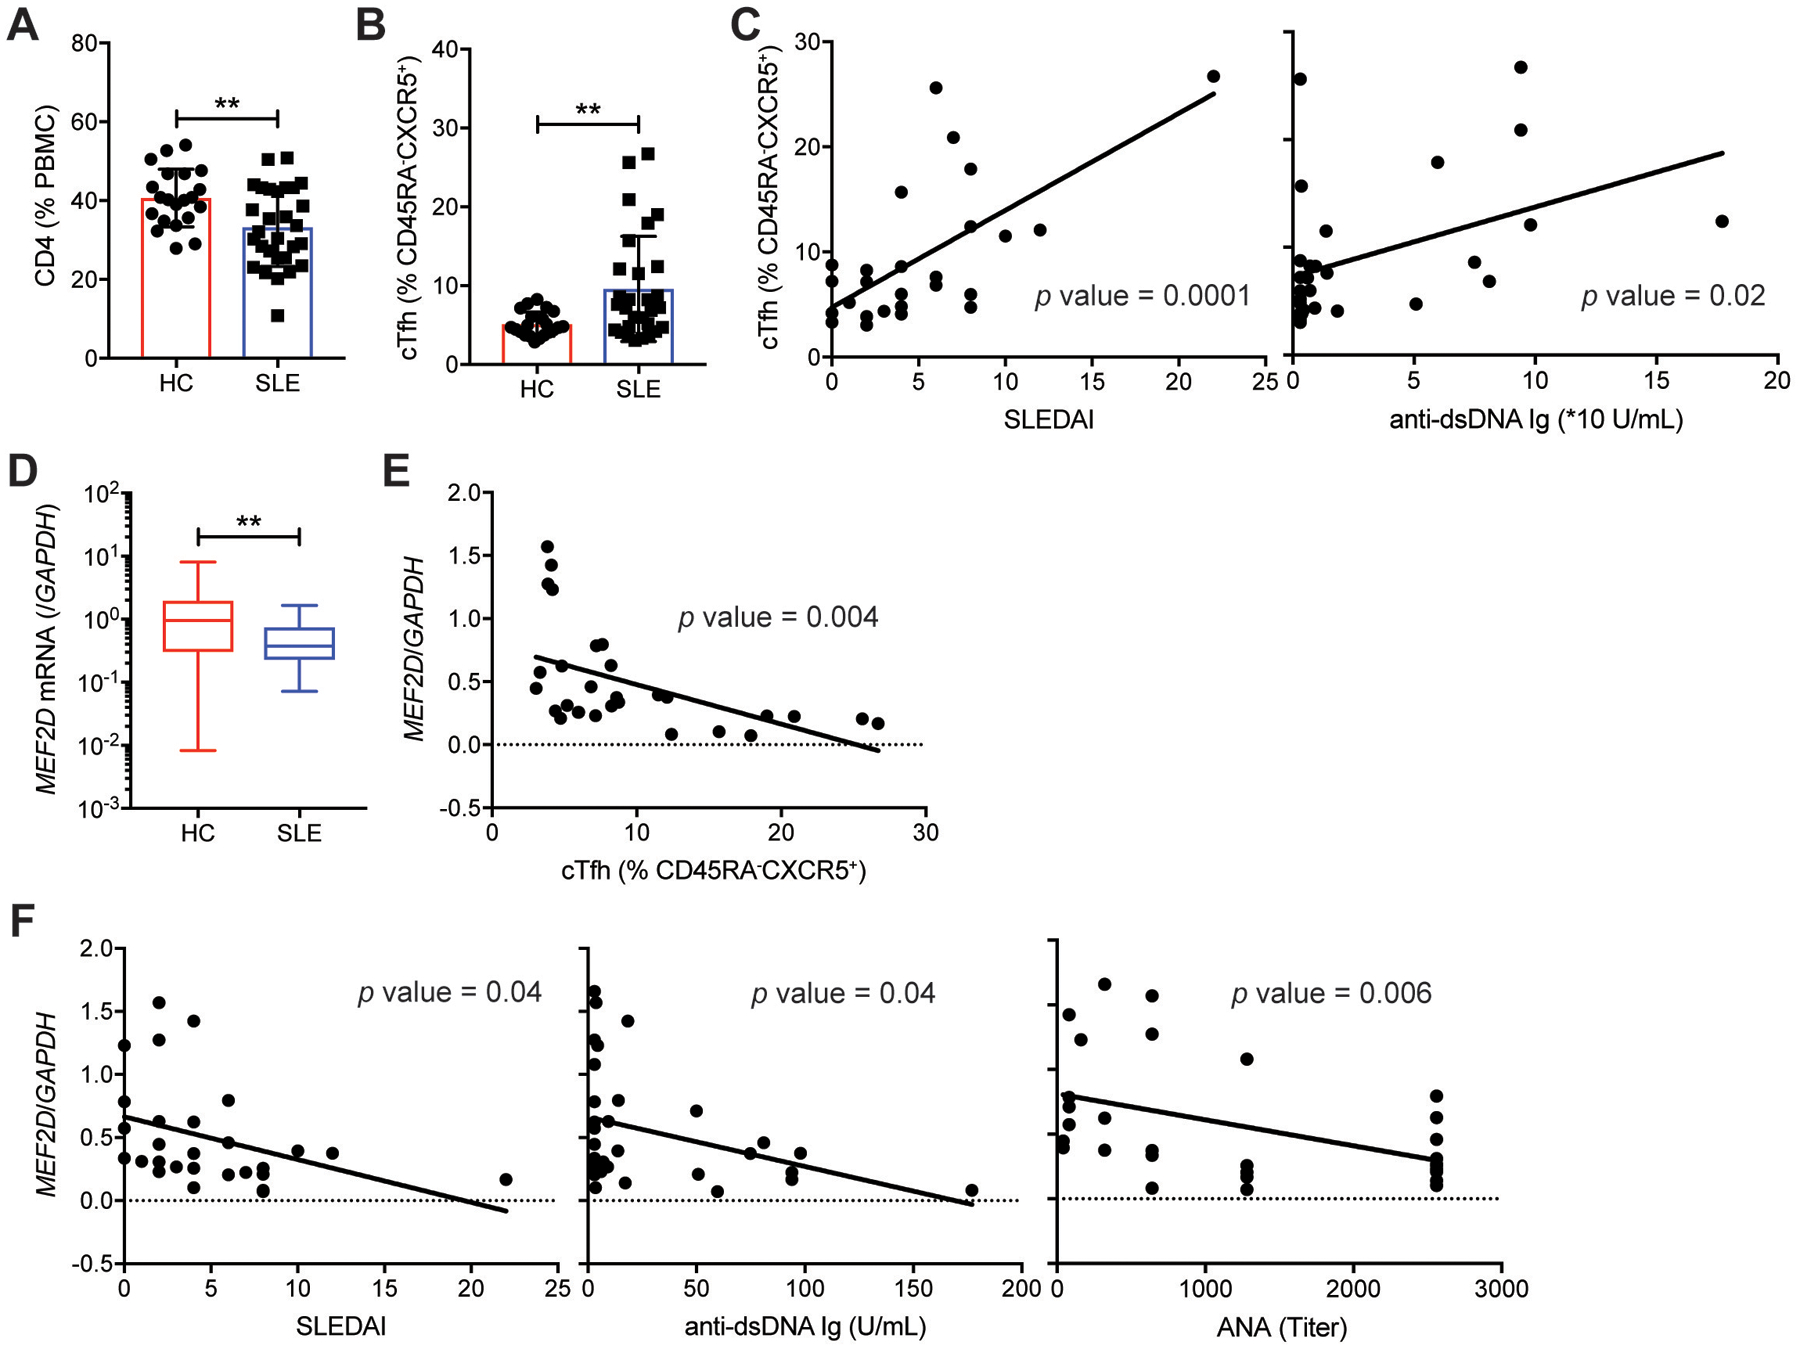
Communication between CD4 T cells and cognate B cells is key for the former to fully mature into germinal center-T follicular helper (GC-TFH) cells and for the latter to mount a CD4 T cell-dependent humoral immune response. Although this interaction occurs in a B:T synapse-dependent manner, how CD4 T cells transcriptionally regulate B:T synapse formation remains largely unknown. Here, we report that Mef2d, an isoform of the myocyte enhancer factor 2 (Mef2) transcription factor family, is a critical regulator of this process. In CD4 T cells, Mef2d negatively regulates expression of Sh2d1a, which encodes SLAM-associated protein (SAP), a critical regulator of B:T synapses. We found that Mef2d regulates Sh2d1a expression via DNA binding-dependent transcriptional repression, inhibiting SAP-dependent B:T synapse formation and preventing antigen-specific CD4 T cells from differentiating into GC-TFH cells. Mef2d also impeded IL-21 production by CD4 T cells, an important B cell help signaling molecule, via direct repression of the Il21 gene. In contrast, CD4 T cell-specific disruption of Mef2d led to a substantial increase in GC-TFH differentiation in response to protein immunization, concurrent with enhanced SAP expression. MEF2D mRNA expression inversely correlates with human systemic lupus erythematosus (SLE) patient autoimmune parameters, including circulating TFH-like cell frequencies, autoantibodies, and SLEDAI scores. These findings highlight Mef2d as a pivotal rheostat in CD4 T cells for controlling GC formation and antibody production by B cells.


Conflict of interest statement

Competing interests: The authors, including S.-H.I, the CEO and major shareholder of ImmunoBiome Inc., declare no competing financial interests.

Figures

Fig. 1.
Fig. 1.. Mef2d inhibits germinal center Tfh (GC-Tfh) formation of OTII TCRtg CD4 T cells.
(A) Immunoblots of β-actin and Mef2d protein. Relative Mef2d band intensity of Mef2d-RV cells to those of empty-RV cells. (B) Experimental scheme. Equal numbers of empty-RV or Mef2d-RV OTII CD4 T cells were transferred to C57BL/6J mice. Eight days after subcutaneous footpad immunization with NP-OVA, popLNs were examined for GC-Tfh differentiation of GFP+ OTII CD4 T cells. (C) The frequencies of GFP+ OTII CD4 T cells calculated as the percentage of total CD4 T cells. (D) Flow cytometry plots of GFP+ OTII CD4 T cells. Gates indicate PD-1CXCR5 non-Tfh, PD-1CXCR5+ Tfh, and PD-1+CXCR5+ GC-Tfh cells. Quantified frequencies of PD-1CXCR5 non-Tfh and PD-1+CXCR5+ GC-Tfh cells among GFP+ OTII CD4 T cells. (E and F) Overlaid histograms of PD-1 (E) and CXCR5 (F) of empty-RV (red) or Mef2d-RV (blue) OTII CD4 T cells. MFIs were calculated. (G) Flow cytometry plots of GFP+ OTII CD4 T cells with gates indicating Bcl6+CXCR5+ GC-Tfh cells. The frequencies of Bcl6+CXCR5+ GC-Tfh cells were calculated. Representative of two independent experiments with n=4–5 per group. Error bars indicate mean with SD. Statistical significance values were determined using two-tailed Student’s t-test. NS, statistically non-significant; * p <0.05; ** p <0.01.
Fig. 2.
Fig. 2.. Germinal center formation and antigen-specific antibody production by B cells are negatively regulated by Mef2d function in CD4 T cells.
(A) Empty-RV (left) or Mef2d-RV (right) CD45.1 OTII CD4 T cell were transferred into C57BL/6J mice. Seven days after NP-OVA immunization, popLNs were taken for IF analysis of CD45.1 OTII CD4 T cell localization (T cell zone, B cell follicle, or GC area). CD45.1 OTII CD4 T cells were shown in large dots to clarify. Scale bar = 100μm. (B) The frequencies of CD45.1 OTII CD4 T cells positioned in each location were calculated. (C to G) Empty-RV or Mef2d-RV OTII CD4 T cells were transferred into Bcl6 CKO (Cd4CreBcl6fl/fl) mice, which were immunized subcutaneously with NP-OVA. Seven days after NP-OVA immunization, popLNs and serum were examined for GC-Tfh differentiation and GC formation and NP-specific IgG production, respectively. (C) Experimental scheme for investigating the regulation of humoral immune response by the Mef2d function of CD4 T cells. (D) Flow cytometry plots of GFP+ OTII CD4 T cells present in popLNs of Bcl6 CKO mice. Gates indicate PSGL-1hiCXCR5 non-Tfh, PSGL-1hiCXCR5+ Tfh, and PSGL-1loCXCR5+ GC-Tfh cells. The frequencies of PSGL-1loCXCR5+ GC-Tfh cells were quantified. (E) The frequencies of CD19 B cells. Calculated as the percentage of total lymphocytes. (F) Flow cytometry plots of CD19 B cells with gates indicating Fas+PNA+ GC B cells. The GC B cell frequencies among the total B cells were calculated. (G) Amounts of high- (NP8-BSA) and low- (NP49-BSA) affinity NP-specific IgG antibodies measured in serum from Bcl6 CKO mice adoptively transferred with empty-RV (red) or Mef2d-RV (blue) OTII CD4 T cells. (H) Empty-RV (red) or Mef2d-RV (blue) OTII CD4 T cells were adoptively transferred into Bcl6 CKO mice, which were bled at days 7, 14, 21 and 28 after NP-OVA immunization. The high- and low-affinity NP-specific IgG production was measured by ELISA. Representative of two independent experiments (n=4–5 per group) (C to G) and composite data from two independent experiments using n=6 recipient mice per group (H). Error bars indicate mean with SEM (B) and mean with SD (D to H). Statistical significance values were determined using two-tailed Student’s t-test. NS, statistically non-significant; * p <0.05; ** p <0.01; *** p <0.001.
Fig. 3.
Fig. 3.. Mef2d inhibits the early Tfh differentiation of antigen-specific CD4 T cells.
(A) Experimental scheme to analyze Mef2d functions during early Tfh differentiation of CD4 T cells. The same number of empty-RV or Mef2d-RV OTII CD4 T cells were transferred into C57BL/6J mice. Three days after subcutaneous NP-OVA immunization, popLNs were examined for Tfh differentiation of GFP+ OTII CD4 T cells. (B) Flow cytometry plots of CD4 T cells in the popLNs. Vα2+GFP+ OTII CD4 T cells were gated and quantified. (C and D) Flow cytometry plots of the transferred GFP+ OTII CD4 T cells with gates indicating PD-1+CXCR5+ (C) and PSGL-1loCXCR5+ (D) Tfh cells. The frequencies of PD-1+CXCR5+ and PSGL-1loCXCR5+ Tfh cells among the GFP+ OTII CD4 T cells were calculated. (E to G) Overlaid histograms of PD-1 (E), CXCR5 (F), and PSGL-1 (G) of empty-RV (red) and Mef2d-RV (blue) OTII CD4 T cells. MFIs were calculated. (H) Quantification of CD25 MFIs from empty-RV and Mef2d-RV OTII CD4 T cells. Representative of two independent experiments with n=4–5 mice per group. Error bars indicate mean with SD. Statistical significance values were determined using two-tailed Student’s t-test. NS, statistically non-significant; * p <0.05; ** p <0.01; *** p <0.001; **** p <0.0001.
Fig. 4.
Fig. 4.. Mef2d impedes Tfh differentiation of CD4 T cells via direct repression of the Sh2d1a expression.
(A and B) RNA-seq was performed with three biological replicates of Tfh cells and non-Tfh cells that developed from empty-RV or Mef2d-RV OTII CD4 T cells. Each biological sample was obtained by sorting GFP+ Tfh and GFP+ non-Tfh cells from 8–12 recipient C57BL/6J mice per group. (A) Differentially expressed genes by control Tfh, control non-Tfh, Mef2d Tfh, and Mef2d non-Tfh cells, which were categorized based on reported gene functions and presented as high (red) to low (blue) expression levels. (B) Sh2d1a gene RPKMs of Tfh (red) and non-Tfh (blue) cells developed from empty-RV (circles) or Mef2d-RV (triangles) OTII CD4 T cells. (C) The genomic region of the murine Sh2d1a gene with a putative Mef2d binding site (CAGTATTTTTAG) at +6.9 kb from the Sh2d1a gene transcription start site. (D) Luciferase activities of the pGL4.10 plasmids with three Mef2 binding sites (Mef2 3X-Luc) or with a 1.5 kb region of the Sh2d1a locus containing CAGTATTTTTAG (Sh2d1a +6.9kb-Luc) in the presence or absence of Mef2d co-expression (0.05 μg for Mef2 3X-Luc and 0.05 and 0.8 μg for Sh2d1a +6.9kb-Luc). Data from two independent experiments with duplicate wells per each condition. (E) Shown is the fold enrichment of the Sh2d1a +6.9kb DNA region bound by HA-tagged Mef2d in HEK293T cells transfected with empty-pCMV or Mef2d-HA-pCMV. Data from three independent experiments with duplicate samples for each condition. (F) Intracellular SAP expression of in vitro stimulated polyclonal CD4 T cells, which were transduced with empty-RV (red) or Mef2d-RV (blue). Overlaid SAP histograms. Geometric SAP MFIs of GFP+ CD4 T cells from three independent experiments were calculated. (G to K) SAP expression and early Tfh differentiation of Mef2d gene disrupted OTII CD4 T cells were examined. CD45.1 OTII CD4 T cells were transfected with either crCd8-RNP or crMef2d-RNP (#2), which were then adoptively transferred into C57BL/6J mice. Three days after NP-OVA immunization, the donor cells were examined for Tfh differentiation and SAP expression. (G) β-actin and Mef2d immunoblots with cell lysates obtained from crCd8-RNP+ or crMef2d-RNP+ OTII CD4 T cells. (H) Overlaid histograms of SAP of the donor cells. SAP MFIs were quantified. (I) CD44 MFIs of the donor OTII CD4 T cells were calculated. (J and K) Flow cytometry plots of the donor OTII CD4 T cells with gates indicating PD-1+CXCR5+ (J) and PSGL-1loCXCR5+ (K) Tfh cells. The frequencies of PD-1+CXCR5+ and PSGL-1loCXCR5+ Tfh cells among the donor OTII CD4 T cells were calculated. Representative of two independent experiments with n=4 mice per group. Error bars indicate mean with SD. Statistical significance values were determined using two-tailed Student’s t-test [B, D (left) to F, and H to K] and one-way ANOVA with Tukey’s multiple comparisons test [D (right)]. NS, statistically non-significant; * p <0.05; ** p <0.01; *** p <0.001; **** p <0.0001.
Fig. 5.
Fig. 5.. Mef2d negatively regulates GC-Tfh differentiation of antigen-specific CD4 T cells via DNA binding-dependent regulation of SAP expression.
(A to E) Empty-RV (red), Mef2d-RV (blue), or R24L Mef2d-RV (black) CD45.1 OTII CD4 T cells were adoptively transferred into C57BL/6J mice, which were immunized subcutaneously with NP-OVA. Seven days after NP-OVA immunization, the transferred GFP+ CD45.1 OTII CD4 T cells in popLNs were analyzed. (A and B) Flow cytometry plots of GFP+ CD45.1 OTII CD4 T cells. Gates indicate non-Tfh (PD-1CXCR5 or PSGL-1hiCXCR5), Tfh (PD-1CXCR5+ or PSGL-1hiCXCR5+), and GC-Tfh (PD-1+CXCR5+ or PSGL-1loCXCR5+) cells. The frequencies of non-Tfh and GC-Tfh cells developed from the respective donor cells were calculated. (C and D) MFIs of PD-1 (C) and CXCR5 (D) of the donor cells were quantified. (E) Flow cytometry plots of the donor cells. Gates indicate the SAPhiCXCR5+ compartment. The SAPhiCXCR5+ cell frequencies were calculated. (F to H) GC-Tfh differentiation of Mef2d-RV OTII CD4 T cells was examined in the presence or absence of ectopic co-expression of SAP. (F) Flow cytometry plots CD45.1 OTII CD4 T cells transduced with empty-RVGFP or Mef2d-RVGFP with or without Sh2d1a-RVmAmetrine. Empty-RVGFP+ (red box), Mef2d-RVGFP+ (blue box), or Mef2d+Sh2d1a-RVGFP+mAmetrine+ (black box) OTII CD4 T cells were highlighted. (G) The respective RV+ OTII CD4 T cells were sorted and transferred into C57BL/6J mice. Seven days after NP-OVA immunization, popLNs were examined for GC-Tfh differentiation and IL-21 production (fig. S7, C–D) of the donor OTII CD4 T cells were examined. (H) Flow cytometry plots of RV+ OTII CD4 T cells with gates indicating non-Tfh (PSGL-1hiCXCR5), Tfh (PSGL-1hiCXCR5+), and GC-Tfh (PSGL-1loCXCR5+) cells. The frequencies of non-Tfh and GC-Tfh cells were calculated. Representative of three independent experiments with n=5 mice per group (A to E) and composite data from two independent experiments using n=6–10 recipient mice per group (F to H). Error bars indicate mean with SD. Statistical significance values were determined using one-way ANOVA with Tukey’s multiple comparisons test. NS, statistically non-significant; * p <0.05; ** p <0.01; *** p <0.001; **** p <0.0001.
Fig. 6.
Fig. 6.. Mef2d hinders IL-21 production of antigen-specific CD4 T cells via DNA binding dependent repression of the Il21 gene.
(A) RPKMs of the Il21 gene of Tfh (red) and non-Tfh (blue) cells developed from empty-RV (circles) or Mef2d-RV (triangles) OTII CD4 T cells. (B) The genomic region of the murine Il21 gene with putative Mef2d binding sites at +3.2 kb (TATAAATAG) and +6.6 kb (CTAAAAATAG) from the Il21 gene transcription start site. (C) Luciferase activities of the pGL4.10 plasmids with +3.2 kb or +6.6 kb region of Il21 locus (~1.5kb long) containing the potential Mef2d binding sites in the presence or absence of Mef2d co-expression (0.05 and 0.8 μg for respective luciferase plasmids). (D to G) CD45.1 OTII CD4 T cells, transduced with empty-RV, Mef2d-RV, or R24L Mef2d-RV, were transferred into C57BL/6J mice. Seven days after NP-OVA immunization, the transferred cells were analyzed for production of IL-21, IL-2 and IFN-γ. (D) Experimental scheme to investigate the regulation of IL-21 production of CD4 T cells by Mef2d. (E to G) Flow cytometry plots of empty-RV, Mef2d-RV, and R24L Mef2d-RV OTII CD4 T cells, as shown in Fig. 5 A–E. Gates indicate IL-21 (E), IL-2 (F), and IFN-γ (G) producers. The frequencies of respective populations among GFP+ OTII CD4 T cells were calculated. Analysis was performed with the data obtained from three independent experiments (two replicate samples/experiment) (C) and data are representative of three independent experiments with n=5 mice per group (D to G). Error bars indicate mean with SD. Statistical significance values were determined using two-tailed Student’s t-test (A) and one-way ANOVA with Tukey’s multiple comparisons test (C, E to G). NS, statistically non-significant; * p <0.05; ** p <0.01; *** p <0.001; **** p <0.0001.
Fig. 7.
Fig. 7.. Mef2d deficiency leads to enhanced SAP expression, IL-21 production and GC-Tfh differentiation of antigen-specific CD4 T cells.
WT control and Mef2d CKO (Cd4CreMef2dfl/fl) CD45.2 OTII CD4 T cells were transferred into CD45.1 B6.SJL mice, which were immunized subcutaneously with NP-OVA. Seven days later, popLNs were examined for GC-Tfh differentiation, SAP expression, and IL-21 production. (A) CD44 MFIs of the donor OTII CD4 T cells in the popLNs. (B and C) Flow cytometry plots of the transferred OTII CD4 T cells. Gates indicate non-Tfh (PD-1CXCR5 or PSGL-1hiCXCR5), Tfh (PD-1CXCR5+ or PSGL-1hiCXCR5+), and GC-Tfh (PD-1+CXCR5+ or PSGL-1loCXCR5+) cells. The frequencies of non-Tfh and GC-Tfh cells were calculated. (D) CXCR5 gMFIs and PD-1 MFIs of the donor OTII CD4 T cells were quantified. (E) PSGL-1 gMFIs of the donor cells were calculated. (F and G) SAP expression of the WT control and Mef2d CKO OTII CD4 T cells were examined. Flow cytometry plots of the donor cells with gates indicating SAPhiCXCR5+ compartment (F). Overlaid SAP histograms (G). SAPhiCXCR5+ cell frequencies and intracellular SAP MFIs were quantified. (H) Flow cytometry plots of the transferred OTII CD4 T cells. Gates indicate IL-21 producing cells. The frequencies of IL-21 producers were quantified. Representative of two independent experiments with n=5 mice per group. Error bars indicate mean with SD. Statistical significance values were determined using two-tailed Student’s t-test. NS, statistically non-significant; ** p <0.01; *** p <0.001; **** p <0.0001.
Fig. 8.
Fig. 8.. Reduced MEF2D expression in CD4 T cells is associated with autoimmune SLE conditions.
(A) Frequencies of CD4 T cells in PBMC from healthy controls and SLE patients (table S3a). (B) Frequencies of ICOS+PD-1+ circulating Tfh (cTfh) cells (gating strategy shown in fig. S10A) among peripheral blood CD45RACXCR5+ CD4 T cells of healthy controls and SLE patients (table S3a). (C) Correlations of ICOS+PD-1+ cTfh cell frequency with SLEDAI and anti-dsDNA Ig level in the SLE patients. (D) MEF2D mRNA measured by qPCR in peripheral blood CD4 T cells obtained from healthy controls and from the SLE patients (table S3a). (E) Correlation of the MEF2D expression of CD4 T cells with the ICOS+PD-1+ cTfh cell frequency in the SLE patients. (F) Correlations of the MEF2D expression of the SLE CD4 T cells with SLEDAI, anti-dsDNA Ig, and ANA. Error bars indicate mean with SD (A and B) and mean with min to max (D). Statistical significance values were determined using two-tailed Student’s t-test (A, B, and D) and Pearson’s correlation analysis (C, E, and F). ** p <0.01.

References

    1. Donnadieu E, Revy P, Trautmann A, Imaging T-cell antigen recognition and comparing immunological and neuronal synapses. Immunology 103, 417–425 (2001). - PMC - PubMed
    1. Dustin ML, Colman DR, Neural and immunological synaptic relations. Science 298, 785–789 (2002). - PubMed
    1. Yamada S, Nelson WJ, Synapses: sites of cell recognition, adhesion, and functional specification. Annu. Rev. Biochem 76, 267–294 (2007). - PMC - PubMed
    1. Fooksman DR, Vardhana S, Vasiliver-Shamis G, Liese J, Blair DA, Waite J, Sacristán C, Victora GD, Zanin-Zhorov A, Dustin ML, Functional anatomy of T cell activation and synapse formation. Annu. Rev. Immunol 28, 79–105 (2010). - PMC - PubMed
    1. Dustin ML, Signaling at neuro/immune synapses. J. Clin. Investig 122, 1149–1155 (2012). - PMC - PubMed

Publication types