. 2023 Mar 28;120(13):e2213690120.
doi: 10.1073/pnas.2213690120. Epub 2023 Mar 24.

Structural constraints link differences in neutralization potency of human anti-Eastern equine encephalitis virus monoclonal antibodies

Affiliations

Structural constraints link differences in neutralization potency of human anti-Eastern equine encephalitis virus monoclonal antibodies

Lauren E Williamson et al. Proc Natl Acad Sci U S A. .

Abstract

Selection and development of monoclonal antibody (mAb) therapeutics against pathogenic viruses depends on certain functional characteristics. Neutralization potency, or the half-maximal inhibitory concentration (IC50) values, is an important characteristic of candidate therapeutic antibodies. Structural insights into the bases of neutralization potency differences between antiviral neutralizing mAbs are lacking. In this report, we present cryo-electron microscopy (EM) reconstructions of three anti-Eastern equine encephalitis virus (EEEV) neutralizing human mAbs targeting overlapping epitopes on the E2 protein, with greater than 20-fold differences in their respective IC50 values. From our structural and biophysical analyses, we identify several constraints that contribute to the observed differences in the neutralization potencies. Cryo-EM reconstructions of EEEV in complex with these Fab fragments reveal structural constraints that dictate intravirion or intervirion cross-linking of glycoprotein spikes by their IgG counterparts as a mechanism of neutralization. Additionally, we describe critical features for the recognition of EEEV by these mAbs including the epitope-paratope interaction surface, occupancy, and kinetic differences in on-rate for binding to the E2 protein. Each constraint contributes to the extent of EEEV inhibition for blockade of virus entry, fusion, and/or egress. These findings provide structural and biophysical insights into the differences in mechanism and neutralization potencies of these antibodies, which help inform rational design principles for candidate vaccines and therapeutic antibodies for all icosahedral viruses.

Keywords: alphavirus; antibodies, human monoclonal; cryo-EM; neutralization; therapy.


Conflict of interest statement

L.E.W. serves as a consultant for BigHat Biosciences. The content of this article is solely the responsibility of the authors and does not represent the official views of BigHat Biosciences. J.E.C. has served as a consultant for Luna Labs USA, Merck Sharp & Dohme Corporation, Emergent Biosolutions, GlaxoSmithKline, and BTG International Inc, is a member of the Scientific Advisory Board of Meissa Vaccines, a former member of the Scientific Advisory Board of Gigagen (Grifols), and is founder of IDBiologics. The laboratory of J.E.C. received unrelated sponsored research agreements from AstraZeneca, Takeda, and IDBiologics during the conduct of the study. The Crowe laboratory at Vanderbilt University Medical Center has received unrelated sponsored research agreements from IDBiologics, Takeda Pharmaceuticals, and AstraZeneca. All other authors report no conflicts. J.E.C. has owns stock in IDBiologics and has stock options in Meissa Vaccines. Vanderbilt University has applied for a patent related to antibodies described in this paper. The Crowe laboratory at Vanderbilt University Medical Center has received unrelated sponsored research agreements from IDBiologics, Takeda Pharmaceuticals, and AstraZeneca. J.E.C. is a member of the Scientific Advisory Board of Meissa Vaccines, a former member of the Gigagen Scientific Advisory Board, and is Founder of IDBiologics.

Figures
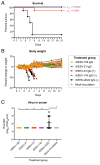
Fig. 1.
Fig. 1.
Human anti-EEEV mAbs treat against EEEV following subcutaneous challenge. C57BL/6 mice were inoculated subcutaneously (s.c.) with 103.3 CCID50 of wild-type EEEV (strain FL93-939). After 24 h, mAb was administered intraperitoneally (i.p.) with 200 µg/mouse (10 mg/kg; n = 10). Previously published controls were also used in this study for the negative control dengue virus mAb, rDENV-2D22 IgG (black), and mock-inoculated normal controls (gray; n = 5) (47). (A) rEEEV-106 (orange) or rEEEV-21 (green) IgG mediated 100% survival compared with the negative control treatment group (rDENV-2D22). rEEEV-33 (red) or rEEEV-143 (purple) IgG were included as positive-control mAbs, since these mAbs provided protection in a stringent EEEV aerosol challenge model (41). Survival curves were compared using the log-rank test with Bonferroni multiple comparisons correction (**padj < 0.001, ***padj < 0.0004). (B) Body weight change (%) of each treatment (mAb and mock) group for 18 d post-inoculation. (C) Determination of virus titer (log10CCID50/mL; y axis) in serum collected 3 d post-inoculation for each treatment group (mAb and mock; x axis) using an infectious cell culture assay. MAb-treated and mock-inoculated normal control groups were compared with the negative-control rDENV-2D22 IgG treatment group using an ordinary one-way ANOVA with Dunnett’s multiple comparisons test (*P < 0.05, **P < 0.01).
Fig. 2.
Fig. 2.
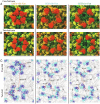
Cryo-EM reconstructions of SINV/EEEV in complex with neutralizing human anti-EEEV Fab fragments. (A) Cryo-EM reconstructions of SINV/EEEV particles in complex with neutralizing human anti-EEEV Fab fragments [EEEV-106 (Left; 5.2 Å), EEEV-94 (Middle; 6.6 Å), or EEEV-21 (Right; 5.9 Å)] were determined by single particle averaging with icosahedral symmetry. The black triangle represents the asymmetric unit, with the axes depicted by the white pentagon [fivefold (i5) axis], triangle [threefold (i3) axis], and circle [twofold (i2) axis] symbols. The q3 spikes are represented by the cyan triangles. The scale bar (in Å) represents the radial distance from the center of the virus. (B) Radial Interpretation of Viral Electron Density Maps of the viral surface. Residues within 6 Å of the backbone of the fitted Fabs [EEEV-106 (Left), EEEV-94 (Middle), or EEEV-21 (Right)] are colored yellow and constitute the epitope-binding footprint of the Fab on the viral surface. The scale bar (in Å) represents the radial distance from the center of the virus.
Fig. 3.
Fig. 3.
Human anti-EEEV Fab fragment epitope-binding footprint on the EEEV E2 protein as identified by structural analysis. (A) Surface representation of the fitted q3 spike of the asymmetric units for all three complex volumes. E1 is colored in purple, and E2 is in gray. The residues colored in red on E2 constitute the binding footprint of the respective Fab fragments [EEEV-106 (Left), EEEV-94 (Middle), or EEEV-21 (Right)]. (B) Cartoon representation of the EEEV E2 protein with the different domains (domain A, B, C, and β-ribbon connector) indicated in the Left panel. The regions of domain B colored in red constitute the epitope of the respective Fab fragments [EEEV-106 (Left), EEEV-94 (Middle), or EEEV-21 (Right)], as identified by structural analysis.
Fig. 4.
Fig. 4.
Orientation and binding mode comparison of human anti-EEEV Fab fragments at the q3–i3 spike interface of the asymmetric unit. (A) Volume surface representation at the interface of the q3 and i3 spikes are shown for all three Fab complexes [EEEV-106 (Left), EEEV-94 (Middle), or EEEV-21 (Right)]. EEEV-106, EEEV-94, or EEEV-21 Fab fragments are colored orange, cyan, or green, respectively. The virus glycoproteins are colored gray for clarity. The q3 spike, one arm of the i3 spike, and Fabs are indicated accordingly by the arrows and labels. (B) Superposition of the volume surface representations of one q3 spike and one arm of an i3 spike along the q3 axis for the indicated complexes: EEEV-106 and EEEV-21 (Left), EEEV-106 and EEEV-94 (Middle), or EEEV-94 and EEEV-21 (Right).
Fig. 5.
Fig. 5.
Human anti-EEEV Fab arrangement at the icosahedral fivefold and twofold vertices on the viral surface. Radially colored arrangement of EEEV-106 (Left), EEEV-94 (Middle), or EEEV-21 (Right) Fab fragments around the icosahedral fivefold (i5) (A) or twofold (i2) (B) axes of SINV/EEEV. (C) Distances (in Å) between the Cα atoms of the terminal heavy chain constant domain (CH1) cysteine residues (Cys216) of neighboring Fabs [EEEV-106 (Left), EEEV-94 (Middle), or EEEV-21 (Right)] at the i5 (Top) or i2 (Bottom) axes are shown for all three complexes by the dotted red lines and are indicated by the red arrows. The red spheres indicate the backbone atoms (N, Cα, C, and O) of Cys216. The heavy or light chains are colored blue or cyan, respectively. The q3 and i3 spikes are labeled in black, and the viral glycoprotein shell is faded for clarity.
Fig. 6.
Fig. 6.
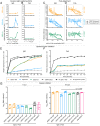
Human anti-EEEV mAbs inhibit multiple steps in the alphavirus infection cycle. (A and B) Dynamic light scattering (DLS) experiments of EEEV-106 (orange), EEEV-94 (cyan), or EEEV-21 (green) IgG (A) or Fab fragments (B) at different IgG:VLP molar ratios (x axis). The peak hydrodynamic diameter (nm) is shown on the y axis. Data are representative of two independent experiments showing mean ± SD of technical duplicates. (C and D) Analysis of EEEV-106 (orange), EEEV-94 (cyan), or EEEV-21 (green) IgG (C) or Fab fragments (D) activity through a postattachment assay (open circles). Incubation of Vero cells with SINV/EEEV was performed at 4 °C for 1 h followed by addition of mAb or Fab fragments at 4 °C for 1 h. Cells were incubated at 37 °C for 18 h to allow virus entry. mAb or Fab concentration (nM) on the x axis and percent relative infectivity on the y axis. Data are representative of two independent experiments showing mean ± SD of technical triplicates. Data corresponding to neutralization curves focus reduction neutralization tests (closed circles) were previously published (41). (E and F) Liposomal fusion assay of DiD-labeled SINV/EEEV particles incubated with liposomes in the presence of EEEV-106 (orange), EEEV-94 (cyan), EEEV-21 (green), or rDENV-2D22 (black) IgG (E) or Fab fragments (F). DiD-labeled SINV/EEEV particles were incubated in either the presence (closed circles) or absence (open squares) of antibody with liposomes. Viral fusion was triggered by the addition of 0.1 M MES, 0.2 M acetic acid pH 5.0 and relative fluorescence (y axis) was measured over 100 s (x axis). A liposome-only (gray open squares) control was included to observe background fluorescence levels. Data are representative of two independent experiments. (G) Relative RNA copies/µL of supernatant harvested at either 1 h (Left) or 6 h (Right) following mAb (closed circles) or Fab (open circles) addition at 10 µg/mL in an egress inhibition assay. RNA copies/µL were determined using a standard curve with quantitative EEEV RNA (obtained from the American Type Culture Collection) and reduction in corresponding SINV/EEEV RNA levels were compared with the SINV/EEEV-only control using an ordinary one-way ANOVA with Dunnett’s multiple comparisons test (**P < 0.01). The dengue mAb rDENV-2D22 IgG was included as an additional negative control. Data are representative of two independent qRT-PCR experiments showing mean ± SD of technical quadruplicates.
Fig. 7.
Fig. 7.
Binding kinetics of EEEV-106, EEEV-94, and EEEV-21 Fab molecules to EEEV p62-E1 heterodimer. (A) Representative raw data-binding curves for EEEV-106 (Left; orange), EEEV-94 (Middle; cyan), or EEEV-21 (Right; green) Fab molecules to recombinant EEEV p62-E1 heterodimer through biolayer interferometry. EEEV p62-E1 at 25 µg/mL was captured to anti-HIS1K biosensors and incubated with each Fab molecule at varying concentrations (20 to 200 nM) for 300 s to determine association rates of antibody binding. Dissociation was performed by incubation of the biosensors with kinetic buffer for 1,800 s. Time (in seconds) is on the x axis and nm shift is on the y axis. After reference sensor subtraction, a 1:1 binding model was used for analysis and fitted curves are shown by the red lines. Data are representative of two independent experiments. (B) Summary table of the kinetic analysis (KDkonkoff) for EEEV-106 (orange), EEEV-94 (cyan), or EEEV-21 (green) as Fab molecules to recombinant EEEV p62-E1 protein. The heatmaps correspond to differences in binding rate kinetics. For kon, an increase in blue depth (light blue: < 104 Ms−1, dark blue: ≥ 105 Ms−1) indicates faster kon rates.

Similar articles

Cited by

References

    1. Mostafavi H., Abeyratne E., Zaid A., Taylor A., Arthritogenic alphavirus-induced immunopathology and targeting host inflammation as a therapeutic strategy for alphaviral disease. Viruses 11, 290 (2019), 10.3390/v11030290. - DOI - PMC - PubMed
    1. Weaver S. C., Winegar R., Manger I. D., Forrester N. L., Alphaviruses: Population genetics and determinants of emergence. Antiviral. Res. 94, 242–257 (2012), 10.1016/j.antiviral.2012.04.002. - DOI - PMC - PubMed
    1. Lindsey N. P., Staples J. E., Fischer M., Eastern equine encephalitis virus in the United States, 2003 to 2016. Am. J. Trop. Med. Hyg. 98, 1472–1477 (2018), 10.4269/ajtmh.17-0927. - DOI - PMC - PubMed
    1. Ronca S. E., Dineley K. T., Paessler S., Neurological sequelae resulting from encephalitic alphavirus infection. Front. Microbiol. 7, 959 (2016), 10.3389/fmicb.2016.00959. - DOI - PMC - PubMed
    1. Armstrong P. M., Andreadis T. G., Eastern equine encephalitis virus–old enemy, new threat. N. Engl. J. Med. 368, 1670–1673 (2013), 10.1056/NEJMp1213696. - DOI - PubMed

Publication types

LinkOut - more resources