. 2021 Nov 17;1(11):e0000011.
doi: 10.1371/journal.pgph.0000011. eCollection 2021.

Patterns of non-communicable comorbidities at start of tuberculosis treatment in three regions of the Philippines: The St-ATT cohort

Affiliations

Patterns of non-communicable comorbidities at start of tuberculosis treatment in three regions of the Philippines: The St-ATT cohort

Sharon E Cox et al. PLOS Glob Public Health. .

Abstract

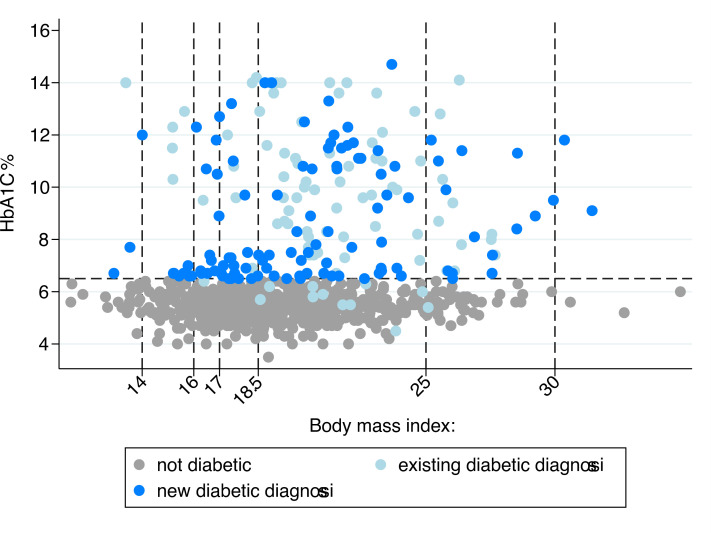
Diabetes and undernutrition are common risk factors for tuberculosis (TB), associated with poor treatment outcomes and exacerbated by TB. Limited data exist describing patterns and risk factors of multiple comorbidities in persons with TB. Nine-hundred participants (69.6% male) were enrolled in the Starting Anti-TB Treatment (St-ATT) cohort, including 133 (14.8%) initiating treatment for multi-drug resistant TB (MDR-TB). Comorbidities were defined as: diabetes, HbA1c ≥6.5% and/or on medication; hypertension, systolic blood pressure ≥140 mmHg or diastolic blood pressure ≥90 mmHg and/or on medication; anaemia (moderate/severe), haemoglobin <11g/dL; and, undernutrition (moderate/severe) body-mass-index <17 kg/m2. The most common comorbidities were undernutrition 23.4% (210/899), diabetes 22.5% (199/881), hypertension 19.0% (164/864) and anaemia 13.5% (121/899). Fifty-eight percent had ≥1 comorbid condition (496/847), with 17.1% having ≥2; most frequently diabetes and hypertension (N = 57, 6.7%). Just over half of diabetes (54.8%) and hypertension (54.9%) was previously undiagnosed. Poor glycemic control in those on medication (HbA1c≥8.0%) was common (N = 50/73, 68.5%). MDR-TB treatment was associated with increased odds of diabetes (Adjusted odds ratio (AOR) = 2.48, 95% CI: 1.55-3.95); but decreased odds of hypertension (AOR = 0.55, 95% CI: 0.39-0.78). HIV infection was only associated with anaemia (AOR = 4.51, 95% CI: 1.01-20.1). Previous TB treatment was associated with moderate/severe undernutrition (AOR = 1.98, 95% CI: 1.40-2.80), as was duration of TB-symptoms before starting treatment and household food insecurity. No associations for sex, alcohol or tobacco use were observed. MDR-TB treatment was marginally associated with having ≥2 comorbidities (OR = 1.52, 95% CI: 0.97-2.39). TB treatment programmes should plan for large proportions of persons requiring diagnosis and management of comorbidities with the potential to adversely affect TB treatment outcomes and quality of life. Dietary advice and nutritional management are components of comprehensive care for the above conditions as well as TB and should be included in planning of patient-centred services.


Conflict of interest statement

All authors declare no competing interests

Figures

Fig 1
Fig 1. Flow chart of enrolment.
Fig 2
Fig 2. Prevalence of risk behaviours by region and by drug sensitive or multi-drug resistant TB treatment regimen.
Footnotes: Smoking status: Prevalence of smoking differed significantly by region (chi2, p = 0.004) but not by MDR vs DS TB treatment regimen (chi2, p = 0.92). The relative proportion of current compared to ex-smoking behaviour differed significantly by region (chi2, p<0.001) but not by MDR vs DS TB treatment regimen (chi2, p = 0.31). Alcohol intake: Prevalence of reported regular intake of alcohol differed significantly by region (chi2, p = 0.002) but not by MDR vs DS TB treatment regimen (chi2, p = 0.55). The frequency of alcohol intake in those that reported regular drinking differed significantly by region (chi2, p<0.001) and by MDR vs DS TB treatment regimen (chi2, p = 0.036).
Fig 3
Fig 3
A. Prevalence, severity and existing and new diagnoses of diabetes and hypertension comorbidities by region and by drug sensitive or multi-drug resistant TB treatment regimen. Diabetes: HbA1c 6.5% or currently taking recognised diabetes medication. Previous diagnosis = reported diagnosis prior to TB diagnosis. Prevalence of diabetes did not differ by region (chi2 p = 0.24) but was higher in MDR vs DS TB treatment (chi2, p = 0.001). The proportion of new vs. previous diabetes diagnoses differed significantly by region (chi2, p<0.001) but not by MDR vs DS TB treatment regimen (chi2, p-0.21). Hypertension: defined as stage 2 hypertension: Systolic BP>140 mmHg OR diastolic BP>90 mmHg or currently taking recognised anti-hypertensive medication. Previous diagnosis = reported diagnosis prior to TB diagnosis. The prevalence of hypertension did not differ significantly by region (chi2, p = 0.91) but was lower in MDR vs DS TB treatment (chi2, p = 0.005). The proportion of new vs previous hypertension diagnoses did not differ by region or MDR vs DS TB treatment regimen (chi2, p = 0.741; p = 0.280). Grades of Hypertension: Elevated BP = elevated systolic BP ≥ 120 mmHg < 130 mmHg & normal diastolic BP <80 mmHg; Stage 1 Hypertension = systolic BP ≥ 130 mmHg < 140 mmHg OR diastolic BP ≥ 80 mmHg < 90 mmHg; Stage 2 hypertension: Systolic BP>140 mmHg or diastolic BP>90 mmHg. The prevalence of elevated BP/hypertension (all grades combined) did not differ significantly by region (chi2, p = 0.170) but did by MDR vs DS TB treatment regimen (chi2, p<0.001). The relative proportion of grades of hypertension (elevated, stage 1, stage 2) did not differ by region or MDR vs DS TB treatment regimen (chi2, p = 0.19, p = 0.84). B. Prevalence and severity of malnutrition and anaemia comorbidities by region and by drug sensitive or multi-drug resistant TB treatment regimen. Footnotes: Undernutrition: Mild = Body Mass Index (BMI) <18.5–17 kg/m2; Moderate = BMI <17–16 kg/m2; Severe = BMI<16 kg/m2. The prevalence of all grades of undernutrition differed significantly by region (chi2, p = 0.004) and by MDR vs DS TB treatment regimen (chi2, p = 0.005). The relative proportions of grade of undernutrition did not differ by region (chi2, p = 0.085) or by MDR vs DS TB treatment regimen (chi2, p = 0.12). Anaemia: Mild = Haemoglobin (Hb) <13.0 [male] <12.0 [female] g/dl—>11.0 g/dl; Moderate Hb ≤11.0–8.0 g/dl; Severe Hb <8.0 g/dl. The prevalence of all grades of anaemia did not vary significantly by region or by MDR vs DS TB treatment regimen (chi2, p = 0.49 & p = 0.77).
Fig 4
Fig 4. HbA1c by BMI for new and previous diabetes diagnoses at start of TB treatment.
Footnotes: y-axis: 6.5% cut-off to determine diabetes status. x-axis: BMI cut offs indicate WHO cut-offs of nutritional status; <14 = very severe thinness, <16 severe thinness, <17 = moderate thinness, <18.5 mild thinness, <25 normal, <30 overweight, ≥30 obese.
Fig 5
Fig 5. Systolic and diastolic blood pressure by age in those with and without hypertension and new vs pre-existing diagnoses.
Footnotes: Hypertension = SPB ≥ 140 mmHg OR DBP ≥ 90 mmHg OR previous diagnosis and currently taking recognised anti-hypertensive medication. Systolic blood pressure (SBP): y-axis: ≥120 mmHg indicates cut-off for elevated SBP; ≥130 mmHg indicates cut off for stage 1 hypertension; ≥140 mmHg indicates cut-off for stage 2 hypertension. Diastolic BP (DBP): y-axis: ≥80 indicates cut-off for elevated DBP; ≥90 indicates cut off for stage 2 hypertension (AHA 2017 criteria [22]).
Fig 6
Fig 6
Venn diagrams of comorbidities in those with complete data for all 4 comorbidities for [A] All participants, N = 847; [B] participants initiating drug sensitive TB treatment regimens, N = 718; [C] participants initiating multi drug resistant TB treatment regimens, N = 129. Footnotes: Diabetes: HbA1c≥6.5% OR on current recognised medication; Hypertension: Stage 2, SPB ≥ 140 mmHg OR DBP ≥ 90 mmHg OR previous diagnosis and currently taking recognised anti-hypertensive medication; Anaemia: Moderate or severe haemoglobin ≤11.0 g/dL; Malnutrition: moderate or severe, BMI <17 kg/m2.

Similar articles

Cited by

References

    1. Duarte R, Lonnroth K, Carvalho C, Lima F, Carvalho ACC, Munoz-Torrico M, et al.. Tuberculosis, social determinants and co-morbidities (including HIV). Pulmonology. 2018;24(2):115–9. Epub 2017/12/26. doi: 10.1016/j.rppnen.2017.11.003 . - DOI - PubMed
    1. WHO. Global TB Report. 2020.
    1. Food and Nutrition Research Institute DoSaT, the Philippines,. 8th National Nutrition Survey2015 12th Jan 2019. Available from: http://www.fnri.dost.gov.ph/index.php/nutrition-statistic/19-nutrition-s....
    1. Mendenhall E, Kohrt BA, Norris SA, Ndetei D, Prabhakaran D. Non-communicable disease syndemics: poverty, depression, and diabetes among low-income populations. Lancet. 2017;389(10072):951–63. Epub 2017/03/09. doi: 10.1016/S0140-6736(17)30402-6 ; PubMed Central PMCID: PMC5491333. - DOI - PMC - PubMed
    1. Lonnroth K, Williams BG, Cegielski P, Dye C. A consistent log-linear relationship between tuberculosis incidence and body mass index. Int J Epidemiol. 2010;39(1):149–55. doi: 10.1093/ije/dyp308 . - DOI - PubMed

LinkOut - more resources